. 2025 Feb 28;24(1):95.
doi: 10.1186/s12933-025-02654-3.

Relationship between atherogenic index of plasma and length of stay in critically ill patients with atherosclerotic cardiovascular disease: a retrospective cohort study and predictive modeling based on machine learning

Affiliations

Relationship between atherogenic index of plasma and length of stay in critically ill patients with atherosclerotic cardiovascular disease: a retrospective cohort study and predictive modeling based on machine learning

Yu Guo et al. Cardiovasc Diabetol. .

Abstract

Background: The atherogenic index of plasma (AIP) is considered an important marker of atherosclerosis and cardiovascular risk. However, its potential role in predicting length of stay (LOS), especially in patients with atherosclerotic cardiovascular disease (ASCVD), remains to be explored. We investigated the effect of AIP on hospital LOS in critically ill ASCVD patients and explored the risk factors affecting LOS in conjunction with machine learning.

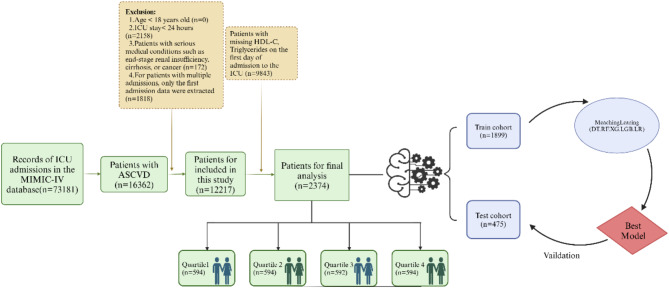
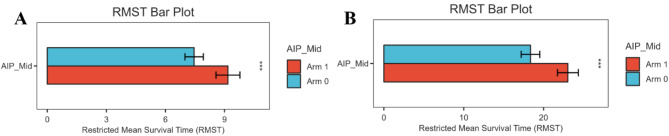
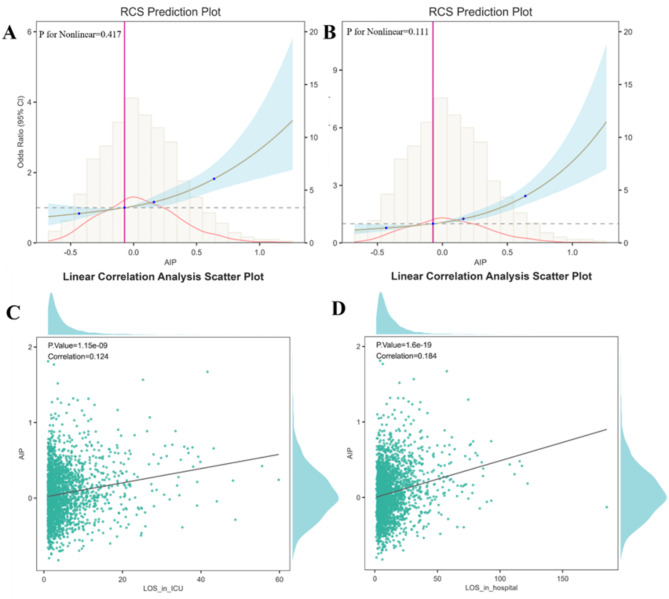
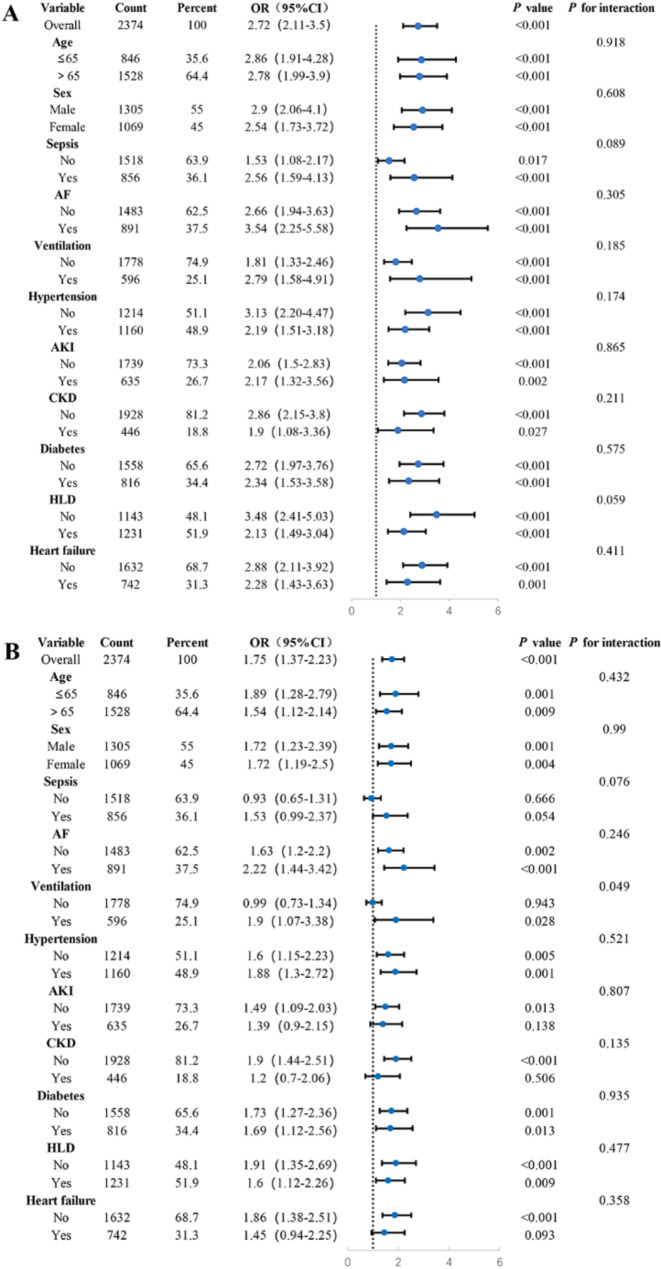
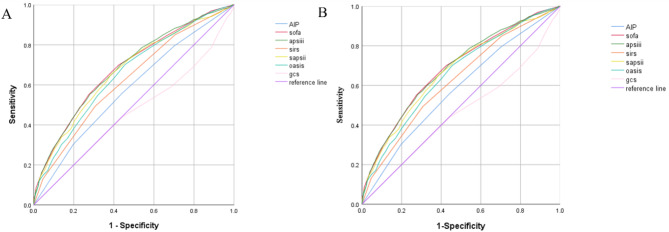
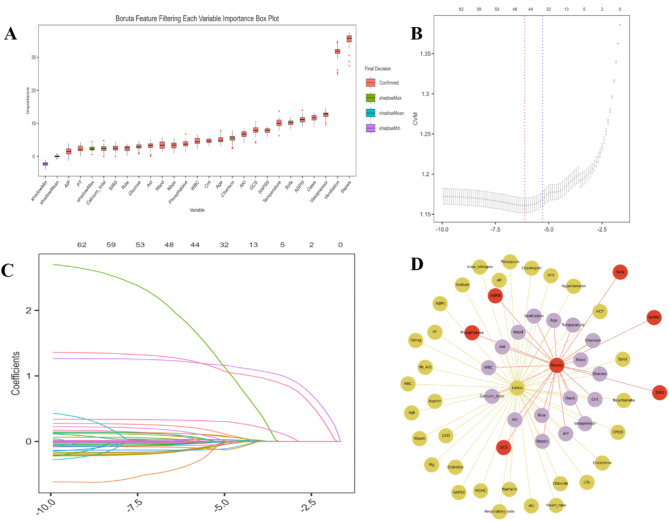
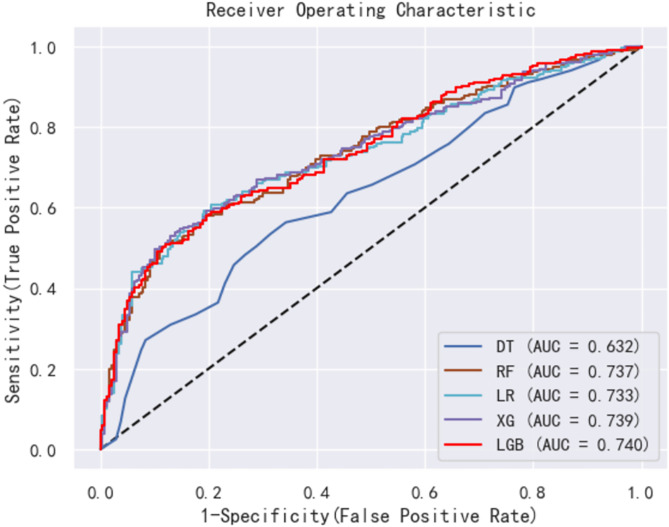
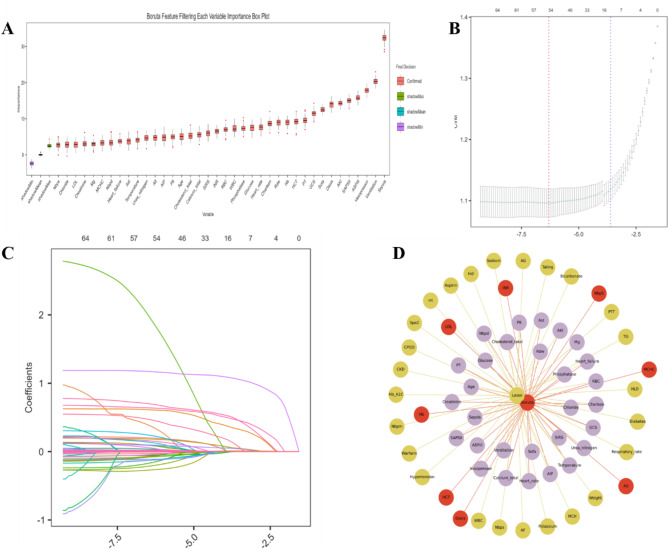
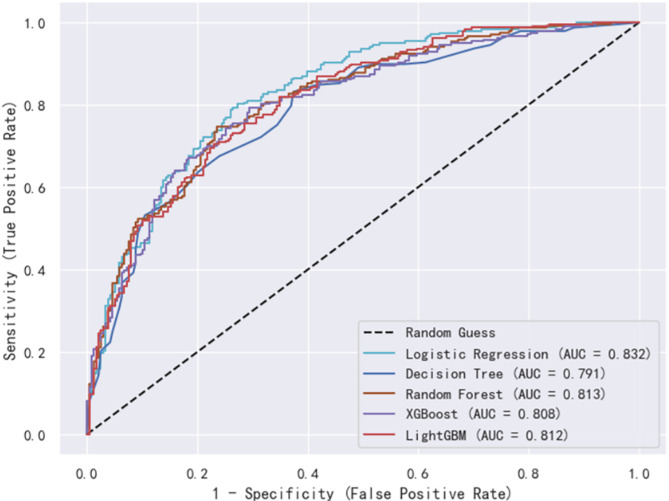
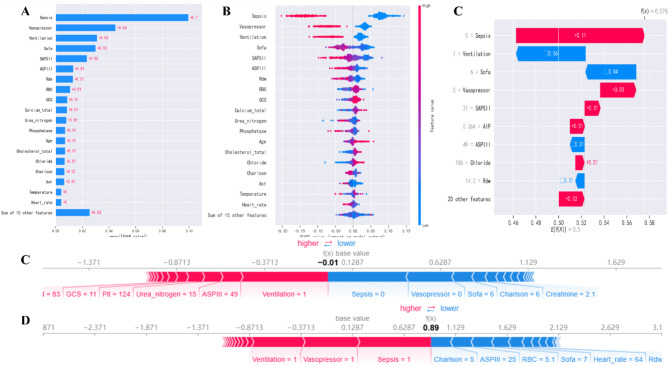
Methods: Using data from the Medical Information Mart for Intensive Care (MIMIC)-IV. AIP was calculated as the logarithmic ratio of TG to HDL-C, and patients were stratified into four groups based on AIP values. We investigated the association between AIP and two key clinical outcomes: ICU LOS and total hospital LOS. Multivariate logistic regression models were used to evaluate these associations, while restricted cubic spline (RCS) regressions assessed potential nonlinear relationships. Additionally, machine learning (ML) techniques, including logistic regression (LR), decision tree (DT), random forest (RF), extreme gradient boosting (XGB), and light gradient boosting machine (LGB), were applied, with the Shapley additive explanation (SHAP) method used to determine feature importance.

Results: The study enrolled a total of 2423 patients with critically ill ASCVD, predominantly male (54.91%), and revealed that higher AIP values were independently associated with longer ICU and hospital stays. Specifically, for each unit increase in AIP, the odds of prolonged ICU and hospital stays were significantly higher, with adjusted odds ratios (OR) of 1.42 (95% CI, 1.11-1.81; P = 0.006) and 1.73 (95% CI, 1.34-2.24; P < 0.001), respectively. The RCS regression demonstrated a linear relationship between increasing AIP and both ICU LOS and hospital LOS. ML models, specifically LGB (ROC:0.740) and LR (ROC:0.832) demonstrated superior predictive accuracy for these endpoints, identifying AIP as a vital component of hospitalization duration.

Conclusion: AIP is a significant predictor of ICU and hospital LOS in patients with critically ill ASCVD. AIP could serve as an early prognostic tool for guiding clinical decision-making and managing patient outcomes.

Keywords: AIP; Atherosclerotic cardiovascular disease; LOS; MIMIC-IV; Machine learning.


Conflict of interest statement

Declarations. Ethics approval and consent to participate: The study was an analysis of a third-party anonymized publicly available database with pre-existing institutional review board (IRB) approval. Consent for publication: Not applicable. Competing interests: The authors declare no competing interests.

Figures

Fig. 1
Fig. 1
Flow chart of the study design. LR: logistic regression; DT: decision tree; RF: random forest; XG: extreme gradient boosting; LGB: light gradient boosting machine
Fig. 2
Fig. 2
Kaplan–Meier survival analysis curves of the two cohorts, ICU length of stay (A), length of hospitalization (B). The horizontal coordinate is the length of hospital stay, the vertical coordinate represents the discharge rate
Fig. 3
Fig. 3
Restricted mean survival time graph of A ICU length of stay and B length of hospitalization
Fig. 4
Fig. 4
Restricted cubic spline analysis illustrating AIP with ICU length of stay (A), and length of hospitalization (B). Linear correlation scatterplot for AIP with ICU length of stay (C), and length of hospitalization (D)
Fig. 5
Fig. 5
Forest plots illustrating stratified analyses of the association of AIP and ICU LOS (A), and hospital LOS (B)
Fig. 6
Fig. 6
Comparison of AIP and existing clinical scoring systems A ICU LOS B Hospital LOS
Fig. 7
Fig. 7
AIP and ICU LOS Feature Selection Chart (A) Feature selection based on the Boruta algorithm. The horizontal axis is the name of each variable, and the vertical axis is the Z value of each variable. The box plot shows the Z value of each variable during model calculation. (B, C) Path diagrams and cross-validation plots of lasso regression analysis results. (D) Feature selection network diagram. The yellow section shows the results of the LASSO regression analysis, the red section shows the results of the Boruta algorithm, and the purple section shows the overlapping variables of the results of the two algorithms
Fig. 8
Fig. 8
ROC curves for the machine learning models. LR: logistic regression; DT: decision tree; RF: random forest; XG: extreme gradient boosting; LGB: light gradient boosting machine ROC: receiver operating characteristic; AUC: area under the curve
Fig. 9
Fig. 9
Global and local model explanation by the SHAP method. A SHAP summary bar plot. This plot evaluates the contribution of each feature to the model using mean SHAP values, displayed in descending order. B SHAP summary dot plot. The probability of the length of stay in ICU increases with the SHAP values of the features. Each dot represents a patient’s SHAP value for a given feature, with red indicating higher feature values and blue indicating lower values. Dots are stacked vertically to show density. C SHAP waterfall plot. This plot shows the contribution of each feature to the prediction result of one patient using the LGB(LightGBM) model. Red bars indicate features that contribute positively to the prediction, while blue bars indicate negative contributions. D, E SHAP force plot. Force diagrams for two different ending patients. RDW: Red blood cell distribution width; Nbps: Noninvasive Blood Pressure; AST: Aspartate transaminase; WBC: White blood cell; AIP: atherogenic index of plasma; AKI: Acute kidney injury; CRRT: Continuous Renal Replacement Therapy
Fig. 10
Fig. 10
AIP and hospital LOS Feature Selection Chart A Feature selection based on the Boruta algorithm. The horizontal axis is the name of each variable, and the vertical axis is the Z value of each variable. The box plot shows the Z value of each variable during model calculation. B, C Path diagrams and cross-validation plots of lasso regression analysis results. D Feature selection network diagram. The yellow section shows the results of the LASSO regression analysis, the red section shows the results of the Boruta algorithm, and the purple section shows the overlapping variables of the results of the two algorithms
Fig. 11
Fig. 11
ROC curves for the machine learning models. LR: logistic regression; DT: decision tree; RF: random forest; XG: extreme gradient boosting; LGB: light gradient boosting machine ROC: receiver operating characteristic; AUC: area under the curve
Fig. 12
Fig. 12
Global and local model explanation by the SHAP method. A SHAP summary bar plot. This plot evaluates the contribution of each feature to the model using mean SHAP values, displayed in descending order. B SHAP summary dot plot. The probability of the length of hospitalization increases with the SHAP values of the features. Each dot represents a patient’s SHAP value for a given feature, with red indicating higher feature values and blue indicating lower values. Dots are stacked vertically to show density. C SHAP waterfall plot. This plot shows the contribution of each feature to the prediction result of one patient using the LR (Logistic Regression) model. Red bars indicate features that contribute positively to the prediction, while blue bars indicate negative contributions. D, E SHAP force plot. Force diagrams for two different ending patients. RDW: Red blood cell distribution width; RBC: Red blood cell; AST: Aspartate transaminase

References

    1. Roth GA, Mensah GA, Johnson CO, Addolorato G, Ammirati E, Baddour LM, Barengo NC, Beaton AZ, Benjamin EJ, Benziger CP, et al. Global burden of cardiovascular diseases and risk factors, 1990–2019: update from the GBD 2019 study. J Am Coll Cardiol. 2020;76(25):2982–3021. - PMC - PubMed
    1. Balakumar P, Maung UK, Jagadeesh G. Prevalence and prevention of cardiovascular disease and diabetes mellitus. Pharmacol Res. 2016;113(Pt A):600–9. - PubMed
    1. Chen W, Thomas J, Sadatsafavi M, FitzGerald JM. Risk of cardiovascular comorbidity in patients with chronic obstructive pulmonary disease: a systematic review and meta-analysis. Lancet Respir Med. 2015;3(8):631–9. - PubMed
    1. Hu P, Dharmayat KI, Stevens CAT, Sharabiani MTA, Jones RS, Watts GF, Genest J, Ray KK, Vallejo-Vaz AJ. Prevalence of Familial hypercholesterolemia among the general population and patients with atherosclerotic cardiovascular disease: a systematic review and meta-analysis. Circulation. 2020;141(22):1742–59. - PubMed
    1. Mostofsky E, Chahal HS, Mukamal KJ, Rimm EB, Mittleman MA. Alcohol and immediate risk of cardiovascular events: a systematic review and dose-response meta-analysis. Circulation. 2016;133(10):979–87. - PMC - PubMed

MeSH terms

LinkOut - more resources