. 2025 Feb 28;13(1):56.
doi: 10.1186/s40168-025-02045-6.

Microbiota-derived urolithin A in monoclonal gammopathies and multiple myeloma therapy

Affiliations

Microbiota-derived urolithin A in monoclonal gammopathies and multiple myeloma therapy

Alba Rodríguez-García et al. Microbiome. .

Abstract

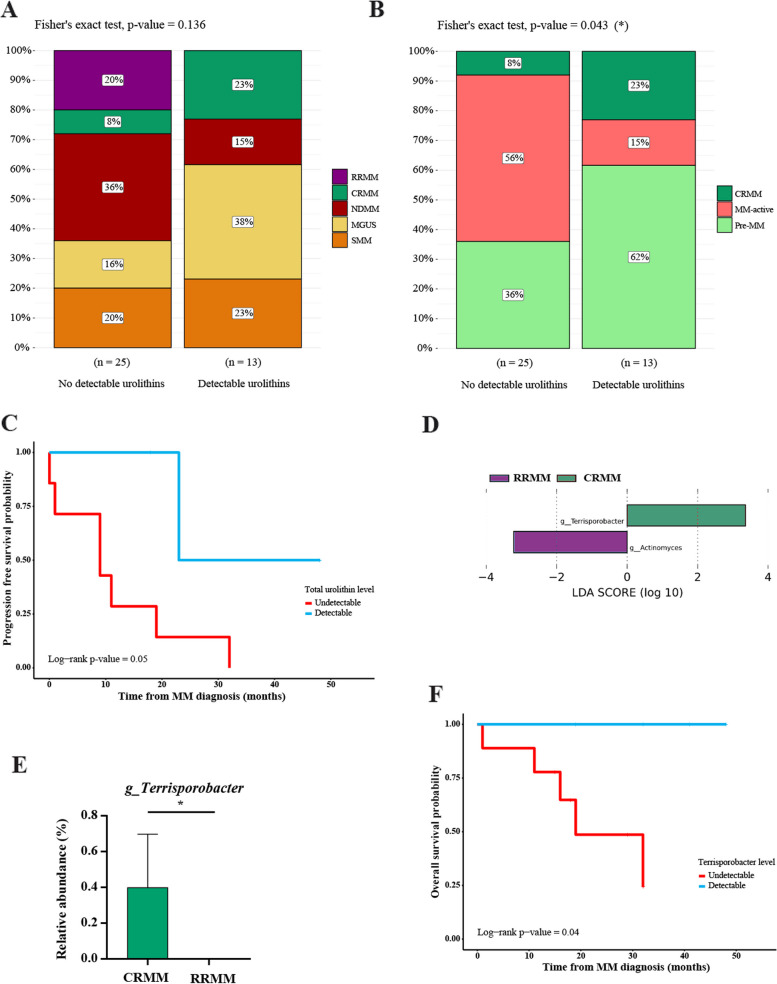
Background: Gut microbiota-derived urolithins may influence multiple myeloma (MM) disease progression and treatment. We analyzed urolithins and their associated microbiota in a retrospective cohort of 45 patients with active MM or premalignant disease using mass spectrometry and 16S rRNA gene sequencing.

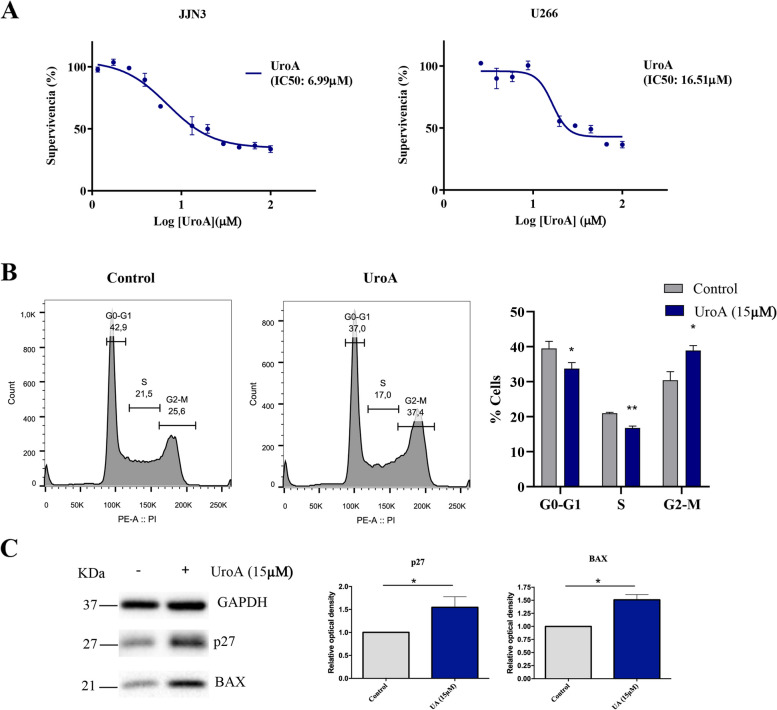
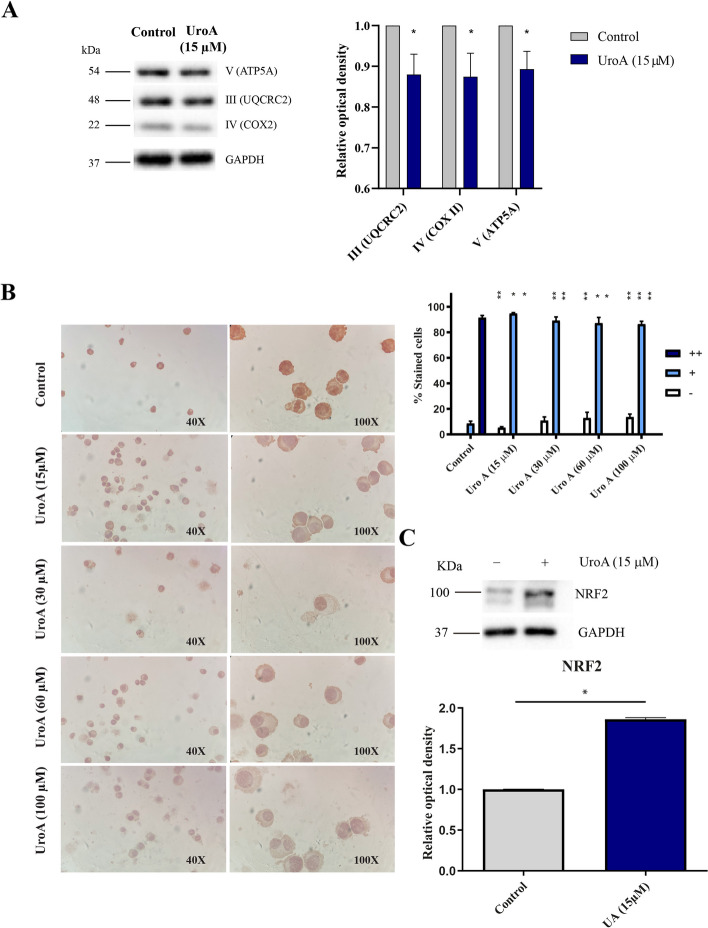
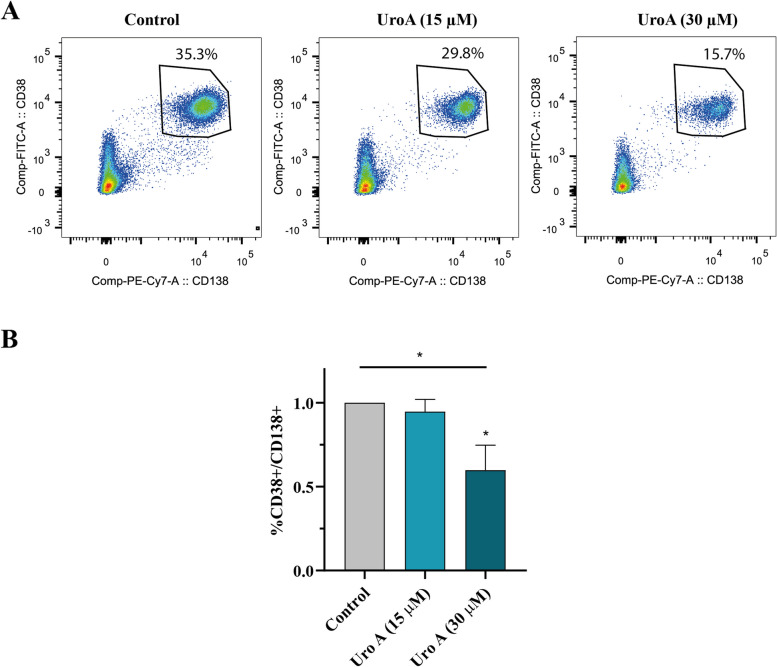
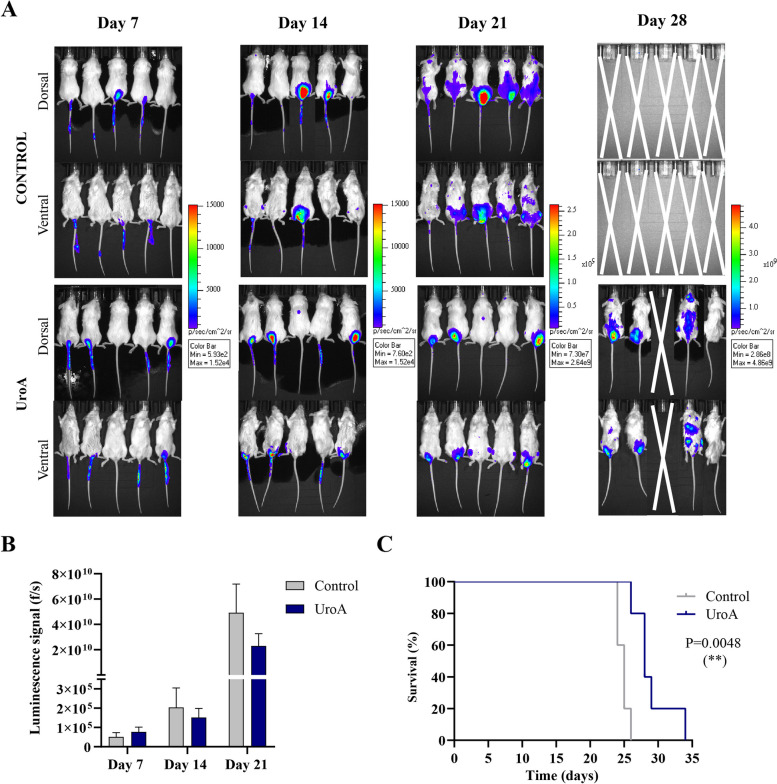
Results: Patients with detectable levels of urolithin in serum and stool and a higher abundance of urolithin-related microbiota had a better outcome. Analysis of the effects of urolithin A (UroA) treatment ex vivo, in vitro, and in vivo revealed that UroA is cytotoxic against MM cell lines and modulates the cell cycle and mitochondrial activity. Notably, UroA inhibits the proliferation of primary MM cells in vitro and in a xenograft mouse model, improving overall survival. Finally, combination therapy with UroA and bortezomib has a synergistic effect in vitro, even in the presence of bortezomib resistance, and modulates signaling pathways involved in MM development.

Conclusions: UroA might be a potential therapeutic agent to halt MM disease progression or to overcome resistance when used in combination. Video Abstract.

Keywords: Gut microbiota; Metabolites; Multiple myeloma; Urolithin.


Conflict of interest statement

Declarations. Ethics approval and consent to participate: The study was approved by the Hospital 12 de Octubre Ethical Committee (21/580), and all patients and donors provided written informed consent following the Declaration of Helsinki. Consent for publication: Not applicable. Competing interests: The authors declare no competing interests.

Figures

Fig. 1
Fig. 1
A Proportion (%) of patients with monoclonal gammopathy of undetermined significance (MGUS), smoldering myeloma (SMM), new diagnosed MM (NDMM), MM in complete remission (CRMM), and at relapse/refractory (RRMM) with detectable or undetectable levels of urolithins in stool. B Proportion (%) of patients with premalignant disease (MGUS and SMM), active MM (NDMM and RRMM), and CRMM with detectable or undetectable levels of urolithins in stool. C Representation of the Kaplan–Meier progression-free survival probability (PFS) in patients after receiving treatment (CRMM and RRMM) with undetectable (red) or detectable (blue) stool urolithins. D Taxonomic biomarkers identified by LEfSe analysis between patients with RRMM and CRMM. E Relative abundance (%) of the genus Terrisporobacter in patients with CRMM and RRMM. F Representation of the Kaplan–Meier overall survival probability (OS) of treated patients (RRMM and CRMM) with undetectable (red) or detectable (blue) stool levels of Terrisporobacter. *P ≤ 0.05; **P ≤ 0.01
Fig. 2
Fig. 2
A Dose–response curves of urolithin A (UroA) treatment in JJN3 and U266 cell lines after 48 h. The mean ± SEM of the data normalized to the control condition is shown. B Representation of the cell cycle in JJN3 cells after 24 h of exposure to UroA: the histogram shows the DNA content and cell count at the different stages of the cell cycle, and the bar chart shows the distribution by phases (G0/G1 phase, S phase, and G2/M phase). C Western blot analysis of the expression levels of p27 and BAX in untreated (control, DMSO) and treated JJN3 cells exposed to urolithin A (UroA) for 48 h. Bar graphs represent the mean ± SEM of the expression of the complexes normalized to the expression of glyceraldehyde 3-phosphate dehydrogenase (GAPDH) as a loading control. *P ≤ 0.05
Fig. 3
Fig. 3
A Western blot analysis of the expression levels of oxidative phosphorylation system complexes in untreated (control, DMSO) and treated JJN3 cells exposed to urolithin A (UroA) for 48 h. The complexes studied were as follows: NADH dehydrogenase beta subcomplex subunit 8 of complex I (NDUFB8), succinate dehydrogenase subunit B of complex II (SDHB), cytochrome c oxidase complex subunit 1 of complex IV (MTCO1), cytochrome b-c1 complex subunit 2 of complex III (UQCRC2), and ATP synthase subunit alpha of complex V (ATP5A). Bar graphs represent the mean ± SEM of the expression of the complexes normalized to the expression of glyceraldehyde 3-phosphate dehydrogenase (GAPDH) as a loading control. B Immunocytochemistry analysis of HNE adduction in JJN3 cells after exposure to DMSO or UroA at different concentrations for 48 h. Bar chart shows the percentage of stained (+ or + + levels of intensity) or non-stained ( −) cells. C Western blot analysis of the expression levels of NRF2 in untreated (control, DMSO) and treated JJN3 cells exposed to urolithin A (UroA) for 48 h. Bar graphs represent the mean ± SEM of the expression of the complexes normalized to the expression of glyceraldehyde 3-phosphate dehydrogenase (GAPDH) as a loading control. *P ≤ 0.05; **P ≤ 0.01
Fig. 4
Fig. 4
A Representative dot plots showing changes in the plasma cell population upon 48-h exposure to urolithin A (UroA) at 15 μM (n = 5) or 30 μM (n = 2). Numbers represent the proportion of CD38 and CD138 positive cells. B Bar chart shows the mean of CD38 /CD138 positive cells ± SEM populations in all patients analyzed normalized against the vehicle control. *P ≤ 0.05
Fig. 5
Fig. 5
A Bioluminescence analysis in dorsal and ventral position of the urolithin A (UroA)-treated group and the control group exposed to DMSO, after 7, 14, 21, and 28 days from the start of the experiment. B Comparison of the luminescent signal between the control and UroA-treated groups at days 7, 14, and 21. The mean ± SEM luminescent signal obtained in photons per second (f/s) is plotted. C Kaplan–Meier survival analysis of the control and UroA-treated groups. **P ≤ 0.01

References

    1. Kyle RA, Remstein ED, Therneau TM, Dispenzieri A, Kurtin PJ, Hodnefield JM, Larson DR, Plevak MF, Jelinek DF, Fonseca R, et al. Clinical course and prognosis of smoldering (asymptomatic) multiple myeloma. N Engl J Med. 2007;356:2582–90. 10.1056/NEJMoa070389. - PubMed
    1. McShane CM, Murray LJ, Engels EA, Landgren O, Anderson LA. Common community-acquired infections and subsequent risk of multiple myeloma: a population-based study: infections and multiple myeloma. Int J Cancer. 2014;134:1734–40. 10.1002/ijc.28479. - PMC - PubMed
    1. Bigot-Corbel E, Gassin M, Corre I, Le Carrer D, Delaroche O, Hermouet S. Hepatitis C virus (HCV) infection, monoclonal immunoglobulin specific for HCV core protein, and plasma-cell malignancy. Blood. 2008;112:4357–8. 10.1182/blood-2008-07-167569. - PubMed
    1. Li Y, Li Y, Zhang L, Li W. Hepatitis C virus infection and risk of multiple myeloma: evidence from a meta-analysis based on 17 case-control studies. J Viral Hepat. 2017;24:1151–9. 10.1111/jvh.12742. - PubMed
    1. Yan J, Wang J, Zhang W, Chen M, Chen J, Liu W. Solitary plasmacytoma associated with Epstein-Barr virus: a clinicopathologic, cytogenetic study and literature review. Ann Diagn Pathol. 2017;27:1–6. 10.1016/j.anndiagpath.2016.09.002. - PubMed

MeSH terms

LinkOut - more resources