. 2025 May;292(10):2688-2709.
doi: 10.1111/febs.70033. Epub 2025 Feb 28.

The m6A demethylase FTO promotes C/EBPβ-LIP translation to perform oncogenic functions in breast cancer cells

Affiliations

The m6A demethylase FTO promotes C/EBPβ-LIP translation to perform oncogenic functions in breast cancer cells

Hidde R Zuidhof et al. FEBS J. 2025 May.

Abstract

N6-methyladenosine (m6A) is a prevalent posttranscriptional mRNA modification involved in the regulation of transcript turnover, translation, and other aspects of RNA fate. The modification is mediated by multicomponent methyltransferase complexes (so-called writers) and is reversed through the action of the m6A-demethylases fat mass and obesity-associated (FTO) and alkB homolog 5 (ALKBH5) (so-called erasers). FTO promotes cell proliferation, colony formation and metastasis in models of triple-negative breast cancer (TNBC). However, little is known about genome-wide or specific downstream regulation by FTO. Here, we examined changes in the genome-wide transcriptome and translatome following FTO knockdown in TNBC cells. Unexpectedly, FTO knockdown had a limited effect on the translatome, while transcriptome analysis revealed that genes related to extracellular matrix (ECM) and epithelial-mesenchymal transition (EMT) are regulated through yet unidentified mechanisms. Differential translation of CEBPB mRNA into the C/EBPβ transcription factor isoform C/EBPβ-LIP is known to act in a pro-oncogenic manner in TNBC cells through regulation of EMT genes. Here we show that FTO is required for efficient C/EBPβ-LIP expression, suggesting that FTO has oncogenic functions through regulation of C/EBPβ-LIP.

Keywords: C/EBPβ; FTO; breast cancer; mRNA translation.


Conflict of interest statement

The authors declare no competing interests.

Figures

Fig. 1
Fig. 1
FTO knockdown increases m6A loading of mRNAs. (A) m6A dot blot of 100 ng mRNA from MDA‐MB‐231 cells or 150 ng mRNA from MCF‐7 cells with FTO knockdown (shFTO1 or shFTO2) versus scrambled‐shRNA (scr) control. The blots shown are representative of 3 biological replicates used for quantification of m6A signal relative to scr control shown beneath the blot. Methylene blue staining is shown as loading control. (B) RT‐qPCR analysis of FTO and ALKBH5 gene expression in MDA‐MB‐231 or MCF‐7 cells with FTO knockdown (shFTO1 or shFTO2) versus scrambled‐shRNA control (scr). Values are normalized to scr control per gene. Significance was determined by one‐way ANOVA with Dunnett's post hoc test, ***P < 0.001 (mean ± SD, n = 3 biological replicates).
Fig. 2
Fig. 2
FTO knockdown impairs breast cancer cell proliferation and migration. (A) Clonogenic assay of MDA‐MB‐231 and MCF‐7 cells with FTO knockdown (shFTO1) or scrambled control (scr). Cells were harvested and stained after 7 days in cell culture. Quantification for two independent knockdown constructs (shFTO1 and shFTO2) is shown in the middle. At the right, immunoblots showing FTO expression levels in FTO knockdown cells and scr control cells, and β‐Actin was used as loading control. Values are shown as mean (−) and individual data points (n = 3); significance was determined by one‐way ANOVA with Dunnett's post hoc test, **P < 0.01, ***P < 0.001 (n = 3 biological replicates). (B) Transwell migration assay of MDA‐MB‐231 cells with FTO knockdown (shFTO1 or shFTO2) or scrambled control (scr) at 48 h. Scale bar represents 500 μm. Quantification is shown at the right. Values are shown as mean (−) and individual data points (n = 3); significance determined by one‐way ANOVA with Dunnett's post hoc test, **P < 0.01 (n = 3 biological replicates). (C) Time course of live‐cell imaging scratch wound assays using IncuCyte (Sartorius) of MDA‐MB‐231 cells with FTO knockdown (shFTO1 or shFTO2) or scrambled control (scr). Scale bar represents 300 μm. Quantification is shown at the right. Significance was determined by one‐way ANOVA with Dunnett's post hoc test, **P < 0.01 (mean ± SEM, n = 4 biological replicates). (D) Transwell migration assay of MDA‐MB‐231 cells with FTO knockdown (shFTO1) with re‐expression of FTO or empty vector (EV) control at 48 h. Scale bar represents 500 μm. Quantification of cell migration is shown as mean (−) and individual data points (n = 6, technical replicates); significance was determined by Student's t‐test, *P < 0.05. At the right immunoblots showing FTO re‐expression or empty vector (EV) control in FTO knockdown MDA‐MB‐231 cells, and β‐Actin as loading control. (E) Cell viability assay of MDA‐MB‐231 and MCF‐7 cells treated with 25 or 50 μm entacapone or DMSO control for 3 days. Values are shown as mean (−) and individual data points (n = 3); significance was determined by one‐way ANOVA with Dunnett's post hoc test, **P < 0.01, ***P < 0.001 (n = 3 biological replicates). (F) Transwell migration assay at 48 h of MDA‐MB‐231 cells treated with 25 μm entacapone or DMSO. Scale bar represents 500 μm. Quantification is shown at the right as mean (−) and individual data points (n = 6); significance determined by Student's t‐test. **P < 0.01 (n = 3 biological replicates).
Fig. 3
Fig. 3
FTO knockdown impairs cell proliferation and migration in untransformed MCF10A cells. (A) A representative immunoblot showing FTO expression levels in MCF10A cells with FTO knockdown (shFTO1 or shFTO2) or in scrambled‐shRNA control cells (scr) (n = 3 technical replicates). The immunoblot showing β‐Actin expression was used as loading control. (B) Cell viability assay of MCF10A cells with FTO knockdown (shFTO1 or shFTO2) or scrambled control (scr) after cultivation for 3 days. Significance was determined by one‐way ANOVA with Dunnett's post hoc test, *P < 0.05, ***P < 0.001 (n = 4) biological replicates. (C) Transwell migration assay of MCF10A cells with FTO knockdown (shFTO1 or shFTO2) or scrambled control (scr) at 48 h. Scale bar represents 500 μm. Quantification is shown at the right. Significance determined by one‐way ANOVA with Dunnett's post hoc test, ***P < 0.001, ****P < 0.0001 (n = 4 biological replicates).
Fig. 4
Fig. 4
Transcriptome analysis revealing FTO‐regulated extracellular matrix (ECM) and epithelial‐mesenchymal transition (EMT) genes. (A) Transcriptome analysis of MDA‐MB‐231 cells with FTO knockdown versus scrambled‐shRNA (scr) control (n = 2 biological replicates). Significantly regulated genes are displayed in either red (downregulated) or green (upregulated)(fold change >1.5; FDR <0.05). (B) Gene set enrichment analysis (GSEA) for the hallmark epithelial‐mesenchymal transition shows significant negative enrichment in MDA‐MB‐231 FTO knockdown cells versus scrambled‐shRNA (scr) control. (C) Gene ontology (GO) term analysis of biological processes downregulated upon FTO knockdown in MDA‐MB‐231 cells versus scrambled‐shRNA control. Significantly enriched GO‐terms (P < 0.001) are shown with their respective P‐values (Fisher elim. topGO). (D) RT‐qPCR analysis of ECM/EMT‐related genes found to be downregulated upon FTO knockdown (shFTO1 or shFTO2) versus shRNA‐scrambled (scr) control in MDA‐MB‐231 cells. Significance was determined by one‐way ANOVA with Dunnett's post hoc test, *P < 0.05, **P < 0.01, ***P < 0.001 (mean ± SD, n = 3 biological replicates). (E) RT‐qPCR analysis of ECM/EMT‐related genes in MDA‐MB‐231 FTO knockdown (shFTO1) cells after re‐expression of FTO compared to empty vector (EV) control. Significance was determined by one‐way ANOVA with Dunnett's post hoc test, *P < 0.05, **P < 0.01 (mean ± SD, n = 3 biological replicates).
Fig. 5
Fig. 5
Analysis of specific genes regulation by FTO knockdown or inhibition of FTO. (A) Left graph, RT‐qPCR analysis of LRP1, SMARCD3 and CREB5 expression in MDA‐MB‐231 cells upon FTO knockdown (shFTO1 or shFTO2) versus shRNA‐scrambled (scr) control. Significance was determined by one‐way ANOVA with Dunnett's post hoc test, *P < 0.05, **P < 0.01 (mean ± SD, n = 3 biological replicates). Right graph, RT‐qPCR analysis of LRP1, SMARCD3 and CREB5 expression in MDA‐MB‐231 cells treated with 25 or 50 μm entacapone or DMSO for 3 days. Significance was determined by one‐way ANOVA with Dunnett's post hoc test, ***P < 0.001 (mean ± SD, n = 3 biological replicates). (B) RT‐qPCR analysis of BNIP3 expression in MDA‐MB‐231 cells with FTO knockdown (shFTO1 or shFTO2) versus shRNA‐scrambled (scr) control. Significance was determined by one‐way ANOVA with Dunnett's post hoc test, *P < 0.05, **P < 0.01, ***P < 0.001 (mean ± SD, n = 3 biological replicates).
Fig. 6
Fig. 6
FTO does not regulate ECM/EMT target gene transcript stability or level of m6A modification. (A) Decay curves of FTO mRNA in MDA‐MB‐231 cells with FTO knockdown (shFTO1) versus scrambled‐shRNA (scr) control. Significance was determined by multiple Student's t‐test with Holm‐Sidak correction, ***P < 0.001 (mean ± SEM, n = 3 biological replicates). (B) Decay curves of mRNA from indicated genes in MDA‐MB‐231 cells with FTO knockdown (shFTO1) versus scrambled (scr) control. Significance was determined by multiple Student's t‐test with Holm‐Sidak correction (mean ± SEM, n = 3 biological replicates). (C) Quantification of mRNA‐m6A levels of indicated genes in MDA‐MB‐231 cells with FTO knockdown (shFTO1 or shFTO2) versus scrambled (scr) control by MeRIP‐qPCR. Significance was determined by one‐way ANOVA with Dunnett's post hoc test.*P < 0.05, **P < 0.01. n.d.: not detected (mean ± SEM, n = 3 biological replicates).
Fig. 7
Fig. 7
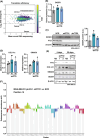
FTO knockdown has a limited effect on mRNA translation. (A) Fold change in translation efficiency upon FTO knockdown in MDA‐MB‐231 cells is displayed, color coded by FDR. Significantly regulated genes above threshold are indicated by gene symbol. (B) RT‐qPCR analysis of DICER mRNA expression in MDA‐MB‐231 cells with FTO knockdown (shFTO1 or shFTO2) versus shRNA‐scrambled (scr) control. Significance was determined by one‐way ANOVA with Dunnett's post hoc test (mean ± SEM, n = 3 biological replicates). (C) Immunoblots showing no change in DICER protein expression upon knockdown of FTO (shFTO1 or shFTO2) in MDA‐MB‐231 versus scrambled control (SCR). β‐Actin was used as loading control. Quantification is shown on the right. Significance was determined by one‐way ANOVA with Dunnett's post hoc test (mean ± SEM, n = 3 biological replicates). (D) RT‐qPCR analysis of COL1A1 and SMAD6 mRNA expression in MDA‐MB‐231 upon FTO knockdown (shFTO1 or shFTO2) versus shRNA‐scrambled (scr) control. Significance was determined by one‐way ANOVA with Dunnett's post hoc test (mean ± SD, n = 3 biological replicates). (E) Immunoblot analysis of COL1A1, SMAD6, and DICER protein expression in MDA‐MB‐231 upon FTO knockdown (shFTO1 or shFTO2) versus shRNA‐scrambled (scr) control, and β‐Actin as loading control. 5 days and 20 days refer to days in cell culture after transduction with shRNA retroviral vector. (F) Subsequence abundance analysis of codons at the +15 position relative to the ribosome protected fragment (RPF) 5′‐end. All transcripts in the coding frame are considered for this analysis. No significant enrichment or depletion of codons can be seen, indicating no obvious shortages of amino acids causing ribosome stalls/halts.
Fig. 8
Fig. 8
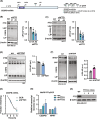
FTO or WTAP knockdown reciprocally regulates C/EBPβ isoform expression. (A) Schematic overview of the human CEBPB mRNA with indicated translation start sites for LAP1, LAP2, LIP and the uORF. Predicted (SRAMP [41]) and experimentally detected m6A modifications from HEK293T cells (miCLIP: Linder et al. 2015 [42], DARTseq Meyer 2019 [43]) are indicated with adenosine base number. (B) Immunoblot showing reduced levels of C/EBPβ‐LIP upon knockdown of FTO (shFTO1 or shFTO2) in MDA‐MB‐231 cells versus scrambled control (scr). β‐Actin was used as loading control. Quantification of C/EBPβ‐LIP/LAP ratio with significance determined by Student's t‐test. *P < 0.05 (n = 3 biological replicates). (C) Immunoblot showing reduced levels of C/EBPβ‐LIP upon knockdown of FTO (shFTO1 or shFTO2) in MCF‐7 cells versus scrambled control (scr). β‐Actin was used as loading control. Quantification of C/EBPβ‐LIP/LAP ratio with significance determined by Student's t‐test. **P < 0.01, ***P < 0.001 (n = 4 biological replicates). (D) Immunoblot showing reduced levels of C/EBPβ‐LIP upon knockdown of FTO (shFTO1) in MEF cells versus scrambled control (SCR). β‐Actin was used as loading control. Quantification of C/EBPβ‐LIP/LAP ratio with significance determined by Student's t‐test. *P < 0.05 (n = 3 biological replicates). (E) Decay curves of CEBPB mRNA from MDA‐MB‐231 cells with FTO knockdown (shFTO1) versus shRNA‐scrambled (scr) control. Values represent mean ± SEM of 3 biological replicates. Significance was determined by multiple Student's t‐test with Holm‐Sidak correction. (F) Immunoblot showing increased levels of C/EBPβ‐LIP upon knockdown of WTAP (shWTAP) in MDA‐MB‐231 cells versus scrambled control (scr). β‐Actin was used as loading control. Quantification of C/EBPβ‐LIP/LAP ratio with significance determined by Student's t‐test. **P < 0.01 (n = 3 biological replicates). (G) Quantification of mRNA‐m6A levels for CEBPB and HPRT (control gene not regulated by m6A) in MDA‐MB‐231 cells upon knockdown of FTO (shFTO1 or shFTO2) versus scrambled control (scr) by MeRIP‐RT‐qPCR. Bars represent mean ± SEM (n = 3 biological replicates). (H) Immunoblot showing loss of FTO expression in three independent FTO knockout clones obtained by CRISPR‐Cas9 targeting compared to parental MDA‐MB‐231 cells. β‐Actin was used as loading control.
Fig. 9
Fig. 9
FTO binds the CEBPB mRNA. (A) Immunoblot with a FLAG‐specific antibody showing immunoprecipitated 3xFLAG‐FTO and 3xFLAG control peptide after FLAG‐specific immunoprecipitation as well as in input control samples as indicated (3xFLAG control peptide is fusion to a random sequence derived from the expression vector). Immunoprecipitation of 3xFLAG‐FTO was confirmed with an FTO‐specific antibody. A β‐Actin antibody served as loading control for the input samples. The experiment was performed once (n = 1). (B) CEBPB mRNA (left) or HPRT mRNA (right, negative control) enrichment in 3xFLAG‐FTO cells and in 3xFLAG control cells presented as IP/input and normalized to empty vector control cells. Significance determined by one‐way ANOVA with Dunnett's post hoc test, ns, not significant, *P < 0.05, **P < 0.01, (n = 3 technical replicates).
Fig. 10
Fig. 10
Ectopic expression of C/EBPβ‐LIP enhances cell migration independent of FTO (n = 2 biological replicates). (A) First Transwell migration assay of MDA‐MB‐231 cells with FTO knockdown (shFTO1 or shFTO2) or scrambled control (scr) with overexpression C/EBPβ‐LIP or empty vector (EV) control, at 48 h. The graph shows quantification of migrated cells with pictures of stained cells presented on the right. Scale bar represents 500 μm. Significance determined by one‐way ANOVA with Dunnett's post hoc test, *P < 0.05, **P < 0.01 (n = 4 technical replicates). (B) Immunoblot showing overexpression of C/EBPβ‐LIP in FTO knockdown (shFTO1 or shFTO2) or scrambled‐shRNA (scr) control MDA‐MB‐231 cells. β‐Actin was used as loading control. (C) Second Transwell migration assay of MDA‐MB‐231 cells with FTO knockdown (shFTO1 or shFTO2) or scrambled control (scr) with overexpression C/EBPβ‐LIP or empty vector (EV) control, at 48 h. The graph shows quantification of migrated cells with pictures of stained cells presented on the right. Scale bar represents 500 μm. Significance determined by one‐way ANOVA with Dunnett's post hoc test, *P < 0.05, **P < 0.01 (n = 4 technical replicates). (D) Immunoblot showing overexpression of C/EBPβ‐LIP in FTO‐knockdown (shFTO1 or shFTO2) or scrambled‐shRNA (scr) control MDA‐MB‐231 cells. β‐Actin was used as loading control.

References

    1. Zhao, B. S. , Roundtree, I. A. & He, C. (2016) Post‐Transcriptional Gene Regulation by mRNA Modifications, Nature Publishing Group, 31–42. - PMC - PubMed
    1. Meyer KD & Jaffrey SR (2014) The dynamic epitranscriptome: N6‐methyladenosine and gene expression control. Nat Rev Mol Cell Biol 15, 313–326. - PMC - PubMed
    1. Wei CM & Moss B (1977) Nucleotide sequences at the N6‐methyladenosine sites of HeLa cell messenger ribonucleic acid. Biochemistry 16, 1672–1676. - PubMed
    1. Harper JE, Miceli SM, Roberts RJ & Manley JL (1990) Sequence specificity of the human mRNA N6‐adenosine methylase in vitro. Nucleic Acids Res 18, 5735–5741. - PMC - PubMed
    1. Liu J, Yue Y, Han D, Wang X, Fu Y, Zhang L, Jia G, Yu M, Lu Z, Deng X et al. (2014) A METTL3‐METTL14 complex mediates mammalian nuclear RNA N6‐adenosine methylation. Nat Chem Biol 10, 93–95. - PMC - PubMed

MeSH terms

LinkOut - more resources