. 2025 Apr 2;33(4):1642-1658.
doi: 10.1016/j.ymthe.2025.02.035. Epub 2025 Feb 28.

CAR-mediated target recognition limits TCR-mediated target recognition of TCR- and CAR-dual-receptor-edited T cells

Affiliations

CAR-mediated target recognition limits TCR-mediated target recognition of TCR- and CAR-dual-receptor-edited T cells

Tassilo L A Wachsmann et al. Mol Ther. .

Abstract

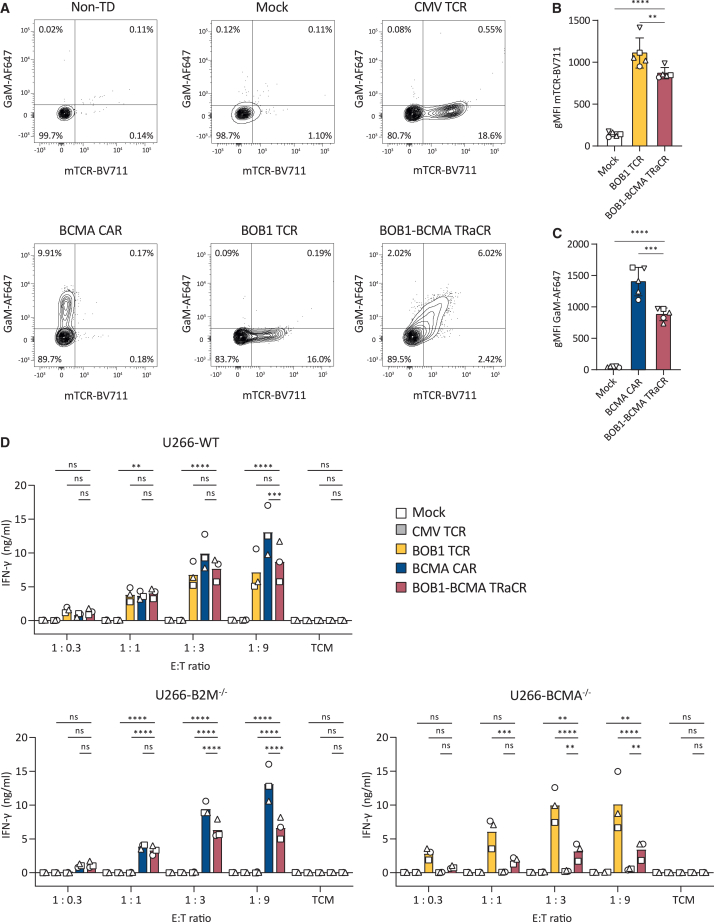
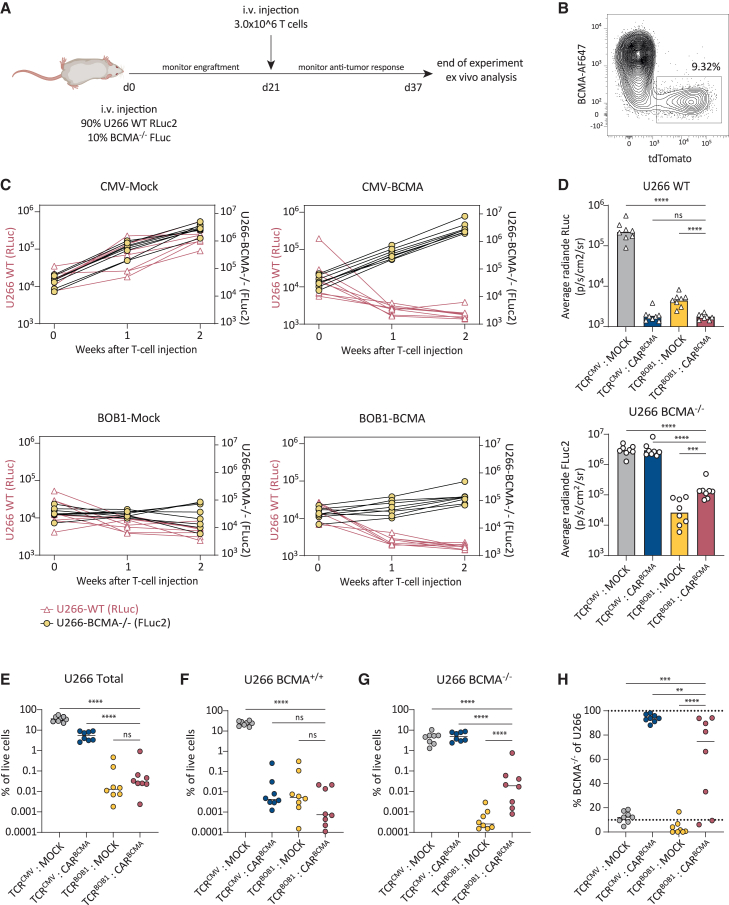
Antigen escape can compromise the efficacy of chimeric antigen receptor- (CAR-) or T cell receptor- (TCR-) engineered T cells. Targeting multiple antigens can effectively limit antigen escape, and combining CAR-with TCR-mediated targeting can significantly broaden the spectrum of targetable antigens. Here, we explored whether dual-antigen specificity can be installed on T cells using combined TCR and CAR engineering to prevent antigen escape of multiple myeloma (MM). We report the generation of CD8 T cells that were transduced to express a transgenic TCR, targeting a peptide derived from transcriptional coactivator BOB1 in the context of HLA-B∗07:02, alongside a BCMA-targeting CAR. Those T cells, called TRaCR T cells, efficiently recognized target cells that were resistant to either BOB1 TCR or BCMA CAR T cells, illustrating general dual specificity. In the presence of both antigens, however, target cell recognition was preferentially conferred via the CAR, compromising TCR-mediated target cell recognition. Importantly, this resulted in a survival advantage for tumor cells lacking expression of BCMA in an in vivo model of heterogeneous MM. In conclusion, we demonstrate general dual specificity of TRaCR T cells but advise caution when using TRaCR T cells as a strategy to target heterogeneous tumors.

Keywords: BCMA; CAR T cells; CD19; TCR engineered T cell therapy; antigen escape; cellular therapy; combination therapies; multi-antigen targeting; multiple myeloma.


Conflict of interest statement

Declaration of interests M.H.M.H. and J.H.F.F. hold patents related to the 4G11 BOB1 TCR used in this study (EP3215522). The 4G11 BOB1 TCR is licensed to Miltenyi Biotech. Miltenyi Biotech provided research funding to M.H.M.H.

Figures

None
Graphical abstract
Figure 1
Figure 1
Generation of TRaCR T cells (A) Representative FACS plots showing expression of transgenes on day 5 after retroviral transduction of primary human CD8 T cells. (B) Expression of mTCR on transduced BOB1 TCR or TRaCR T cells. n = 5 individual transductions on 4 independent donors (indicated by symbols). Repeated-measures ANOVA paired for donors with Dunnett’s multiple comparisons post hoc test. (C) Expression of CAR (goat-anti-mouse) on transduced BCMA CAR or TRaCR T cells. n = 5 individual transductions on 4 independent donors (indicated by symbols). Repeated-measures ANOVA paired for donors with Dunnett’s multiple comparisons post hoc test. (D) IFN-γ secretion of purified T cell populations after overnight coculture with indicated target cells. Data depict averaged triplicate values from IFN-γ ELISA of supernatants of three individual experiments using T cells derived from independent donors (n = 3). Repeated-measures ANOVA paired for donors with Dunnett’s multiple comparisons post hoc test comparing TRaCR T cells to other groups.
Figure 2
Figure 2
TRaCR T cells can clear an excess of tumor cells in vitro Purified T cells were incubated with U266-WT, U266-B2M−/−, or U266-BCMA−/− in E:T ratios of up to 1:9 and incubated for 6 consecutive days. (A) Quantification of viable tumor cells after 6 days of coculture in an E:T ratio of 1:9. Compiled data derived from individually generated T cell products derived from three individual donors. (B) Quantification of T cells after 6 days of culture in the absence (left) or in the presence of indicated tumor cells in an E:T ratio of 1:1. Data depict averaged duplicate values, pooled from T cell products derived from individual donors. (C) Frequency of CD62L expressing T cells after 6 days of culture in the absence of target cells. (D) Frequency of CD62L-expressing T cells after 6 days of coculture with U266-WT in indicated E:T ratios. Repeated-measures two-way ANOVA paired for donors comparing TCM to other E:T ratios. (E) Frequency of PD-1+LAG3+-expressing T cells after 6 days of culture in the absence of target cells. (F) Frequency of PD-1+LAG3+-expressing T cells after 6 days of coculture with U266-WT in indicated E:T ratios. Repeated-measures two-way ANOVA paired for donors comparing TCM to other E:T ratios. (A)–(C) and (E) Repeated-measures ANOVA paired for donors with Dunnett’s multiple comparisons post hoc test comparing TRaCR T cells to other groups.
Figure 3
Figure 3
TRaCR T cells preferentially recognize CAR-antigen-expressing target cells, impairing TCR-mediated target cell lysis (A) Preferential target recognition assay for BCMA-CAR-mediated target recognition. Indicated purified T cell products were incubated with U266-HLA−/−-BCMA+/+ in a 1:1 ratio, and U266-HLA+/+-BCMA−/− were added in the indicated relative frequencies. Survival of U266-HLA−/−-BCMA+/+ was quantified using flow cytometry after overnight coculture. Data depict frequency of surviving U266-HLA−/−-BCMA+/+ normalized to tumor cells only in technical duplicates from a representative experiment. (B) Survival of U266-HLA−/−-BCMA+/+ in the absence (left) or in the presence (right) of a 9-fold excess of U266-HLA+/+-BCMA−/−. Summary figure generated from three individually generated T cell products. Repeated-measures ANOVA paired for donors with Dunnett’s multiple comparisons post hoc test comparing TRaCR T cells to other groups. (C) Preferential target recognition assay for BOB1-TCR-mediated target recognition. Indicated purified T cell products were incubated with HLA+/+-BCMA−/− in a 1:1 ratio, and U266-HLA−/−-BCMA+/+ were added in the indicated relative frequencies. Survival of HLA+/+-BCMA−/− was quantified using flow cytometry after overnight coculture. Data depict frequency of surviving HLA+/+-BCMA−/− normalized to tumor cells only in technical duplicates from a representative experiment. (D) Survival of HLA+/+-BCMA−/− in the absence (left) or in the presence (right) of a 9-fold excess of U266-HLA−/−-BCMA+/+. Summary figure generated from three individually generated T cell products. Repeated-measures ANOVA paired for donors with Dunnett’s multiple comparisons post hoc test comparing TRaCR T cells to other groups.
Figure 4
Figure 4
Preferential target cell recognition through the CAR is not rescued by improved expression of the TCR and is extendable to other TCR-BCMA-TRaCR combinations (A) Timeline for generation of TRaCR T cells by re-stimulation and secondary transduction. (B) Representative FACS plots showing mTCR and CAR expression of TRaCR T cell products generated through re-stimulation and secondary transduction. (C) Overlay of CAR expression of TRaCR products as depicted in (A). (D) Preferential antigen recognition test assessing CAR-mediated target cell recognition of TCRBOB1:CARBCMA TRaCR T cells generated by re-stimulation as depicted in (A). Summary figure generated from three individually generated T cell products. (E) Preferential antigen recognition test assessing TCR-mediated target cell recognition of TCRBOB1:CARBCMA TRaCR T cells generated by re-stimulation as depicted in (A). Summary figure generated from five individually generated T cell products. (F) Preferential antigen recognition test assessing CAR-mediated target cell recognition of TCRNY−ESO−1:CARBCMA TRaCR T cells generated by re-stimulation as depicted in (A). Summary figure generated from three individually generated T cell products. (G) Preferential antigen recognition test assessing TCR-mediated target cell recognition of TCRNY-ESO-1:CARBCMA TRaCR T cells generated by re-stimulation as depicted in (A). Summary figure generated from five individually generated T cell products. (D–G) Repeated-measures ANOVA paired for donors with Dunnett’s multiple comparisons post hoc test comparing TCR:CARBCMA TRaCR T cells to other groups.
Figure 5
Figure 5
Preferential target cell recognition through the CAR is a function of antigen abundance (A) TCR-mediated IFN-γ secretion by TCRCMV:Mock and TCRCMV:CARBCMA T cells in response to NLV peptide pulsed on U266-HLA+/+-BCMA−/−. (B) TCR-mediated IFN-γ secretion by TCRCMV:Mock and TCRCMV:CARBCMA T cells in response to NLV peptide pulsed on U266-HLA+/+-BCMA+/+ (U266-WT). (C) Viability of NLV peptide-pulsed U266-HLA+/+-BCMA−/− after overnight coculture with TCRCMV:Mock and TCRCMV:CARBCMA T cells measured by in vitro bioluminescence. Dotted lines indicate half-maximal killing (EC50). (D) Viability of NLV peptide-pulsed U266-HLA+/+-BCMA−/− after overnight coculture with TCRCMV:Mock and TCRCMV:CARBCMA T cells measured by in vitro bioluminescence in the presence of a 9-fold excess of HLA−/−-BCMA+/+. Dotted lines indicate EC50. (A–D) Averaged technical duplicates from a representative experiment.
Figure 6
Figure 6
TRaCR T cells display higher cellular avidity toward BCMA-expressing target cells CFSE labeled T cells were incubated with PKH26 red-labeled tumor cells and allowed to conjugate at 37°C. Cell conjugation was stopped by the addition of PFA, and the percentage of T cells conjugated to tumor cells was assessed using flow cytometry (also see Figure S3). Live cells were identified based on scatterplot, and no duplicate exclusion gate was applied. (A) Representative gating to identify the percentage of T cells conjugated to tumor cells. (B) Kinetics of target cell conjugation specific for CAR-BCMA interaction. (C) Kinetics of target cell conjugation specific for TCR-HLA interaction. (D) Indicated T cell populations were incubated with a 1:1 mix of U266-HLA+/+-BCMA−/− and U266-HLA−/−-BCMA+/+ (final ratio 1 T cell:5 tumor cells). After 30 min of co-incubation, preferential target cell conjugation was assessed by flow cytometry. U266-HLA+/+-BCMA−/− and U266-HLA−/−-BCMA+/+ were discriminated based on the expression of HLA. Data depict averaged triplicate values derived from T cell products generated from four independent donors (indicated by individual symbols). Two-way ANOVA. (E) Preferential target cell conjugation of TCRCMV:CARMock or TCRCMV:Mock T cells to U266-HLA+/+-BCMA−/− and U266-HLA−/−-BCMA+/+ in the presence of different amounts of titrated CMV-TCR antigen (pp65-derived NLV peptide). Panels show technical triplicates from different T cell products generated from two independent donors.
Figure 7
Figure 7
Preferential recognition of BCMA-expressing target cells by TRaCR T cells results in survival advantage of U266-BCMA−/−in vivo (A) Schematic overview of in vivo experiment assessing preferential target recognition by TRaCR T cells. NSG mice were inoculated with a 9:1 mix of U266-WT-RLuc and U266-HLA+/+-BCMA−/−-FLuc2. After an engraftment period of 3 weeks, mice were treated with 3 × 106 purified T cell products (n = 8 mice per group). U266-WT-RLuc and U266-HLA+/+-BCMA−/−-FLuc2 were independently followed using substrate-specific bioluminescence imaging. (B) Frequency of U266-HLA+/+-BCMA−/−-FLuc2 in tumor cell mix before injection. (C) Bioluminescence of U266-WT-RLuc (left axis, black) and U266-HLA+/+-BCMA−/−-FLuc2 (right axis, blue) plotted per treatment group. (D) Comparison of bioluminescence of U266-WT-RLuc (above) and U266-HLA+/+-BCMA−/−-FLuc2 (below) between treatment groups 2 weeks after T cell treatment. (E–G) Frequency of indicated tumor cell populations in the bone marrows of sacrificed mice on day 16 after T cell treatment as measured by flow cytometry. (D–G) Ordinary one-way ANOVA with Dunnett’s multiple comparisons post hoc test on log-transformed data comparing TCRBOB1:CARBCMA TRaCR T cells to other groups. (H) Frequency of tumor cells of an BCMA−/−-tdTomato+ phenotype of all U266 cells. Dotted line indicates 10% as the reference level for pre-injection frequency. Ordinary one-way ANOVA with Dunnett’s multiple comparisons post hoc test comparing TCRBOB1:CARBCMA TRaCR T cells to other groups.

References

    1. Sterner R.C., Sterner R.M. CAR-T cell therapy: current limitations and potential strategies. Blood Cancer J. 2021;11:69. doi: 10.1038/s41408-021-00459-7. - DOI - PMC - PubMed
    1. Schuster S.J., Bishop M.R., Tam C.S., Waller E.K., Borchmann P., McGuirk J.P., Jäger U., Jaglowski S., Andreadis C., Westin J.R., et al. Tisagenlecleucel in Adult Relapsed or Refractory Diffuse Large B-Cell Lymphoma. N. Engl. J. Med. 2019;380:45–56. doi: 10.1056/NEJMoa1804980. - DOI - PubMed
    1. Neelapu S.S., Locke F.L., Bartlett N.L., Lekakis L.J., Miklos D.B., Jacobson C.A., Braunschweig I., Oluwole O.O., Siddiqi T., Lin Y., et al. Axicabtagene Ciloleucel CAR T-Cell Therapy in Refractory Large B-Cell Lymphoma. N. Engl. J. Med. 2017;377:2531–2544. doi: 10.1056/NEJMoa1707447. - DOI - PMC - PubMed
    1. Porter D.L., Hwang W.T., Frey N.V., Lacey S.F., Shaw P.A., Loren A.W., Bagg A., Marcucci K.T., Shen A., Gonzalez V., et al. Chimeric antigen receptor T cells persist and induce sustained remissions in relapsed refractory chronic lymphocytic leukemia. Sci. Transl. Med. 2015;7 doi: 10.1126/scitranslmed.aac5415. - DOI - PMC - PubMed
    1. Park J.H., Rivière I., Gonen M., Wang X., Sénéchal B., Curran K.J., Sauter C., Wang Y., Santomasso B., Mead E., et al. Long-Term Follow-up of CD19 CAR Therapy in Acute Lymphoblastic Leukemia. N. Engl. J. Med. 2018;378:449–459. doi: 10.1056/NEJMoa1709919. - DOI - PMC - PubMed

MeSH terms

Substances