. 2025 Apr 3;188(7):1858-1877.e21.
doi: 10.1016/j.cell.2025.01.043. Epub 2025 Feb 28.

Lysine vitcylation is a vitamin C-derived protein modification that enhances STAT1-mediated immune response

Affiliations

Lysine vitcylation is a vitamin C-derived protein modification that enhances STAT1-mediated immune response

Xiadi He et al. Cell. .

Abstract

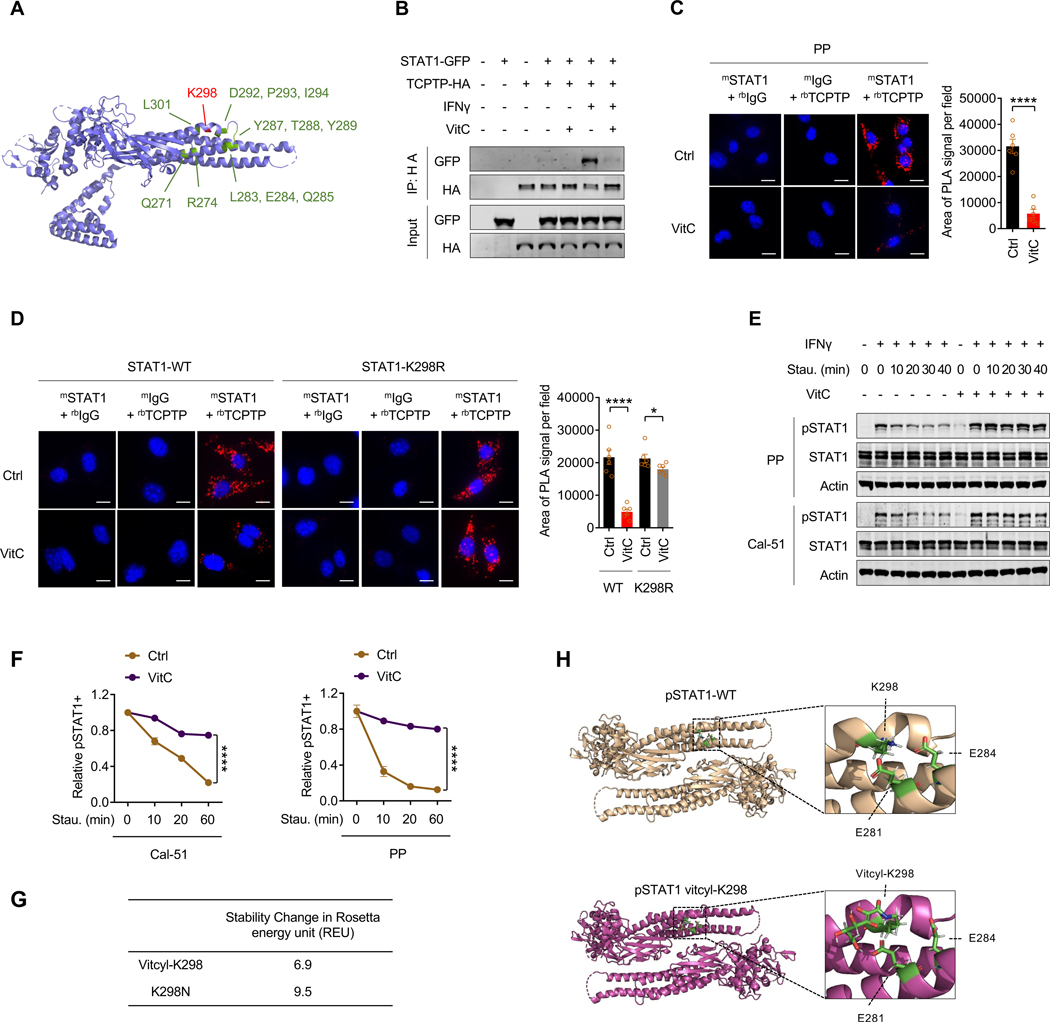
Vitamin C (vitC) is essential for health and shows promise in treating diseases like cancer, yet its mechanisms remain elusive. Here, we report that vitC directly modifies lysine residues to form "vitcyl-lysine"-a process termed vitcylation. Vitcylation occurs in a dose-, pH-, and sequence-dependent manner in both cell-free systems and living cells. Mechanistically, vitC vitcylates signal transducer and activator of transcription-1 (STAT1)- lysine-298 (K298), impairing its interaction with T cell protein-tyrosine phosphatase (TCPTP) and preventing STAT1-Y701 dephosphorylation. This leads to enhanced STAT1-mediated interferon (IFN) signaling in tumor cells, increased major histocompatibility complex (MHC)/human leukocyte antigen (HLA) class I expression, and activation of anti-tumor immunity in vitro and in vivo. The discovery of vitcylation as a distinctive post-translational modification provides significant insights into vitC's cellular function and therapeutic potential, opening avenues for understanding its biological effects and applications in disease treatment.

Keywords: STAT1; immune response; protein modification; vitamin C; vitcylation.


Conflict of interest statement

Declaration of interests Q.W. is a scientific consultant for Crimson Biopharm Inc. J.S.B. is a scientific consultant for Geode Therapeutics Inc. L.C.C. is a co-founder and scientific advisory board member of Agios Pharmaceuticals, Faeth Therapeutics, Petra Pharma Corporation, Larkspur Therapeutics, and Volastra Pharmaceuticals and a scientific advisory board member for Scorpion Therapeutics. J.J.Z. is co-founder and director of Crimson Biopharm Inc. and Geode Therapeutics Inc.

Figures

Figure 1.
Figure 1.. VitC modifies lysine residues of peptides to form vitcyl-lysine in cell-free systems
(A) Proposed mechanism of lysine vitcylation formation by ascorbate anion. The reactive lactone bond on the ascorbate anion is circled. (B) Representative results of vitC-induced vitcylation formation in vitro. Synthetic lysine-containing peptides (sequences of the peptides were listed on the left of the spectrum, ‘Ac-’ means the N terminus of the peptide is protected by an acetyl group, hereafter for MALDI-TOF/TOF MS detection unless otherwise indicated) were incubated with either a vehicle, 2 mM vitC, 2 mM 1–13C-vitC, 2 mM 2-13C-vitC or 2 mM 1,2-13C-vitC at 37°C for 3 hours. The formation of vitcylated peptides was detected by MALDI-TOF/TOF MS, with the m/z range of each spectrum displayed above the spectrum. The m/z values of unmodified peptides and modified peptides are listed. (C) MS spectrum (upper) and MS/MS spectrum (lower) of the unmodified peptide, vitcylated peptide, 1-13C-vitcylated peptide, 2-13C-vitcylated peptide, and 1,2-13C-vitcylated peptide (Ac-VSSPKVLQRL) detected by HPLC MS/MS. Lysine-containing unmodified fragments, vitcylated fragments, 1-13C-vitcylated fragments, 2-13C-vitcylated fragments, and 1,2-13C-vitcylated fragments are marked with green, red, and blue colors, respectively. The b ion refers to the N-terminal parts of the peptide, and the y ion refers to the C-terminal parts of the peptide (hereafter for HPLC-MS/MS analysis). (D) Synthetic arginine-containing peptides were incubated with either a vehicle or 2 mM vitC at 37°C for 3 hours. The formation of vitcylated peptides was detected by MALDI-TOF/TOF MS. See also Figures S1 and S2.
Figure 2.
Figure 2.. VitC induces lysine vitcylation on cellular proteins
(A) Summary of the numbers of vitcylated proteins and sites identified in Cal-51 (human) and E0771 (mouse) cells. (B) Subcellular locations of lysine vitcylated proteins identified in E0771 cells. The locations are classified into nuclear, cytosol, plasma membrane, extracellular, mitochondrial, cytosol_nuclear, and other compartments. (C) Top ten gene ontology molecular function enrichment categories for vitcylated proteins identified in E0771 cells. (D) Top ten gene ontology biological process enrichment categories for vitcylated proteins identified in E0771 cells. (E) Top ten KEGG-based enrichment categories of lysine vitcylated proteins identified in E0771 cells. (F) Extracted ion chromatograms (left) and MS/MS spectra (right) from HPLC-MS/MS analysis of vitcylated peptides (mouse SMC1A, K129) derived from E0771 (cellular peptide), its in vitro generated counterpart (synthetic peptide), and their mixture. (G) Extracted MS/MS spectra from HPLC-MS/MS analysis of 1-13C-vitcylated peptides and vitcylated peptides (mouse SMC1A, K129) derived from E0771 cells. Lysine-containing 1-13C-vitcylated fragments and vitcylated fragments are marked by red and blue colors, respectively. (H) Intracellular levels of lysine vitcylation, acetylation and methylation were measured in PP, E0771, Cal-51, and MCF7 cells cultured in medium containing a vehicle or vitC for 12 hours (2 mM vitC for PP and E0771, 0.5 mM vitC for Cal-51 and MCF7). Protein levels in each sample were normalized by coomassie staining, hereafter for global vitcylation detection. The quantifications of WB and coomassie staining were normalized to the untreated samples and are listed below, hereafter for global vitcylation detection. (I) Intracellular levels of lysine vitcylation, acetylation and methylation were measured in E0771 cells cultured in medium containing different concentrations of vitC for 12 hours. (J) Intracellular levels of lysine vitcylation, acetylation and methylation were measured in E0771 cultured in medium containing a vehicle or 2 mM vitC for 12 hours under different pH conditions. (K) Intracellular lysine vitcylation, acetylation, and methylation levels were measured in E0771 cells cultured in medium containing 2 mM vitC for the indicated times. (L) Lysine vitcylation, acetylation, and methylation levels of cytosolic and mitochondrial proteins were measured from E0771 cultured in medium with a vehicle or 2 mM vitC for 12 hours. (M) Synthetic lysine-containing peptides were incubated with 2 mM of vitC in the presence of denatured cell lysate (99°C for 5 min to denature the cell lysate) or active cell lysate at 37°C for 3 hours. The formation of vitcylated peptides was detected by MALDI-TOF/TOF MS. The relative vitcylation levels were quantified (right, n = 3). Data are represented as mean ± SEM. **p < 0.01, ***p < 0.001. See also Figure S3 and Tables S1-S4.
Figure 3.
Figure 3.. Vitcylation of STAT1 K298 regulates the phosphorylation and activation of STAT1
(A and B) Top-ranked upregulated GO terms (A) and upregulated GSEA signatures (B) in E0771 cells treated with 1 mM vitC for 2 days (n = 2). (C) Extracted ion chromatograms (left) and MS/MS spectra (right) from HPLC-MS/MS analysis of a vitcylated peptide (human STAT1, K298) derived from Cal-51 cells (cellular peptide), its in vitro generated counterpart (synthetic peptide) and their mixture. (D) Extracted MS/MS spectra from HPLC-MS/MS analysis of vitcylated peptide (upper) and 1–13C-vitcylated peptide (lower) (human STAT1, K298) derived from Cal-51 cells. Lysine-containing vitcylated fragments and 1-13C-vitcylated fragments are marked by blue and red colors, respectively. (E) STAT1 vitcylation levels were measured from STAT1-GFP expressing cells (Cal-51 and PP cells) cultured in different concentrations of vitC for 12 hours. (F) pSTAT1 flow cytometric analysis of Cal-51, E0771, and PP cells cultured in different concentrations of vitC for 2 days (2 mM vitC for E0771 and PP, 0.5 mM vitC for Cal-51, n = 3). Data are represented as mean ± SEM. ***p < 0.001, ****p < 0.0001. (G) WB analysis of pSTAT1 in PP and Cal-51 cells cultured in different concentrations of IFNγ for 15 min with or without vitC treatment for 2 days (2 mM vitC for PP, 0.5 mM vitC for Cal-51). (H) Measurement of vitcylation levels of STAT1-WT and STAT1-K298R in PP-sgSTAT1_1 cells re-expressing STAT1-WT-GFP or STAT1-K298R-GFP, after being cultured in medium containing 2 mM vitC or control medium for 12 hours. (I) Flow cytometric analysis of pSTAT1 in PP-sgSTAT1_1 cell re-expressing STAT1-WT-GFP or STAT1-K298R-GFP, cultured in varying concentrations of vitC for 2 days (n = 3). Data are represented as mean ± SEM. *p < 0.05, **p < 0.01, ***p < 0.001, ****p < 0.0001. (J) Nuclear translocation of STAT1 in PP-sgSTAT1_1 cell re-expressing STAT1-WT-GFP, STAT1-K298R-GFP or STAT1-Y701A-GFP treated with 2 mM vitC (2 days) or 100 ng/ml IFNγ (15 min) was assessed by immunofluorescence (scale bar, 30 μM). The quantifications of immunofluorescence intensity are listed below, hereafter for STAT1 nuclear translocation assay. (K) GSEA signatures of IFNγ response and IFNα response in PP-sgSTAT1_1 cell re-expressing STAT1-WT-GFP, STAT1-K298R-GFP or STAT1-Y701A-GFP treated with 2 mM vitC (2 days) or 100 ng/ml IFNγ (24 hours) (n = 2). See also Figure S4; Tables S2 and S5.
Figure 4.
Figure 4.. Vitcylation of STAT1 K298 prevents its dephosphorylation by TCPTP
(A) Ribbon representation of human STAT1. The K298 site and several gain-of-function mutation sites are marked by red and green colors, respectively. The side chain of K298 is shown. (B) HeLa cells co-expressing STAT1-GFP and TCPTP-HA were treated with vehicle or 300 μM vitC for 24 hours, followed by stimulation with 100 ng/ml IFNγ for 15 min. The interaction between STAT1 and TCPTP was assayed by co-immunoprecipitation. (C) STAT1-TCPTP PLA analysis (left) and quantification (right) of PP cells treated with a vehicle or 2 mM vitC for 2 days (scale bar, 30 μM). Data are represented as mean ± SEM. ****p < 0.0001. (D) STAT1-TCPTP PLA analysis (left) and quantification (right) of PP-sgSTAT1_1 cell re-expressing STAT1-WT-GFP and STAT1-K298R-GFP treated with vehicle or 2 mM vitC for 24 hours (scale bar, 15 μM). Data are represented as mean ± SEM. *p < 0.05, ****p < 0.0001. (E) Cells were pretreated with vehicle or vitC (0.2 mM vitC for Cal-51, 1 mM vitC for PP) for 2 days, then stimulated with 100 ng/ml IFNγ for 15 min followed by incubation with 1 μM staurosporine for the indicated times. The pSTAT1 levels were measured by WB immediately. (F) Cells were pretreated with vehicle or vitC (0.2 mM vitC for Cal-51, 1 mM vitC for PP) for 2 days, then stimulated with 100 ng/ml IFNγ for 15 min followed by incubation with 1 μM staurosporine for the indicated times. The relative pSTAT1+ populations were measured by flow cytometry immediately (n = 3). Data are represented as mean ± SEM. ****p < 0.0001. (G) Stability changes in Rosetta energy unit (REU) of STAT1 caused by K298 vitcylation and K298N mutation as determined by the Rosetta atom energy function model system. (H) Structures of wild-type and K298 vitcylated pSTAT1 in the antiparallel dimer conformation from the last snapshot of MD simulation. Vitcyl-K298 loses the salt bridges of K298/E281 and K298/E284 in STAT1. See also Figure S5.
Figure 5.
Figure 5.. Vitcylation of STAT1 K298 enhances the expression of MHC/HLA class I and promotes immunogenicity in tumor cells
(A) Quantitative PCR analysis of antigen processing and presentation gene expression in PP cells (n = 3) treated with either vehicle or 2 mM vitC for 2 days. Data are represented as mean ± SEM. ****p < 0.0001. (B) Representative flow cytometry plots (left) and quantifications (right) of MHC-I expression on PP cells cultured in varying concentrations of vitC for 2 days (n=3). Data are represented as mean ± SEM. ****p < 0.0001. (C) Flow cytometric analysis of MHC-I expression on PP cells cultured in varying concentrations of IFNγ (100 ng/ml, 24 hours) with or without 2 mM vitC for 2 days (n = 3). Data are represented as mean ± SEM. *p < 0.05, ***p < 0.001, ****p < 0.0001. (D) Flow cytometric analysis of MHC-I expression on PP cells cultured in different pH mediums with or without 2 mM vitC for 2 days (n = 3). Data are represented as mean ± SEM. *p < 0.05, ****p < 0.0001. (E) Flow cytometric analysis of MHC-I expression on PP-sgSTAT1_1 cell overexpressing with STAT1-WT-GFP (2 single clones) or STAT1-K298R-GFP (2 single clones) cultured in varying concentrations of vitC for 2 days (n = 3). Data are represented as mean ± SEM. **p < 0.01, ***p < 0.001, ****p < 0.0001. (F) Workflow for co-culturing of vitC-treated PP cells with bone marrow-derived DCs. (G) Flow cytometry analysis of DCs co-cultured with vitC-pretreated PP cells. DCs (CD45+ CD11c+) were plotted, and quantifications of MHC II+, CD86+ and CD80+ were used to identify DC activity (n = 3). Data are represented as mean ± SEM. **p < 0.01, ***p < 0.001. (H) Flow cytometric analysis of H-2Kb and pSTAT1 expression on B16-OVA cells treated with varying doses of vitC for 3 days (n = 3). Data are represented as mean ± SEM. *p < 0.05, **p < 0.01. (I) Workflow for co-culturing of vitC-treated B16-OVA or EL4-OVA cells with OT-I mice spleen-derived CD8+ T cells. (J) Flow cytometric analysis of OT-I CD8+ T cells co-cultured with B16-OVA cells pretreated with 2 mM vitC. T cells (CD45+ CD3+ CD8+) proliferation and activity were quantified as CFSE and IFNγ+, TNFα+ cells, respectively (n = 3). Data are represented as mean ± SEM. *p < 0.05, ***p < 0.001, ****p < 0.0001. (K) Flow cytometric analysis of pSTAT1 in B16-OVA-sgSTAT1 cells re-expressing STAT1-WT-GFP or STAT1-K298R-GFP treated with vitC for 3 days (n = 3). Data are represented as mean ± SEM. *p < 0.05. (L) Flow cytometric analysis of MHC-I expression on B16-OVA-sgSTAT1 cells re-expressing STAT1-WT-GFP or STAT1-K298R-GFP treated with vitC for 3 days (n = 3). Data are represented as mean ± SEM. ***p < 0.001, ****p < 0.0001. (M) Flow cytometric analysis of H-2Kb binding SIINFEKL peptide on B16-OVA-sgSTAT1 cells re-expressing STAT1-WT-GFP or STAT1-K298R-GFP treated with vitC for 3 days (n = 3). Data are represented as mean ± SEM. ****p < 0.0001. (N) Flow cytometric analysis of OT-I CD8+ T cells co-cultured with B16-OVA-sgSTAT1 cells re-expressing STAT1-WT-GFP or STAT1-K298R-GFP pretreated with 2 mM vitC. T cells (CD45+ CD3+ CD8+) activity were quantified (n = 3). Data are represented as mean ± SEM. ****p < 0.0001. See also Figure S6.
Figure 6.
Figure 6.. VitC induces vitcylation in tumor cells in vivo with increased STAT1-mediated immune responses
(A) Workflow for monitoring tumor growth, as well as analyzing vitcylation levels and immune cell infiltration in tumors in vivo. Tumor cells were injected into the mammary fat pads of syngeneic female mice. Tumor-bearing mice were administered vitC (i.p. 4 g/kg/day) when tumor volume reached approximately 300 mm3. Following treatment, tumor growth and survival were monitored, and tumor tissues were harvested for analysis. (B and C) Tumor growth (B) and survival (C) of E0771 allografts in C57BL/6 mice treated with vitC were analyzed (vehicle, n = 5; vitC treated, n = 5). (D and E) Tumor growth (D) and survival (E) of E0771 allografts in NSG mice treated with vitC were analyzed, and results were compared between the vehicle group and the vitC-treated group (vehicle, n = 5; vitC treated, n = 5). (F) Lysine vitcylation, acetylation, and methylation levels of tumor cells (CD45−) in E0771 tumors were measured by WB (n = 4 for each group). Protein levels were normalized by Coomassie staining. (G and H) Flow cytometry analysis of pSTAT1 (G) and MHC-I expression (H) on E0771 tumor cells (CD45) from vehicle- or vitC-treated mice (vehicle, n = 10; vitC treated, n = 10). Data are represented as mean ± SEM. **p < 0.01, ****p < 0.0001. (I) Top-ranked upregulated GSEA signatures in the tumor tissue of vitC-treated E0771 tumor-bearing mice at 7 days (n = 2). (J) STAT1-TCPTP PLA analysis (left) and quantification (right) were performed on formalin-fixed paraffin-embedding (FFPE) preparations of E0771 tumor tissues (scale bar, 20 μM). (K) Gene signatures associated with immune cells (CD45+) in E0771 tumors that were enriched following vitC treatment were analyzed by NanoString. (L) Flow cytometry analysis of the pSTAT1 level, MHC II and CD86 expression in DCs in E0771 tumor tissue from vehicle- or vitC-treated mice (vehicle, n = 9; vitC treated, n = 9). Data are represented as mean ± SEM. *p < 0.05, **p < 0.01. (M and N) Flow cytometry analysis of pSTAT1 level, TNFα and IFNγ expression in CD4+ T cells (M) and CD8+ T cells (N) in E0771 tumor tissue from vehicle- or vitC-treated mice (vehicle, n = 9; vitC treated, n = 9). Data are represented as mean ± SEM. ***p < 0.001, ****p < 0.0001. (O) VitC concentrations were analyzed in the plasma, tumor tissue, and spleen of vehicle- or vitC-treated E0771 tumor-bearing C57BL/6 mice (vehicle, n = 3; vitC treated, n = 3). Data are represented as mean ± SEM. *p<0.05, ****p<0.0001. See also Figure S7 and Table S6.
Figure 7.
Figure 7.. VitC modulates the immune milieu via STAT1 vitcylation (A and B) Flow cytometry analysis of pSTAT1
(A) and MHC-I expression (B) on the xenografts of PP-sgSTAT1_1 tumor cells re-expressing STAT1-WT-GFP, STAT1-K298R-GFP, or STAT1-Y701A-GFP treated with vehicle or vitC (vehicle, n = 9; vitC treated, n = 9). Data are represented as mean ± SEM. ****p < 0.0001. (C) Flow cytometry analysis of pSTAT1 level, TNFα and IFNγ expression in CD8+ T cells on the xenografts of PP-sgSTAT1_1 tumor cells re-expressing STAT1-WT-GFP, STAT1-K298R-GFP or STAT1-Y701A-GFP treated with vehicle or vitC (vehicle, n = 9; vitC treated, n = 9). Data are represented as mean ± SEM. **p < 0.01, ****p < 0.0001. (D) Workflow for analyzing tumor growth, pSTAT1, OVA peptide presentation, and immune cell infiltration in the xenografts of B16-OVA, B16-OVA (TET2-KO), and B16-OVA (HIF1α-KO) tumor cells treated with vehicle or vitC in vivo. (E and F) Tumor growth (E) and survival (F) of the xenografts of B16-OVA, B16-OVA (TET2-KO), and B16-OVA (HIF1α-KO) tumor cells treated with vehicle or vitC (vehicle, n = 5; vitC treated, n = 5). (G) Tumor growth of the xenografts of B16-OVA (STAT1-WT) and B16-OVA (STAT1-K298R) tumor cells treated with vehicle or vitC (vehicle, n = 5; vitC treated, n = 5). Data are represented as mean ± SEM. *p < 0.05. (H) Survival of the xenografts of B16-OVA (STAT1-WT) and B16-OVA (STAT1-K298R) tumor cells treated with vehicle or vitC (vehicle, n = 5; vitC treated, n = 5). Data are represented as mean ± SEM. *p < 0.05. (I and J) Flow cytometry analysis of pSTAT1 (I) and OVA peptide presentation (J) on the xenografts of B16-OVA (STAT1-WT) and B16-OVA (STAT1-K298R) tumor cells treated with vehicle or vitC (vehicle, n = 6; vitC treated, n = 6). Data are represented as mean ± SEM. ****p < 0.0001. (K) Flow cytometry analysis of TNFα and IFNγ expression in OT1 CD8+ T cells on the xenografts of B16-OVA-sgSTAT1 tumor cells re-expressing STAT1-WT-GFP or STAT1-K298R-GFP treated with vehicle or vitC (vehicle, n = 6; vitC treated, n = 6). Data are represented as mean ± SEM. **p < 0.01. (L) Tumor growth of E0771 allografts in C57BL/6 mice treated with vitC as a single agent or in combination with anti-PD1 antibody (n = 4). Data are represented as mean ± SEM. *p < 0.05, **p < 0.01. See also Figure S7.

Update of

References

    1. Nishikimi M, and Yagi K (1991). Molecular basis for the deficiency in humans of gulonolactone oxidase, a key enzyme for ascorbic acid biosynthesis. Am J Clin Nutr 54, 1203S–1208S. 10.1093/ajcn/54.6.1203s. - DOI - PubMed
    1. Meisel K, Daggubati S, and Josephson SA (2015). Scurvy in the 21st century?: Vitamin C deficiency presenting to the neurologist. Neurol Clin Pract 5, 491–493. 10.1212/CPJ.0000000000000158. - DOI - PMC - PubMed
    1. Ngo B, Van Riper JM, Cantley LC, and Yun J (2019). Targeting cancer vulnerabilities with high-dose vitamin C. Nat Rev Cancer 19, 271–282. 10.1038/s41568-019-0135-7. - DOI - PMC - PubMed
    1. Chen Q, Espey MG, Krishna MC, Mitchell JB, Corpe CP, Buettner GR, Shacter E, and Levine M (2005). Pharmacologic ascorbic acid concentrations selectively kill cancer cells: action as a pro-drug to deliver hydrogen peroxide to tissues. Proc Natl Acad Sci U S A 102, 13604–13609. 10.1073/pnas.0506390102. - DOI - PMC - PubMed
    1. Chen Q, Espey MG, Sun AY, Lee JH, Krishna MC, Shacter E, Choyke PL, Pooput C, Kirk KL, Buettner GR, and Levine M (2007). Ascorbate in pharmacologic concentrations selectively generates ascorbate radical and hydrogen peroxide in extracellular fluid in vivo. Proc Natl Acad Sci U S A 104, 8749–8754. 10.1073/pnas.0702854104. - DOI - PMC - PubMed

LinkOut - more resources