. 2025 Mar 18;6(3):101986.
doi: 10.1016/j.xcrm.2025.101986. Epub 2025 Feb 28.

Outer radial glia promotes white matter regeneration after neonatal brain injury

Affiliations

Outer radial glia promotes white matter regeneration after neonatal brain injury

Hideo Jinnou et al. Cell Rep Med. .

Abstract

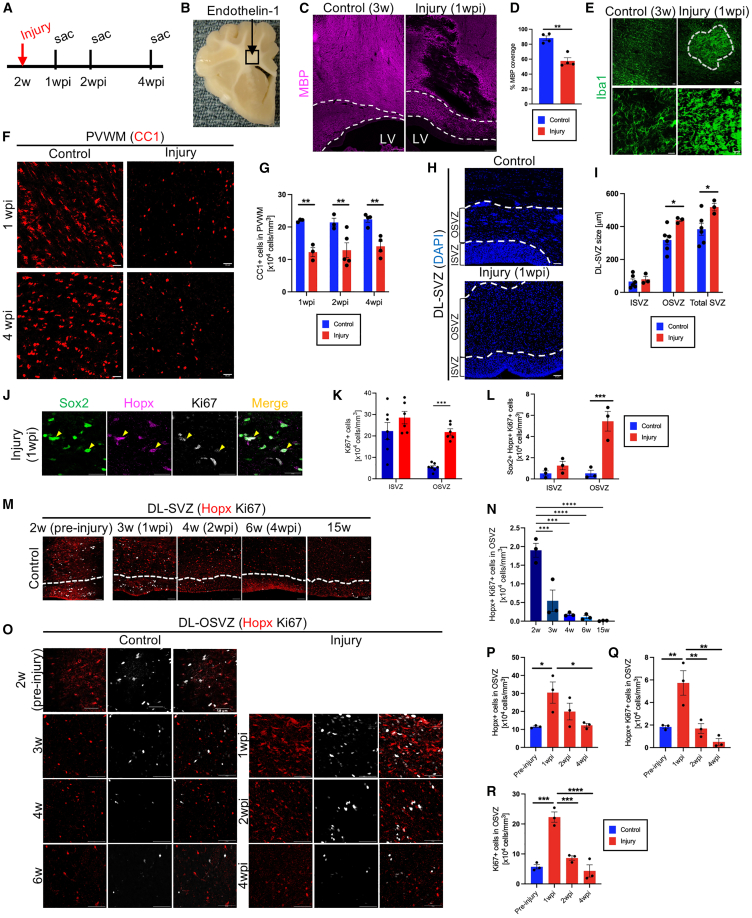
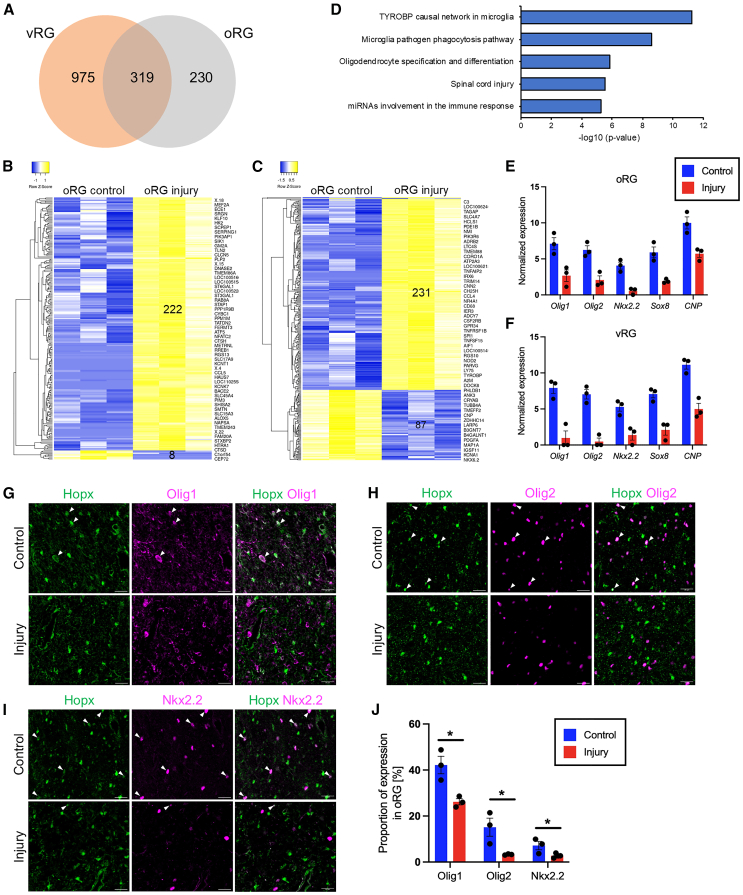
The developing gyrencephalic brain contains a large population of neural stem cells in the ventricular zone and outer subventricular zone (OSVZ), the latter populated by outer radial glia (oRG). The role of oRG during postnatal development is not well understood. We show that oRG cells increase proliferative capacity and contribute to oligodendrocyte precursor cell (OPC) production following brain injury in human infants and neonatal piglets, whose brains resemble the human brain in structure and development. RNA sequencing revealed oRG-specific transcriptional responses to injury in piglets and showed that the activating transcription factor 5 (ATF5) pathway positively regulates oRG proliferation. Intranasal activation of ATF5 using salubrinal enhanced OSVZ-derived oligodendrogenesis in the injured periventricular white matter and improved functional recovery. These results reveal a key role for postnatal oRG in brain injury recovery and identify ATF5 as a potential therapeutic target for treating white matter injury in infants.

Keywords: ATF5; MCL1; diffusion tensor imaging; gait behavior; neural stem cells; oligodendrocyte precursor cells; outer radial glia; outer subventricular zone; piglet brain; white matter regeneration.


Conflict of interest statement

Declaration of interests The authors declare no competing interests.

Figures

None
Graphical abstract
Figure 1
Figure 1
OSVZ enhances oRG proliferation and OPC production after ischemic brain injury in the human infant (A) Illustration of the SVZ regions in the human brain. (B) Coronal section of the L-SVZ of human infants and adults in control or ischemic injury groups, stained for vimentin (green) and DAPI (blue). Dashed lines indicate the border of the SVZ. (C) Thickness of the L-SVZ (top) and DL-SVZ (bottom) (infant control n = 6, infant injury n = 4, adult control and injury n = 5, biological replicates). (D) Coronal section of the DL-SVZ of human infants in control or ischemic injury groups, stained for Ki67 (white), vimentin (green), and DAPI (blue). Dashed lines indicate the border between the ISVZ and OSVZ. (E) Density of Ki67+ cells in the DL-SVZ of human infants (control n = 5, injury n = 4, biological replicates). (F) The number of Ki67+ cells in the ISVZ (left) and OSVZ (right) (control n = 5, injury n = 4, biological replicates). (G) Coronal section of the DL-OSVZ of human infants in control or ischemic injury groups. Arrowheads indicate the presence of mRNA puncta of Hopx (top) and Hopx with Mki67 (bottom). (H and I) The percentage of cells that contain Hopx (H) or Hopx+Mki67+ (I) mRNA puncta in the DL-SVZ (control n = 5, injury n = 3, biological replicates). (J) Coronal section of the DL-SVZ (top) and PVWM (bottom) of human infants in control or ischemic injury groups, stained for Olig2 (green) and Mash1 (magenta). Dashed lines indicate the borders between the lateral ventricle and SVZ and between the ISVZ and OSVZ. Arrowheads indicate colocalization of Olig2 and Mash1. (K) Density of Olig2+Mash1+ cells in the DL-SVZ (top) and PVWM (bottom) of human infants (control n = 6, injury n = 4, biological replicates). (L) The number of Olig2+Mash+ OPCs in the ISVZ (left) and OSVZ (right) (control n = 6, injury n = 4, biological replicates). Data are represented as mean ± SEM. Statistical analyses: (C) one-way ANOVA with Tukey’s multiple comparisons test; (E, H and I, K) unpaired t test; (F, L) two-way ANOVA with Sidak’s multiple comparisons test. ∗p < 0.05, ∗∗p < 0.01, ∗∗∗p < 0.001, ∗∗∗∗p < 0.0001. Scale bar: (B) 50 μm, (D) 20 μm, (G) 20 μm, and (J) 20 μm. See also Figure S1 and Table S1.
Figure 2
Figure 2
oRGs increase their proliferative capacity after ischemic brain injury in piglets (A) Experimental scheme. (B) Photographic image of the coronal plane of piglet brain tissue including anterior SVZ at 2 weeks of age. Arrow indicates the injection site of endothelin-1. (C) Coronal section of piglet brains at 1 wpi, stained for MBP (magenta). Dashed lines indicate the borders between the ISVZ and OSVZ and between the OSVZ and PVWM. These are composite images of six separate fields (three vertical and two horizontal tiles). (D) Percent MBP coverage (n = 4, biological replicates). (E) Coronal section of piglet PVWM at 1 wpi, stained for Iba1 (green) at low magnification (top) and high magnification (bottom). (F) Coronal section of piglet PVWM in control or injury groups at 1 (top) and 4 wpi (bottom), stained for CC1 (red). (G) Density of CC1+ cells in piglet PVWM (1 wpi: n = 3, 2 wpi: control n = 3, injury n = 5, 4 wpi: n = 4, biological replicates). (H) Coronal section of piglet DL-SVZ in control or injury (1 wpi) groups, stained for DAPI (blue). Dashed lines indicate the borders between the ISVZ and OSVZ and between the OSVZ and PVWM. (I) Thickness of the DL-SVZ of piglets (control n = 6, injury n = 3, biological replicates). (J) Sox2+Hopx+Ki67+ cells in the OSVZ of piglets. (K and L) Density of Ki67+ cells (control n = 7, injury n = 6, biological replicates) and (L) Sox2+Hopx+Ki67+ cells (n = 3, biological replicates). (M) Coronal section of the DL-SVZ of piglets in controls stained for Hopx (red) and Ki67 (white). Dashed lines indicate the border between the ISVZ and OSVZ. (N) Hopx+Ki67+ density in control OSVZ (n = 3, biological replicates). (O) Coronal section of piglet DL-OSVZ in control or injury groups, stained for Hopx (red) and Ki67 (white). (P–R) Density of Hopx+ (P), Hopx+Ki67+ (Q), and Ki67+ (R) cells in piglet OSVZ (n = 3, biological replicates). Data are represented as mean ± SEM. Statistical analyses: (D, I) unpaired t test; (G, K, L) two-way ANOVA with Sidak’s multiple comparisons test; (N, P–R) one-way ANOVA with Tukey’s multiple comparisons test. ∗p < 0.05, ∗∗p < 0.01, ∗∗∗p < 0.001, ∗∗∗∗p < 0.0001. Scale bar: (C) 200 μm, (E) 50 μm (top) and 20 μm (bottom), (F) 50 μm, (H) 50 μm, (J) 20 μm, (M) 50 μm, and (O) 50 μm. See also Figure S2.
Figure 3
Figure 3
Brain injury enhances the production of OSVZ OPCs, which migrate to the PVWM lesion to generate mature oligodendrocytes (A) Coronal section of the DL-SVZ (top) and PVWM (bottom) of piglets in control or injury groups, stained for PDGFRα (red) and Olig2 (white). (B and C) Density of PDGFRα+Olig2+ cells in piglet DL-SVZ (B) and PVWM (C) (n = 3–4, biological replicates). (D) Experimental scheme. (E) Coronal section of piglet PVWM at 2 wpi, stained for GFP (green) and DAPI (blue). (F) Representative image of GFP+ (green) OSVZ-derived PDGFRα+ (red) OPCs at 2 wpi within PVWM, stained for DAPI (blue). (G) Representative image of GFP+ (green) OSVZ-derived CC1+ (red) oligodendrocytes within PVWM, stained for DAPI (blue). (H) Proportions of Olig2+ or Hopx+ cells in OSVZ Ki67+ cells (n = 3, biological replicates). Data are represented as mean ± SEM. Statistical analyses: (B, C) one-way ANOVA with Tukey’s multiple comparisons test; (H) unpaired t test. ∗p < 0.05, ∗∗p < 0.01, ∗∗∗p < 0.001, ∗∗∗∗p < 0.0001. Scale bar: (A) 50 μm, (E) 50 μm, (F) 50 μm, and (G) 50 μm. See also Figure S3.
Figure 4
Figure 4
Neonatal ischemic injury downregulates pro-oligodendrocyte transcription factors in both oRG and vRG cells (A) Venn diagram displaying the number of shared and distinct DEGs identified from oRG and vRG RNA-seq datasets. (B) Heatmap of the 230 DEGs specific to the oRG dataset. (C) Heatmap of the 318 DEGs shared by oRG and vRG RNA-seq datasets. (D) Predicted pathways from Enrichr analysis of DEGs shared by oRG and vRG (determined by directional Z scores) in injury compared to control. (E and F) Normalized expression of oligodendrocyte specification genes that were altered by brain injury in oRG (E) and vRG (F). (G–I) Coronal section of piglet OSVZ in control or injury (1 wpi), stained for Hopx (green) with Olig1 (G), Olig2 (H), or Nkx2.2 (I) (magenta). Arrowheads indicate the presence of Olig1, Olig2, or Nkx2.2 expression in oRG. (J) The percentage of Hopx+ oRG expressing Olig1, Olig2, or Nkx2.2 in piglet OSVZ (n = 3–4, biological replicates). Data are represented as mean ± SEM. Statistical analysis: (J) unpaired t test. ∗p < 0.05. Scale bar: (G–I) 20 μm. See also Figure S4.
Figure 5
Figure 5
ATF5 pathway genes are specifically upregulated in oRG cells after brain injury (A) Predicted pathways from Enrichr analysis of DEGs specific to oRG (determined by directional Z scores) in injury compared to control. (B and C) Normalized expressions of apoptosis modulation genes that were altered by brain injury in oRG (B) and vRG (C). (D) Coronal section of piglet OSVZ in control or injury (1 wpi) groups. Arrowheads indicate the presence of Atf5, Bag3, or Mcl1 mRNA puncta within the Hopx+ oRG cells. (E) The percentage of Hopx+ oRGs that contain Atf5, Bcl2a1, Bag3, or Mcl1 mRNA puncta in piglet OSVZ (n = 3, biological replicates). (F and G) RNAscope labeling of coronal sections of human infant DL-OSVZ in control or ischemic injury groups, with the presence of mRNA puncta of Atf5 (F, red) and Mcl1 (G, red) with Hopx (green). (H and I) The density of cells that contain Atf5+Hopx+ (H) or Mcl1+Hopx+ (I) mRNA puncta in the DL-OSVZ (n = 3–4, biological replicates). Data are represented as mean ± SEM. Statistical analyses: (E, H, and I) unpaired t test. ∗p < 0.05, ∗∗p < 0.01, ∗∗∗p < 0.001. Scale bar: (D) 20 μm, (F) 10 μm, and (G) 10 μm. See also Figure S5.
Figure 6
Figure 6
ATF5 pathway regulates oRG proliferation and apoptosis (A) Experimental scheme. (B) Coronal section of piglet OSVZ in injury (1 wpi) with PBS treatment and sorafenib treatment groups. Arrowheads indicate the presence of Atf5 or Mcl1 mRNA puncta within the Hopx+ oRG. (C and D) The percentage of Hopx+ oRGs that contain Atf5 (C) or Mcl1 (D) (n = 3, biological replicates) mRNA puncta in piglet OSVZ. Data of control and injury groups are from Figure 5E. (E) Coronal section of the DL-ISVZ and OSVZ of piglets in injury (1 wpi) with PBS treatment and sorafenib treatment groups, stained for Hopx (red) and Ki67 (white). Dashed lines indicate the border between the ISVZ and OSVZ. (F and G) Density of Hopx+ (F) or Hopx+Ki67+ (G) cells in piglet OSVZ (n = 3–4, biological replicates). Data of injury groups are from Figures 2P and 2Q. (H) Coronal section of the piglet OSVZ in control, injury, injury with PBS treatment, and injury with sorafenib treatment groups, stained for TUNEL (green), Hopx (red), and Sox2 (white). (I) The percentage of Hopx+ cells expressing TUNEL in the OSVZ (n = 3, biological replicates). Data are represented as mean ± SEM. Statistical analyses: (C, D, F, and G) unpaired t test; (I) one-way ANOVA with Tukey’s multiple comparisons test. ∗p < 0.05, ∗∗p < 0.01. Scale bar: (B) 10 μm, (E) 20 μm, and (H) 20 μm. See also Figure S5.
Figure 7
Figure 7
Intranasal ATF5 activation promotes OSVZ-derived oligodendrogenesis in the injured PVWM and improves impairment of gait behaviors (A) Experimental scheme. (B) Coronal section of the PVWM of 6-week (4 wpi) piglets in control, injury, injury with PBS treatment, or injury with salubrinal treatment groups, stained for CC1 (upper, red) or MBP (bottom, white). Images of CC1 staining in control and injury groups are from Figure 2F. (C) Density of CC1+ cells in piglet PVWM. Data of control and injury groups are from Figure 2G (n = 3–4, biological replicates). (D) Percent coverage by MBP (n = 3–5, biological replicates). (E) Representative images of GFP+ (green) OSVZ-derived CC1+ (magenta) oligodendrocytes within PVWM at 4 wpi in PBS treatment or salubrinal treatment groups. (F) Density of GFP+CC1+ cells in piglet PVWM (n = 3–4, biological replicates). (G) Representative FA maps of the superior corona radiata (SCR) region from DTI analysis using piglet brains in control (6 weeks), injury (4 wpi), and injury with salubrinal treatment (4 wpi). Color code indicates the right-left ratio of FA values. (H) Right-left ratio of FA values in the superior corona radiata of piglet brains (n = 4–7, biological replicates). (I) Overview of gait behavior tests using GaitFour system. When piglets walk on the GaitFour mat, semi-automated gait pattern analysis was conducted using the GAITFour software. (J and K) Left-right ratios of total pressure index of forelimbs (J) and hindlimbs (K) in control (6 weeks), injury (4 wpi), injury (4 wpi) with PBS or salubrinal treatment (n = 4–7, biological replicates). Data are represented as mean ± SEM. Statistical analyses: (C, D, F, J, and K) one-way ANOVA with Tukey’s multiple comparisons test; (H) unpaired t test. ∗p < 0.05, ∗∗p < 0.01, ∗∗∗p < 0.001, ∗∗∗∗p < 0.0001. Scale bar: (B) 50 μm and (E) 20 μm. See also Figures S6 and S7, Table S2, and Video S1.

References

    1. Clowry G., Molnár Z., Rakic P. Renewed focus on the developing human neocortex. J. Anat. 2010;217:276–288. doi: 10.1111/j.1469-7580.2010.01281.x. - DOI - PMC - PubMed
    1. Molnár Z., Clowry G.J., Šestan N., Alzu'bi A., Bakken T., Hevner R.F., Hüppi P.S., Kostović I., Rakic P., Anton E.S., et al. New insights into the development of the human cerebral cortex. J. Anat. 2019;235:432–451. doi: 10.1111/joa.13055. - DOI - PMC - PubMed
    1. Buyanova I.S., Arsalidou M. Cerebral White Matter Myelination and Relations to Age, Gender, and Cognition: A Selective Review. Front. Hum. Neurosci. 2021;15 doi: 10.3389/fnhum.2021.662031. - DOI - PMC - PubMed
    1. Hansen D.V., Lui J.H., Parker P.R.L., Kriegstein A.R. Neurogenic radial glia in the outer subventricular zone of human neocortex. Nature. 2010;464:554–561. doi: 10.1038/nature08845. - DOI - PubMed
    1. Huang W., Bhaduri A., Velmeshev D., Wang S., Wang L., Rottkamp C.A., Alvarez-Buylla A., Rowitch D.H., Kriegstein A.R. Origins and Proliferative States of Human Oligodendrocyte Precursor Cells. Cell. 2020;182:594–608.e11. doi: 10.1016/j.cell.2020.06.027. - DOI - PMC - PubMed

MeSH terms

LinkOut - more resources