

Regulation of cerebrovascular resistance below the lower limit of cerebral autoregulation during induced hypotension: an observational study
- PMID: 40023745
- PMCID: PMC11947574
- DOI: 10.1016/j.bja.2024.12.037
Regulation of cerebrovascular resistance below the lower limit of cerebral autoregulation during induced hypotension: an observational study
Abstract
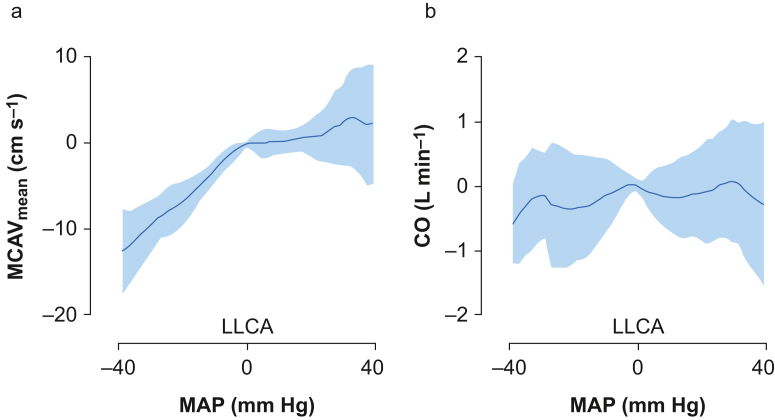
Background: To maintain adequate perfusion, cerebral blood flow (CBF) is preserved by changes in cerebrovascular resistance (CVR) inversely related to fluctuations in mean arterial blood pressure (MAP). It has been hypothesised that during progressive hypotension, a lower limit of cerebral autoregulation (LLCA) is reached beyond which cerebrovascular dilation becomes exhausted and CBF starts to decrease together with BP. We tested this hypothesis by assessing CVR above and below the LLCA.
Methods: Radial arterial pressure, thermodilution cardiac output (CO), and mean middle cerebral artery blood velocity (MCAVmean) were recorded during sustained intraoperative hypotension clinically needed for off-pump aortic root aneurysm surgery. For each participant, the individual LLCA was determined. Systemic vascular resistance (SVR) and CVR were calculated, and changes below and above the LLCA were assessed with a generalised linear effect models.
Results: For 50 participants undergoing aortic root surgery who met inclusion criteria, LLCA was located at 58 (12) mm Hg, with a corresponding MCAVmean of 32 (8) cm s-1 and CO of 5.1 (1.2) L min-1. Above the LLCA, the decline in CVR and SVR were similar, both with 19% per 10 mm Hg decrease in MAP (P<0.001). Below the LLCA, CVR declined at a lower rate (7% per 10 mm Hg), whereas the decrease in SVR was 13% per 10 mm Hg decrease in MAP (both P<0.001).
Conclusions: The continuing decline of CVR below the LLCA indicated that brain vasculature is still able to react on changing BP. This implies that LLCA should not be regarded as a fixed point but rather a transitional zone between exhausted and normally functioning autoregulation.
Keywords: arterial pressure; cerebral autoregulation; cerebrovascular resistance; induced hypotension; middle cerebral artery blood velocity; transcranial Doppler ultrasonography.
Copyright © 2025 The Author(s). Published by Elsevier Ltd.. All rights reserved.
Conflict of interest statement
Declaration of interest APJV reports having received grants and consultancy fees from Edwards Lifesciences and Philips Medical BV. DPV reports having received grants and consultancy fees from Edwards Lifesciences and Philips Medical BV. RVI reports having received grants from Edwards Lifesciences.
Figures


References
-
- Lassen N.A. Cerebral blood flow and oxygen consumption in man. Physiol Rev. 1959;39:183–238. - PubMed
-
- Drummond J.C. Blood pressure and the brain: how low can you go? Anesth Analg. 2019;128:759–771. - PubMed
-
- Kho E., Sperna Weiland N.H., Vlaar A.P.J., et al. Cerebral hemodynamics during sustained intraoperative hypotension. J Appl Physiol. 2022;132:1560–1568. - PubMed
Publication types
MeSH terms
LinkOut - more resources
Full Text Sources
Medical
Miscellaneous
