. 2025 Apr:81:103544.
doi: 10.1016/j.redox.2025.103544. Epub 2025 Feb 13.

A multi-omics approach reveals impaired lipid metabolism and oxidative stress in a zebrafish model of Alexander disease

Affiliations

A multi-omics approach reveals impaired lipid metabolism and oxidative stress in a zebrafish model of Alexander disease

Deianira Bellitto et al. Redox Biol. 2025 Apr.

Abstract

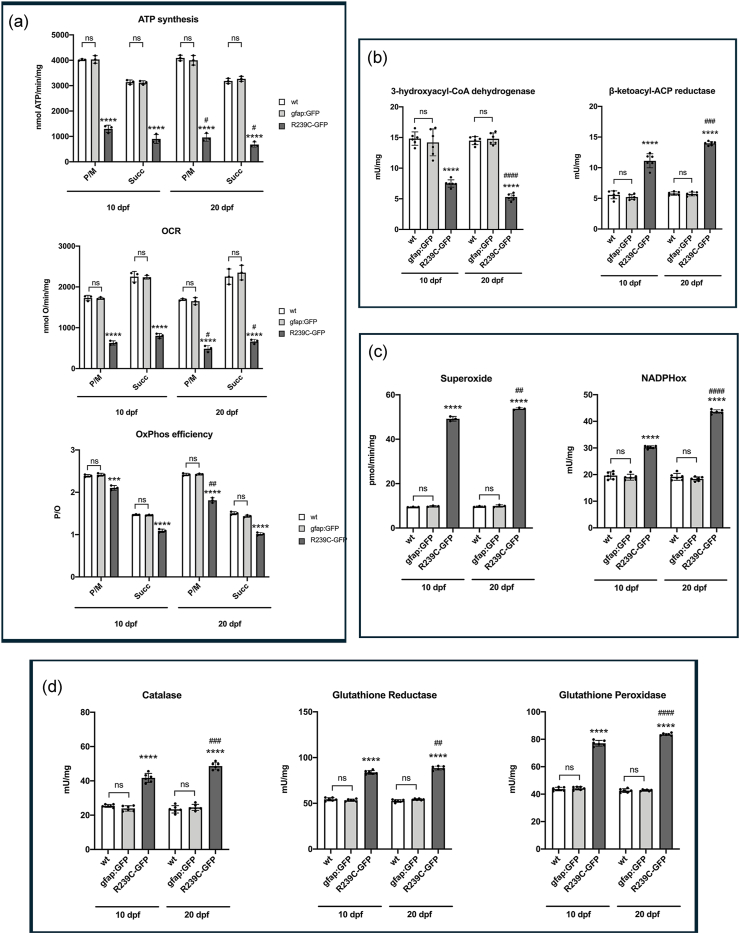
Alexander disease (AxD) is a rare leukodystrophy caused by heterozygous mutations in the GFAP gene. To date, several in vitro and in vivo models have been generated in an attempt to unravel the main mechanisms underlying this complex disease. However, none of these models is suitable for investigating the global dysregulation caused by AxD. To address this shortcoming, we have generated a stable transgenic zebrafish line (zAxD) carrying the human GFAP p.R239C mutation, which is associated with severe phenotypes of AxD type I patients. We then performed transcriptomics and proteomics analyses on the whole larvae of our zAxD model, confirming the involvement of several pathways such as the immune system response and inflammation, oxidative stress, extracellular matrix, lipoxidation and lipid metabolism, which were previously reported in more limited omic studies. Interestingly, new pathways emerged as well, including tyrosine and butanoate metabolic processes. Biochemical assays confirmed alterations in cell respiration and lipid metabolism as well as elevated oxidative stress. These findings confirm the reliability of the zAxD model to apply a whole-organism approach to investigate the molecular basis of the disease.

Keywords: Astrocytes; GFAP; Leukodystrophy; Neurodegeneration; Proteomics; Transcriptomics.


Conflict of interest statement

Declaration of competing interest None.

Figures

Image 1
Graphical abstract
Fig. 1
Fig. 1
Confocal images of Tg(gfap:GFP)mi2001 and the Tg(gfap:hGFAP(R239C)-GFP) transgenic zebrafish lines at 10 dpf. (a) Whole brain of a control Tg(gfap:GFP)mi2001 zebrafish larva at low magnification in dorsal view. (b,c) Enlargement of the telencephalic (b) and spinal cord (c) regions of the same larva showing the elongated pattern of GFP-positive cells (arrows). (d) Whole brain of a Tg(gfap:hGFAP(R239C)-GFP) zebrafish larva at low magnification in dorsal view. (e,f) Enlargement of the telencephalic (e) and spinal cord (f) regions of the same larva showing the presence of both GFP-positive aggregates (arrowheads) and the elongated pattern. In all panels, nuclei are shown in blue. The scale bar is 100 μm in panels a and d, and 10 μm in all other panels. Abbreviations: Cb, cerebellum; MO, medulla oblongata; OB, olfactory bulb; SC, spinal cord; Tel, telencephalon; TeO, tectum opticum. Plasmids used to generate transgenic lines are shown in (g).
Fig. 2
Fig. 2
Expression of GFP in the Tg(gfap:hGFAP(R239C)-GFP) transgenic zebrafish line at 24 hpf and 10 dpf. (a) Side view of a 24 hpf embryo. (b) anterior dorsal view of a 10 dpf larva, while (c) is a lateral view of the posterior part of the same larva. (ds) GFP expression in larvae of Tg(gfap:hGFAP(R239C)-GFP) (indicated as R239C-GFP) and Tg(gfap:GFP)mi2001 (indicated as gfap:GFP) at 10 days post-fertilization (dpf) was analyzed alongside comparisons to glial and neuronal markers in cryosections of the brain. (d) Immunostaining with anti-HuC/D (red) revealed labeling of ventrolateral neurons in the brain, distinct from GFP-positive cells (e). Merged imaging in (g) confirmed the absence of colocalization between anti-HuC/D and GFP signals. (h) Anti-GFAP staining (red) highlights intermediate filaments in the brain. (t) Cells labeled with anti-GFAP also exhibited GFP expression (green), as depicted in the overlay image (k), indicating co-localization of anti-GFAP and GFP signals. (lo) Immunostaining with anti-HuC/D (l, red) revealed labeling of ventrolateral neurons in the brain of gfap:GFP control line, distinct from GFP-positive cells lining the ventricle and extending processes towards the pial surface (m, green). Neither colocalization was visible in merged images (o). (p-s) Cells in the brain stained with the GFAP antibody (p) colocalized with GFP expressing cells (q,s). Labeled nuclei by Hoechst are shown in panels f, j, n, r. The scale bar is 50 μm in panels a, d-s and 100 μm in panels c, b.
Fig. 3
Fig. 3
(a) Scatterplot showing the most significant GO terms emerging from the RNA-seq in the zebrafish Tg(gfap:hGFAP(R239C)-GFP) larvae compared to Tg(gfap:GFP)mi2001 controls. Analysis was performed with Revigo, which uses multidimensional scaling (MDS) to reduce the dimensionality of a matrix of the GO terms pairwise semantic similarities. The resulting projection may be highly nonlinear. Connected similar GO terms remain close together in the plot; the semantic space units have no intrinsic meaning. Bubble color indicates the p-value for the false discovery rates; circle size indicates the frequency of the GO term in the underlying GO database, where bubbles of more general terms are larger. (b) Lipid peroxidation accumulation during animal development. The graph shows the intracellular MDA level in wild-type (wt), Tg(gfap:GFP)mi2001 (indicated as gfap:GFP), and Tg(gfap:hGFAP(R239C)-GFP) (indicated as R239C-GFP) larvae from 24 hpf to 20 dpf. Data represent 3 independent experiments (n = 3), and, for each experiment, n = 25 larvae were employed for each sample group). Statistical analysis between the three sample groups was performed with one-way ANOVA followed by Tukey's multiple comparisons test, for each time point analyzed. The difference between a time points and the previous one in the R239C-GFP sample was assessed with the t-test. Statistical significance between groups is reported as follows: ∗∗∗∗/#### < 0.0001; ∗ indicates comparisons between R239C-GFP and wt; # indicates comparisons between the animal's age and previous age in the same condition.
Fig. 4
Fig. 4
Whole-mount in situ hybridization (ISH) with miR-124 LNA (Locked Nucleic Acid) probe on 24-hpf, 72-hpf and 10 dpf. Black arrows show presence (a, b, c) or absence (d, e, f) of miR-124 expression. Scale bar is 50 μm.
Fig. 5
Fig. 5
(a) Scatterplot showing the most significant GO terms emerging from proteomic analysis at 10 dpf in the zebrafish Tg(gfap:hGFAP(R239C)-GFP) larvae compared to Tg(gfap:GFP)mi2001 controls. (b) Scatterplot showing the most significant GO terms emerging from proteomic analysis of 20-dpf Tg(gfap:hGFAP(R239C)-GFP) and Tg(gfap:GFP)mi2001 larvae. Analysis was performed with Revigo, which uses Multidimensional Scaling (MDS) to reduce the dimensionality of a matrix of the GO terms pairwise semantic similarities. The resulting projection may be highly nonlinear. Connected similar GO terms remain close together in the plot; the semantic space units have no intrinsic meaning. Bubble color indicates the p-value for the false discovery rates; circle size indicates the frequency of the GO term in the underlying GO database, where bubbles of more general terms are larger.
Fig. 6
Fig. 6
Venn diagram, obtained with PANGEA, illustrating the biological processes emerging from proteomics analysis at 10 and 20 dpf in the mutant Tg(gfap:hGFAP(R239C)-GFP) compared to the control.
Fig. 7
Fig. 7
(a) ATP synthesis, oxygen consumption rate (OCR), and the ratio between ATP synthesis and oxygen consumption (P/O) in wild-type (wt), Tg(gfap:GFP)mi2001 (indicated as gfap:GFP), and Tg(gfap:hGFAP(R239C)-GFP) (indicated as R239C-GFP) larvae at 10 and 20 dpf, induced by pyruvate plus malate (P/M) or succinate (Succ) as respiring substrates. Each panel is representative of n = 3 independent experiments and, for each experiment, n = 25 larvae were employed for each sample group. (b) 3-hydroxyacyl-CoA dehydrogenase and β-ketoacyl-ACP reductase activity in wild-type (wt), Tg(gfap:GFP)mi2001(indicated as gfap:GFP), and Tg(gfap:hGFAP(R239C)-GFP) (indicated as R239C-GFP) larvae at 10 and 20 dpf. Each panel is representative of n = 6 independent experiments and, for each experiment, n = 25 larvae were employed for each sample group. (c) Superoxide levels (n = 3 independent experiments), and NADPH oxidase activity (n = 6 independent experiments) in wild-type (wt), Tg(gfap:GFP)mi2001 (indicated as gfap:GFP), and Tg(gfap:hGFAP(R239C)-GFP) (indicated as R239C-GFP) larvae at 10 and 20 dpf. For each experiment, n = 25 larvae were employed for each sample group. (d) Catalase activity, glutathione reductase activity, and glutathione peroxidase activity in wild-type (wt), Tg(gfap:GFP)mi2001 (indicated as gfap:GFP), and Tg(gfap:hGFAP(R239C)-GFP) (indicated as R239C-GFP) larvae at 10 and 20 dpf. Panels are representative of n = 6 independent experiments, and, for each experiment, n = 25 larvae were employed for each sample group. Statistical analysis between the three sample groups was performed with one-way ANOVA followed by Tukey's multiple comparisons test, for each larvae stage. Statistical analysis on Tg(gfap:hGFAP(R239C)-GFP) between 10 or 20 dpf stages was performed by t-test. Statistical significance between groups is reported as follows: ns = not significant; ∗/# = 0,01; ∗∗/## = 0,001; ∗∗∗/### = 0,0001; ∗∗∗∗/#### <0,0001. ∗ = p value vs wt; # = p value R239C-GFP 10 dpf vs 20 dpf.

References

    1. Alexander W.S. Progressive fibrinoid degeneration of fibrillary astrocytes associated with mental retardation in a hydrocephalic infant. Brain. 1949;72(3):373–381. doi: 10.1093/brain/72.3.373. - DOI - PubMed
    1. Prust M., Wang J., Morizono H., Messing A., Brenner M., Gordon E., Hartka T., Sokohl A., Schiffmann R., Gordish-Dressman H., Albin R., Amartino H., Brockman K., Dinopoulos A., Dotti M.T., Fain D., Fernandez R., Ferreira J., Fleming J.…Vanderver A. GFAP mutations, age at onset, and clinical subtypes in Alexander disease. Neurology. 2011;77(13):1287–1294. doi: 10.1212/WNL.0b013e3182309f72. - DOI - PMC - PubMed
    1. Russo L.S., Aron A., Anderson P.J. Alexander's disease: a report and reappraisal. Neurology. 1976;26(7):607. doi: 10.1212/WNL.26.7.607. 607. - DOI - PubMed
    1. Brenner M., Johnson A.B., Boespflug-Tanguy O., Rodriguez D., Goldman J.E., Messing A. Mutations in GFAP, encoding glial fibrillary acidic protein, are associated with Alexander disease. Nat. Genet. 2001;27(1):117–120. doi: 10.1038/83679. - DOI - PubMed
    1. Messing A. Handbook of Clinical Neurology. first ed. Elsevier B.V; 2018. Alexander disease. 148. - DOI

Substances

LinkOut - more resources