. 2025 Mar 3;13(1):30.
doi: 10.1038/s41413-024-00399-5.

Enhanced SIRT3 expression restores mitochondrial quality control mechanism to reverse osteogenic impairment in type 2 diabetes mellitus

Affiliations

Enhanced SIRT3 expression restores mitochondrial quality control mechanism to reverse osteogenic impairment in type 2 diabetes mellitus

Yansi Xian et al. Bone Res. .

Abstract

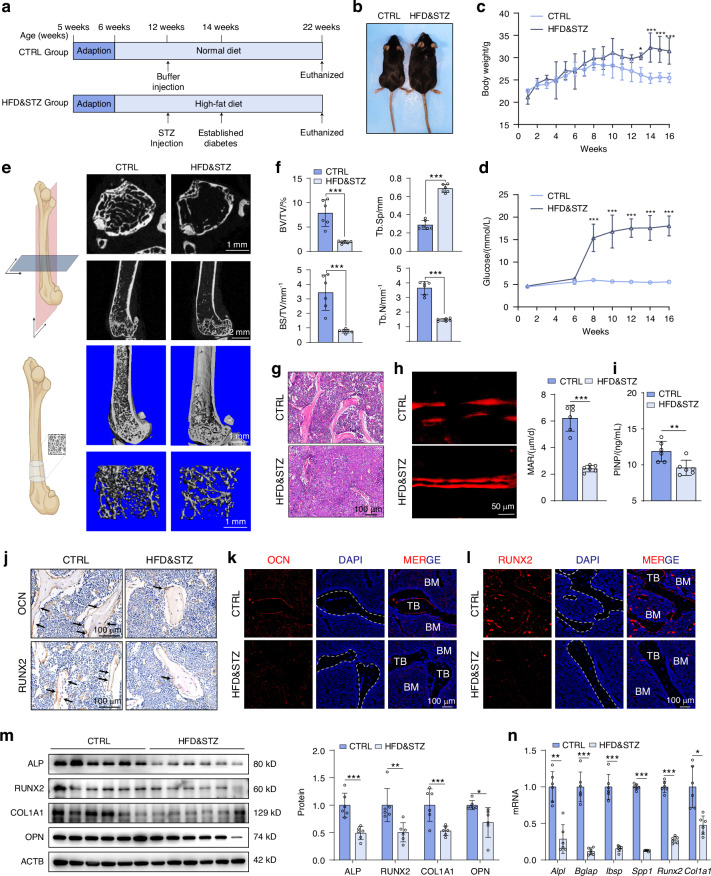
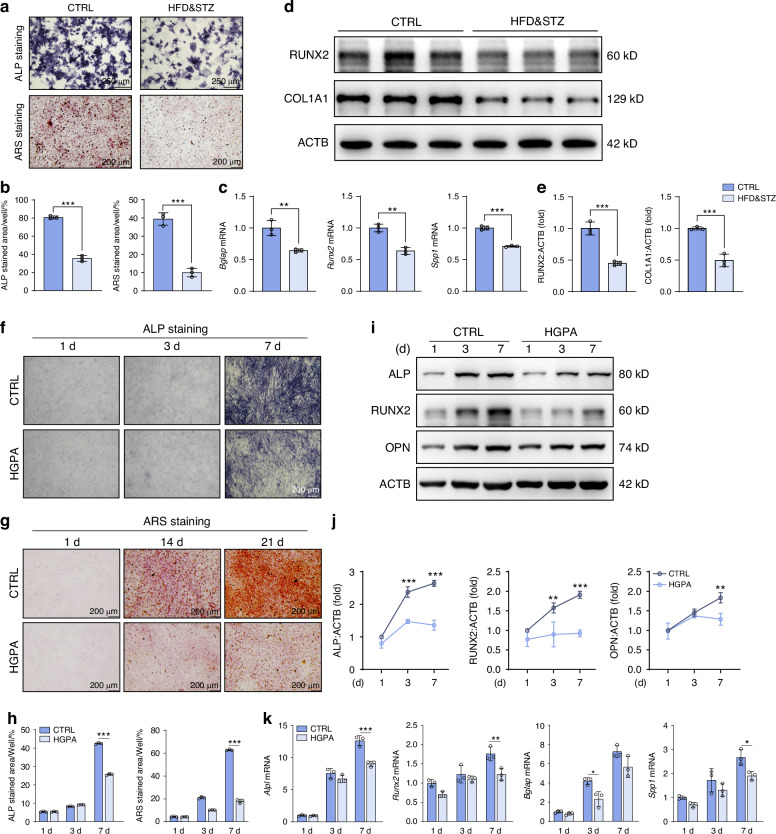
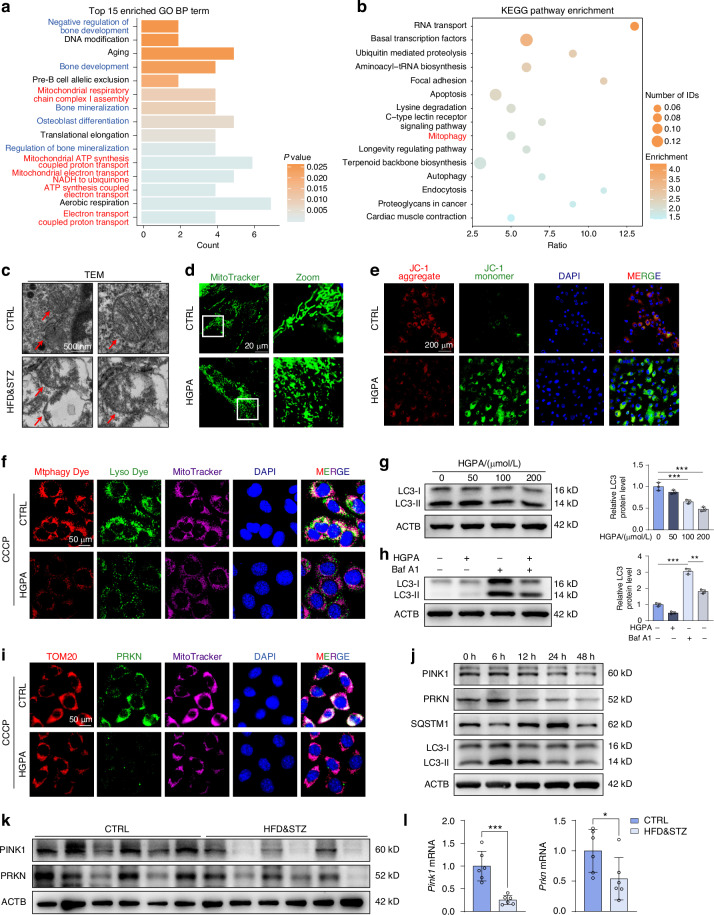
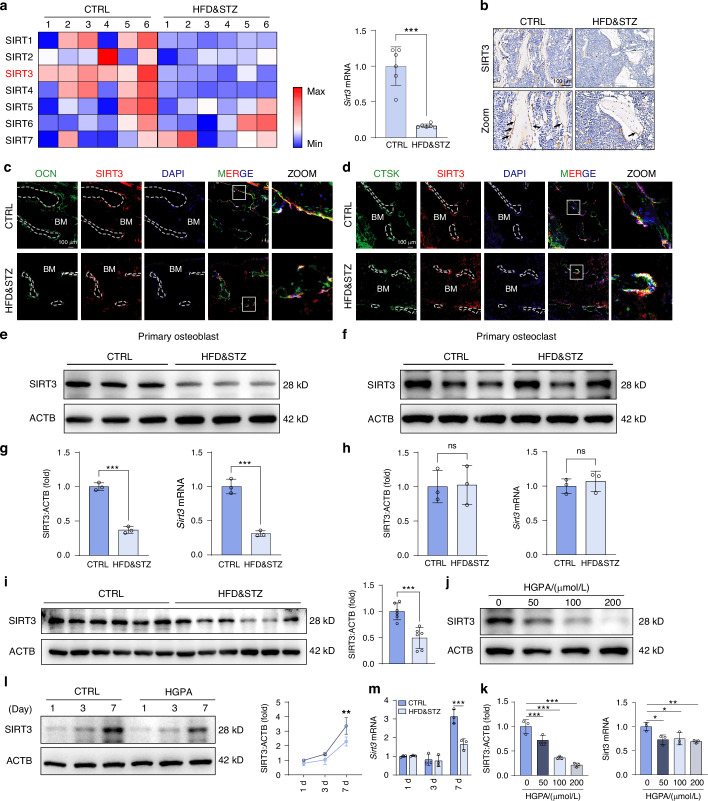
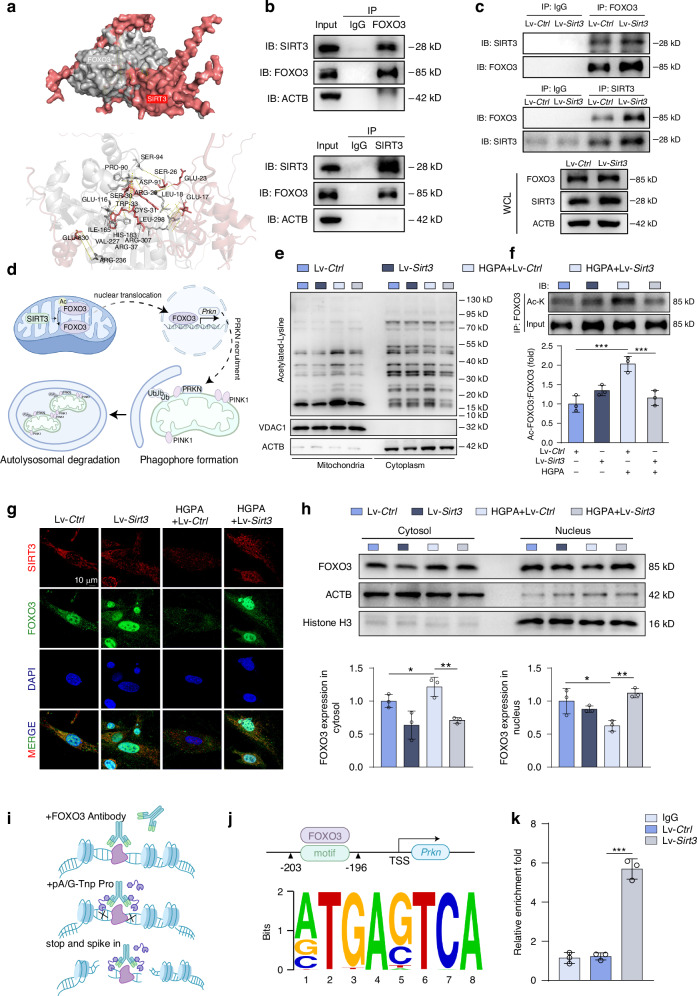
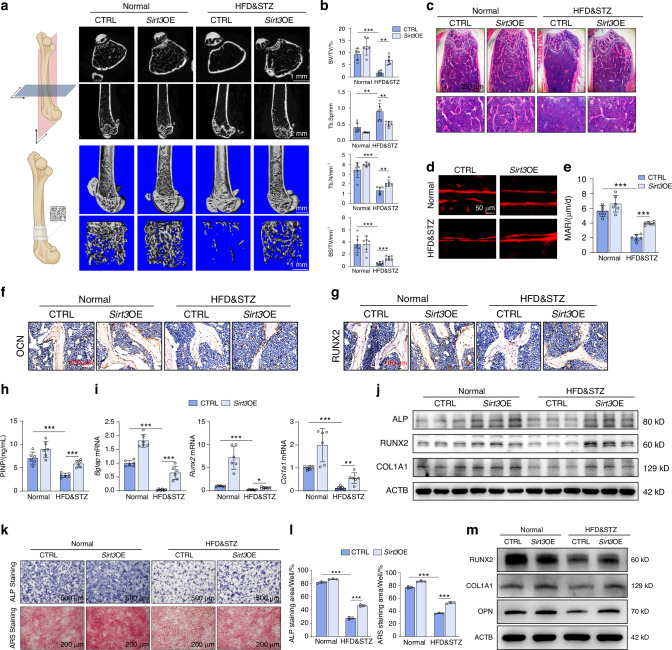
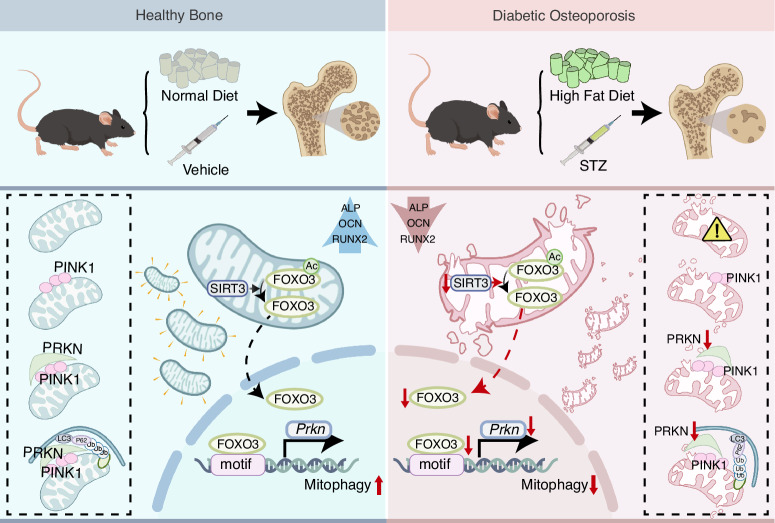
Osteoporosis represents a prevalent and debilitating comorbidity in patients diagnosed with type 2 diabetes mellitus (T2DM), which is characterized by suppressed osteoblast function and disrupted bone microarchitecture. In this study, we utilized male C57BL/6 J mice to investigate the role of SIRT3 in T2DM. Decreased SIRT3 expression and impaired mitochondrial quality control mechanism are observed in both in vitro and in vivo models of T2DM. Mechanistically, SIRT3 suppression results in hyperacetylation of FOXO3, hindering the activation of the PINK1/PRKN mediated mitophagy pathway and resulting in accumulation of dysfunctional mitochondria. Genetical overexpression or pharmacological activation of SIRT3 restores deacetylation status of FOXO3, thus facilitating mitophagy and ameliorating osteogenic impairment in T2DM. Collectively, our findings highlight the fundamental regulatory function of SIRT3 in mitochondrial quality control, crucial for maintaining bone homeostasis in T2DM. These insights not only enhance our understanding of the molecular mechanisms underlying diabetic osteoporosis but also identify SIRT3 as a promising therapeutic target for diabetic osteoporosis.


Conflict of interest statement

Competing interests: The authors declare no competing interests.

Figures

Fig. 1
Fig. 1
T2DM mice exhibit obvious bone loss with suppressed osteoblast activity. a Schematic illustration of the establishment T2DM model of male C57BL/6 J mice with HFD feeding, following 35 mg/kg STZ injection (HFD&STZ mice). b Representative images of CTRL and HFD&STZ mice. c Weekly assessment of body weight. d Biweekly measurement of fasting blood glucose. e Representative micro-CT images of femurs from CTRL and HFD&STZ mice. n = 6 per group. The illustrations for indicating the analysed region was created with Biorender.com. f Quantification of bone parameters based on micro-CT analyses, including bone volume per tissue volume (BV/TV), tracbecular spacing (Tb.Sp), bone surface per tissue volume (BS/TV) and trabecular number (Tb.N). g Representative images of H&E staining. Scale bar, 100 μm. h Representative images and quantification of xylenol orange double labeling of the femurs from CTRL and HFD&STZ mice. Scale bar, 50 μm. i Serum concentration of PINP. n = 6 per group. jl Immunohistochemical (IHC) and immunofluorescence (IF) staining for OCN and RUNX2 of bone sections. Scale bar, 100 μm. m Western blot images and quantification of osteogenesis-related markers in bone tissue of mice from CTRL and HFD&STZ group. n = 6 per group. n Quantitative PCR (qPCR) analysis of osteogenesis genes. n = 6 per group. Data presented as mean ± SD. *P < 0.05, **P < 0.01, ***P < 0.001
Fig. 2
Fig. 2
The diabetic microenvironment impairs osteoblast function in vitro. a, b Representative images and quantitative analyses of ALP (7 day) and ARS (21 day) staining of primary osteoblasts isolated from lone bones of CTRL and HFD&STZ mice in vitro. c Relative gene expression levels of Bglap, Runx2, Spp1 at day 7 since induction of primary osteoblast differentiation. d, e Western blot analysis of RUNX2 and COL1A1 in primary osteoblasts. fh Representative images and quantification of ALP and ARS staining of MC3T3-E1 cells at designated culture time points. Scale bar, 200 μm. i, j Western blot analyses of ALP, RUNX2, and OPN after cultured in osteogenic induction medium for 1-day, 3-day, and 7-day. k Relative gene expression levels of Alpl, Runx2, Bglap, and Spp1 in MC3T3-E1 cells after induction of osteoblast differentiation. Data presented as mean ± SD. *P < 0.05, **P < 0.01, ***P < 0.001
Fig. 3
Fig. 3
The diabetic microenvironment induces mitophagy impairment in osteoblasts. a, b Enrichment Analysis for differentially expressed genes between the CTRL and HFD&STZ groups using GO and KEGG databases. c Detection of osteoblast mitochondrial ultrastructure by transmission electron microscopy (TEM) in femurs from CTRL and HFD&STZ mice. d Visualization of mitochondria in MC3T3-E1 cells after HGPA treatment using Mitotracker Green dye. e Representative images of JC-1 staining in CTRL and HGPA-treated MC3T3-E1 cells. Red fluorescence represented intact mitochondria with normal membrane potential and green fluorescence represented impaired mitochondria with reduced membrane potential. Scale bar, 200 μm. f Representative images of MitoTracker-labeled mitochondria (deep red), Mtphagy-labeled mitophagy process (red), and Lyso Dye-labeled lysosomes (green), of which the co-localization indicates the occurrence of mitophagy. Scale bar, 50 μm. g, h Western blot images and quantification of LC3 in MC3T3-E1 cells treated with gradient concentrations of HGPA, with or without Baf-A1 (10 nmol/L). i Representative IF staining of TOM20 (red), PRKN (green), and MitoTracker (deep red) in MC3T3-E1 cells from CTRL and HGPA groups stimulated by CCCP for 6 h. Scale bar, 50 μm. j Western blot results of mitophagy-related proteins including PINK1, PRKN, SQSTM1, and LC3 in MC3T3-E1 cells stimulated by HGPA for various duration. k Western blot analysis of PINK1 and PRKN in bone from CTRL and HFD&STZ mice. l qPCR analysis of Pink1 and Prkn genes. n = 6 per group. Data presented as mean ± SD. *P < 0.05, **P < 0.01, ***P < 0.001
Fig. 4
Fig. 4
SIRT3 is reduced in HFD&STZ mice and HGPA-treated osteoblasts. a Heatmap demonstration of Sirtuin family (Sirt1-7) and expression of Sirt3 in bone from CTRL and HFD&STZ mice. b IHC staining of SIRT3 in bone sections. c, d IF analysis of bone sections showing co-localization of SIRT3 with osteoblast marker (OCN) or osteoclast marker (CTSK). Scale bar, 100 μm. e, f Western blot analysis of SIRT3 in primary osteoblasts and osteoclasts from CTRL and HFD&STZ mice. g, h Quantification of western blot and qPCR analysis of Sirt3 gene expression in osteoblasts and osteoclasts from CTRL and HFD&STZ mice. i Western blot analysis and quantification of SIRT3 expression in bone tissue from CTRL and HFD&STZ mice. jm Western blot analysis and quantification of SIRT3 protein in MC3T3-E1 cells cultured for different time and concentration of HGPA. Data presented as mean ± SD. *P < 0.05, **P < 0.01, ***P < 0.001
Fig. 5
Fig. 5
Activation of SIRT3 promotes mitophagy and ameliorates osteoblast dysfunction in MC3T3-E1 cells. a Relative protein and mRNA expression of SIRT3 in MC3T3-E1 cells transfected with Lv-Ctrl and Lv-Sirt3. b, c Representative images and quantification of mitochondria in Lv-Ctrl, Lv-Sirt3, HGPA+Lv-Ctrl, HGPA+Lv-Sirt3 groups. Scale bar, 20 μm. d Representative images of MitoTracker-labeled mitochondria (deep red), Mtphagy Dye-labeled mitophagy (red), and Lyso Dye-labeled lysosomes (green), of which the co-localization indicates the occurrence of mitophagy. Scale bar, 100 μm. e Representative IF staining of TOM20 (red), PRKN (green), and MitoTracker (deep red) in MC3T3-E1 cells from HGPA+Lv-Ctrl and HGPA+Lv-Sirt3 groups stimulated by CCCP for 6 h. Scale bar, 100 μm. f, g Western blot images and quantification of mitophagy-related proteins, including PINK1, PRKN, LC3, and SQSTM1 in the above groups. h qPCR analysis of Alpl, Runx2, Col1a1 and Ibsp genes in 3 independent replicative experiments. i Representative images and quantification of ALP (7 days) and ARS (21 days) staining of MC3T3-E1 cells from above four group. j, k Western blot results and quantitative analysis of RUNX2, ALP, COL1A1 in MC3T3-E1 cells. l, n Representative images and quantification of ALP staining of MC3T3-E1 cells treated with HGPA, HGPA + HKL and HGPA+mdivi-1. Scale bar, 1 000 μm. o, m Western blot analysis of RUNX2 and ALP in MC3T3-E1 cells with different intervention. Data presented as mean ± SD. *P < 0.05, **P < 0.01, ***P < 0.001
Fig. 6
Fig. 6
SIRT3 deacetylates FOXO3 to regulate Prkn gene transcription. a The molecular docking image of SIRT3 and FOXO3. b, c CoIP of SIRT3 and FOXO3 with or without SIRT3 transfection in MC3T3-E1 cells. d Schematic illustration of the mechanism that SIRT3 deacetylates FOXO3, thereby improve Prkn-mediated mitophagy. e Acetylation status of mitochondrial and cytoplasmic proteins was determined by western blot using pan-acetylated lysine antibody. Blue indicates Lv-Ctrl, dark blue indicates Lv-Sirt3, gray indicates Lv-Ctrl + HGPA and dark gray indicates Lv-Sirt3 + HGPA. The same color scheme applies to (f, h). f Western blot analysis of acetylated FOXO3 in MC3T3-E1 cells with or without SIRT3 overexpression and HGPA stimulation. g Representative IF images of FOXO3 in MC3T3-E1 cells. Scale bar, 20 μm. h Western blot analysis of nuclear-localized and cytosolic FOXO3 in MC3T3-E1 cells. i Schematic representation of CUT&Tag experiment using anti-FOXO3 antibody, followed by DNA purification and qPCR analysis with primers designed for predicted binding sites (generated by Figdraw). j The binding motif for FOXO3 included in the promoter region of the Prkn gene was predicted by JASPAR. k CUT&Tag-qPCR assay of Prkn enriched by FOXO3 antibody. Data presented as mean ± SD. *P < 0.05, **P < 0.01, ***P < 0.001
Fig. 7
Fig. 7
Sirt3-overexpression rescues HFD&STZ-induced mitophagy defects. a Schematic illustration of the establishment T2DM with injection of Adeno-associated virus (AAV) overexpressing Sirt3. b IHC staining for SIRT3 of bone sections in CTRL and Sirt3OE group from normal and HFD&STZ mice. Scale bar, 100 μm. c Representative IF images of bone sections showing co-localization of OCN (red), SIRT3 (deep red), and AAV-GFP (green). Scale bar, 100 μm. d Representative images and quantification of mitochondria stained with MitoTracker Green of primary osteoblasts from above groups. e The presentative IF images of PINK1 and PRKN with mitochondria in primary osteoblast from CTRL, Sirt3OE, HFD&STZ, and HFD&STZ+Sirt3OE mice. f The presentative IF images of PINK1 and PRKN in bone tissues. g, h Western blot images and quantification of mitophagy markers in bones from each group. Data presented as mean ± SD. *P < 0.05, **P < 0.01, ***P < 0.001
Fig. 8
Fig. 8
Overexpression of Sirt3 reverses bone loss in HFD&STZ mice. a Representative micro-CT images of femurs from different groups of mice. b Quantification of bone parameters by means of micro-CT, including BV/TV, Tb.Sp, Tb.N, and BS/TV. c Representative images of H&E staining of bone sections from different groups. d, e High magnification and quantification of xylenol orange double labeling of the femur from different group mice. Scale bar, 50 μm. f, g IHC staining against OCN and RUNX2 of bone sections. Scale bar, 100 μm. h Serum concentration of PINP. n = 6 per group. i qPCR analysis of osteogenesis genes including Bglap, Runx2, Col1a1 mRNA levels. n = 6 per group. j Western blot images and quantification including ALP, RUNX2, and COL1A1 proteins of bone tissue from different group. k, l Representative images and quantification of ALP (7 days) and ARS (21 days) staining of primary osteoblasts isolated from mice in different group. m Western blot analysis of RUNX2, COL1A1, and OPN proteins in primary osteoblasts from abovementioned groups. Data presented as mean ± SD. *P < 0.05, **P < 0.01, ***P < 0.001
Scheme 1
Scheme 1
Schematic illustration of the mechanism that SIRT3 activation effectively attenuates the impairment of osteoblast formation and bone loss in T2DM by revitalizing the PINK1/PRKN-mediated mitophagy

References

    1. Sheu, A., Greenfield, J. R., White, C. P. & Center, J. R. Assessment and treatment of osteoporosis and fractures in type 2 diabetes. Trends Endocrinol. Metab.33, 333–344 (2022). - PubMed
    1. Kindler, J. M. et al. Bone mass and density in youth with type 2 diabetes, obesity, and healthy weight. Diab. Care43, 2544–2552 (2020). - PMC - PubMed
    1. Song, F. et al. Osteoblast-intrinsic defect in glucose metabolism impairs bone formation in type II diabetic male mice. Elife12, e85714 (2023). - PMC - PubMed
    1. Yang, Y. et al. Targeting ferroptosis suppresses osteocyte glucolipotoxicity and alleviates diabetic osteoporosis. Bone Res. 10, 26 (2022). - PMC - PubMed
    1. Yang, S. et al. Empagliflozin ameliorates the impaired osteogenic differentiation ability of adipose-derived stem cells in diabetic osteoporosis by activating autophagy. Stem Cells42, 623–635 (2024). - PubMed