. 2025 Mar 1;16(1):2093.
doi: 10.1038/s41467-025-57351-2.

Chenodeoxycholic acid modulates cholestatic niche through FXR/Myc/P-selectin axis in liver endothelial cells

Affiliations

Chenodeoxycholic acid modulates cholestatic niche through FXR/Myc/P-selectin axis in liver endothelial cells

Peng Zhang et al. Nat Commun. .

Abstract

Cholestatic liver diseases are characterized by excessive bile acid accumulation in the liver. Endothelial cells (ECs) shape the local microenvironment in both normal conditions and liver injury, yet their role in cholestasis is unclear. Through a comparative analysis of single-cell RNA sequencing data from various murine models of liver injury, we identify distinctive Myc activation within ECs during obstructive cholestasis resulting from bile duct ligation (BDL). Myc overexpression in ECs significantly upregulates P-selectin, increasing neutrophil infiltration and worsening cholestatic liver injury. This process occurs through the FXR, activated by chenodeoxycholic acid (CDCA) and its conjugate TCDCA. Inhibiting P-selectin with PSI-697 reduces neutrophil recruitment and alleviates injury. Cholestatic patient liver samples also show elevated Myc and P-selectin in ECs, along with increased neutrophils. The findings identify ECs as key drivers of cholestatic liver injury through a Myc-driven program and suggest that targeting the CDCA/FXR/Myc/P-selectin axis may offer a therapeutic approach.


Conflict of interest statement

Competing interests: The authors declare no competing interests.

Figures
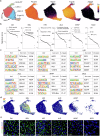
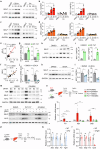
Fig. 1
Fig. 1. Single-cell atlas identifies activation of the Myc program in ECs following cholestatic liver injury.
a UMAP visualization showing liver EC subtypes. GSEA of hallmark gene sets (b), enrichment of transcription factor motifs in ECs (c), and (d) Myc gene expression in ECs from different liver injury models. e Immunofluorescence (IF) staining of CD31 (green) and Myc (red) in liver tissue samples from different liver injury models as indicated. Representative images illustrate the findings from three independent biological experiments with similar results.
Fig. 2
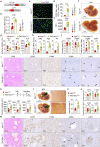
Fig. 2. Tie2-driven endothelial Myc-overexpression promotes neutrophil infiltration and exacerbates liver injury following BDL.
a Construction strategy of EC-specific Myc-overexpression mice. b qPCR analysis for Myc gene in 2-month-old mice (n = 5). c IF staining of CD31 (green) and Myc (red) in liver tissue samples from livers of (b). d quantitative analysis of Myc-positive ECs in liver tissue sections of (c) (n = 5). e Quantitative analysis of protein expression levels of Myc in ECs from MycLSL/+ and Tie2-MycLSL/+ mice by Fluorescence-Activated Cell Sorting (FACS) (n = 8). f Macroscopic view of livers from (b). g Serum enzyme levels in mice of (b) (n = 5). h qPCR analysis of indicated genes in livers from (f). Representative images (i) and quantitative analysis (j) of H&E and IHC for immune cell markers in livers from (f), with arrows indicating positive cells in respective panels (i). k Schematic diagram of BDL surgery and serum enzyme levels in BDL-treated mice (n = 5). l Macroscopic liver phenotype of mice in (k). Representative images (m) and quantitative analysis (n and o) of H&E and IHC for immune cell markers in livers from (l), with arrows indicating CD8A-positive cells and the red dotted box indicating the necrotic area (m). Data are presented as the mean ± SEM. P values are indicated as follows: * <0.05; ** <0.01; *** <0.001; **** <0.0001, ns = no significance. P values were obtained using the unpaired two-tailed Student’s t-test. Source data are provided as a Source Data file.
Fig. 3
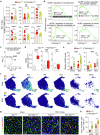
Fig. 3. Activation of endothelial Myc leads to upregulation of P-selectin.
a qPCR analysis of indicated genes in BDL livers (n = 5). b GSEA of the indicated gene sets. c DEGs in the indicated gene set. d Expression levels of indicated genes in RNA-seq data (n = 4). The box plot shows the data distribution, with the minimum (lower whisker), lower quartile (bottom of the box), median (center line within the box), upper quartile (top of the box), and maximum (upper whisker) indicated. e qPCR analysis of indicated genes in BDL livers (n = 5). f UMAP showing the expression of indicated genes. Representative IF images (g) and quantitative analysis (h) of IF for CD31+P-selectin+ ECs in sham- and BDL-treated livers (n = 6). Data are presented as the mean ± SEM. P values are indicated as follows: * <0.05; ** <0.01; * **** <0.0001, ns = no significance. P values were obtained using the unpaired two-tailed Student’s t-test. Source data are provided as a Source Data file.
Fig. 4
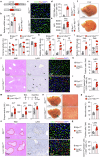
Fig. 4. Increased susceptibility to BDL-induced liver injury in Lyve1-driven Myc-overexpression mice.
a Construction strategy for EC-specific Myc-overexpression mice. b qPCR analysis of Myc gene in the livers of 2-month-old mice (n = 5). c IF staining of CD31 (green) and Myc (red) in liver tissue samples from livers of (b). (d) quantitative analysis of Myc-positive ECs in liver tissue sections of (c) (n = 5). (e) Quantitative analysis of protein expression levels of Myc in ECs from MycLSL/+ and Lyve1-MycLSL/+ mice by FACS (n = 8). f Macroscopic view of livers from (b). g Serum enzyme levels in mice of (b) (n = 5). h, i qPCR analysis of indicated genes in livers of (f) (n = 5). jl H&E, IHC staining of Ly6G, IF staining of CD31 (green) and P-selectin (red), and quantitative analysis (kl) (n = 5, 6) in liver samples from the mice in (f), with arrows indicating positive cells in respective panels (j). m Schematic diagram of BDL surgery and serum enzyme levels in BDL mice (n = 5). n Macroscopic liver phenotype of the mice in (m). o H&E, IHC staining of Ly6G, IF staining of CD31 (green) and P-selectin (red), in liver samples from mice subjected to BDL. pr Quantitative analysis of necrosis (p) (n = 5), Ly6G positive cells (q) (n = 5), and CD31+P-selectin+ cells (r) (n = 6) in liver tissue samples of (o). Data are presented as the mean ± SEM. P values are indicated as follows: * < 0.05; ** <0.01; *** <0.001; **** <0.0001, ns = no significance. P values were obtained using the unpaired two-tailed Student’s t-test. Source data are provided as a Source Data file.
Fig. 5
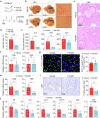
Fig. 5. P-selectin inhibition reduces neutrophil infiltration and improves liver injury in BDL-induced cholestasis.
a Inhibitor administration to BDL mice via tail vein. b Gross morphology of livers from BDL mice treated as indicated (n = 5). c H&E showing necrosis in livers from (b), with red dotted box indicating the necrotic area. (d) Quantification of necrotic areas (n = 5). e Serum enzyme levels in mice from (b) (n = 5). f qPCR analysis of Selp and Sele in livers from (b) (n = 5). g IF staining of CD31 (green) and P-selectin (red) and quantification of CD31+P-selectin+ ECs in BDL livers from (b) (n = 5). h qPCR analysis of Ly6g and Ngp in livers from (b) (n = 5). i IHC of Ly6G and quantification in liver tissue samples from (b) (n = 5). j qPCR analysis of indicated genes in livers from (b) (n = 5). Data are presented as the mean ± SEM. P values are indicated as follows: * <0.05; ** <0.01; *** <0.001; **** <0.0001, ns = no significance. P values were obtained using the unpaired two-tailed Student’s t-test. Source data are provided as a Source Data file.
Fig. 6
Fig. 6. Activation of the MYC/P-selectin axis in ECs by CDCA via FXR.
Protein expression levels of MYC and SELP in HUVECs treated with unconjugated (a) and conjugated bile acids (c), with corresponding quantitative analyzes (b, d). Spearman correlation analysis between MYC and SELP expressions in HUVECs treated with unconjugated (e) and conjugated bile acids (f) from (a) to (c). g qPCR analysis of MYC and SELP in HUVECs treated with the FXR agonist INT747 (20 μM) or DMSO for 48 h (n = 3). Protein levels of MYC and SELP (h) and quantification (i) in HUVECs treated with INT747 (20 μM) or DMSO for 48 h (n = 3). j qPCR analysis of MYC and SELP in HUVECs treated with UDCA (200 μM) or DMSO for 48 h (n = 3). k, l Protein levels of MYC and SELP (k) and quantitative analysis (l) in HUVECs treated with UDCA (200 μM) or DMSO for 48 h (n = 3, 4). m Protein levels of MYC and SELP in siNC- or siFXR-treated HUVECs following treatment with GW4064 (5 μM) or DMSO for 48 h. A representative Western blot from n = 3 biological repeats is shown. n Protein levels of MYC and SELP in gLUC- or gMYC-treated HUVECs following GW4064 (5 μM), INT-747(20 μM) or DMSO treatment for 48 h. Western blot data are representative of at least 3 biological repeats, with 2 repeat experiments per sample. o qPCR analysis of Fxr, Myc and Selp in ECs from Fxr−/− and WT mice treated with GW4064 (5 μM) or DMSO for 48 h (n = 6). p Sorting of primary endothelial cells in Lyve1-MycLSL/+ mice by FACS. qPCR analysis of Fxr, Tgr5, Myc and Selp in ECs from Lyve1-MycLSL/+ mice treated with siFxr (q), siTgr5 (r) or NC for 48 h (n = 6). Data are presented as the mean ± SEM. P values are indicated as follows: * <0.05; ** <0.01; *** <0.001; **** <0.0001, ns = no significance. P values were obtained using the unpaired two-tailed Student’s t-test. Source data are provided as a Source Data file.
Fig. 7
Fig. 7. Clinical relevance of the endothelial MYC/P-selectin regulation axis in patients with obstructive cholestasis (OC).
a Single-cell analysis workflow. b UMAP showing 9 major cell types. c Contour plot displaying changes in cell abundance. d Volcano plot showing significantly changed genes. e Enriched biological processes in OC ECs compared to controls. f UMAP showing the levels of MYC and SELP in ECs. g H&E and IHC for indicated proteins in liver samples, with arrows indicating Myc-positive ECs. Quantitative analysis of IHC for MYC, SELP, and MPO (n = 9, 16) (h), and Spearman correlation analysis (i). j Schematic diagram illustrating the molecular mechanism underlying the role of ECs in shaping the local immune microenvironment during obstructive cholestasis. Data are presented as the mean ± SEM. P values are indicated as follows: ** <0.01; *** <0.001; **** <0.0001. P values were obtained using the unpaired two-tailed Student’s t-test. Source data are provided as a Source Data file.

References

    1. Hirschfield, G. M., Heathcote, E. J. & Gershwin, M. E. Pathogenesis of cholestatic liver disease and therapeutic approaches. Gastroenterology139, 1481–1496 (2010). - PubMed
    1. Stedman, C. et al. Benefit of farnesoid X receptor inhibition in obstructive cholestasis. Proc. Natl Acad. Sci. USA103, 11323–11328 (2006). - PMC - PubMed
    1. Guo, C. S. et al. Bile acids control inflammation and metabolic disorder through inhibition of NLRP3 inflammasome. Immunity45, 802–816 (2016). - PubMed
    1. Ma, C. et al. Gut microbiome-mediated bile acid metabolism regulates liver cancer via NKT cells. Science360, eaan5931 (2018). - PMC - PubMed
    1. Paik, D. et al. Human gut bacteria produce ΤΗ17-modulating bile acid metabolites. Nature603, 907–912 (2022). - PMC - PubMed

MeSH terms

LinkOut - more resources