. 2025 Mar 1;16(1):2095.
doi: 10.1038/s41467-025-57302-x.

Dissecting apicoplast functions through continuous cultivation of Toxoplasma gondii devoid of the organelle

Affiliations

Dissecting apicoplast functions through continuous cultivation of Toxoplasma gondii devoid of the organelle

Min Chen et al. Nat Commun. .

Abstract

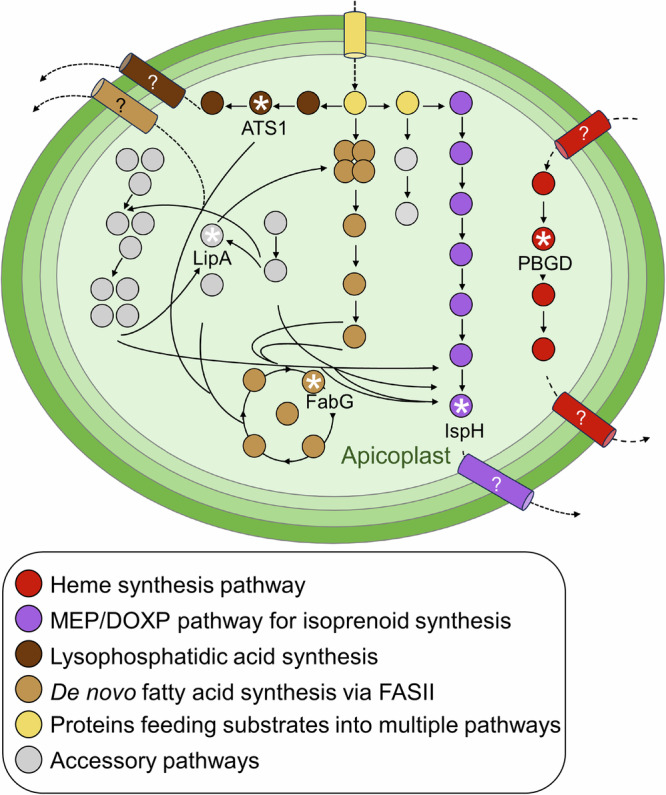
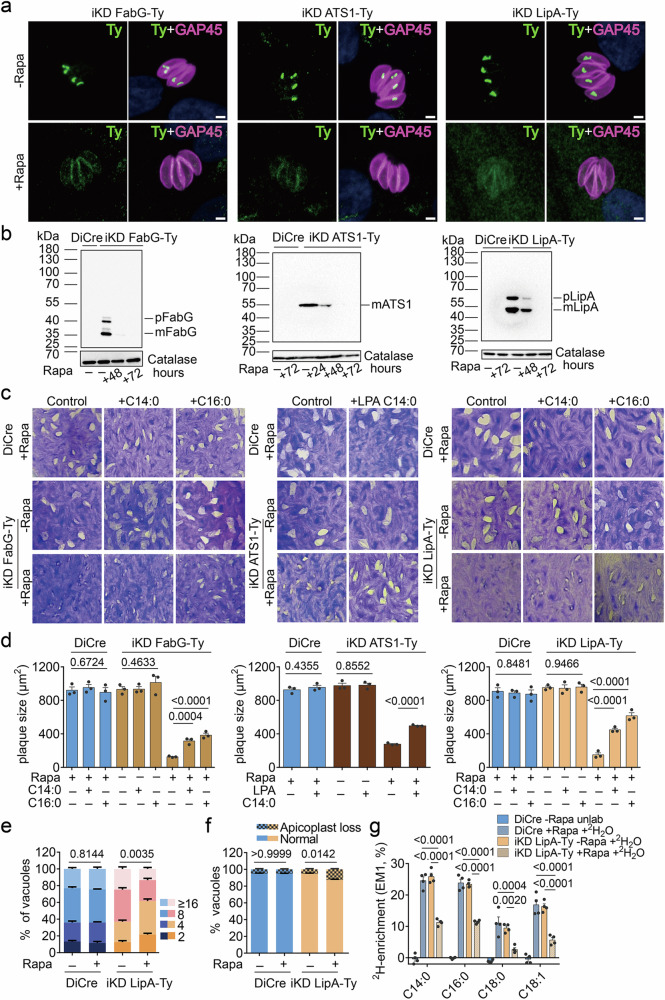
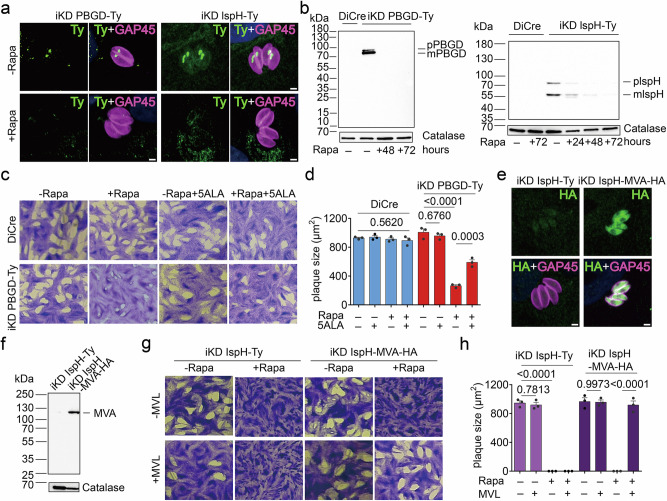
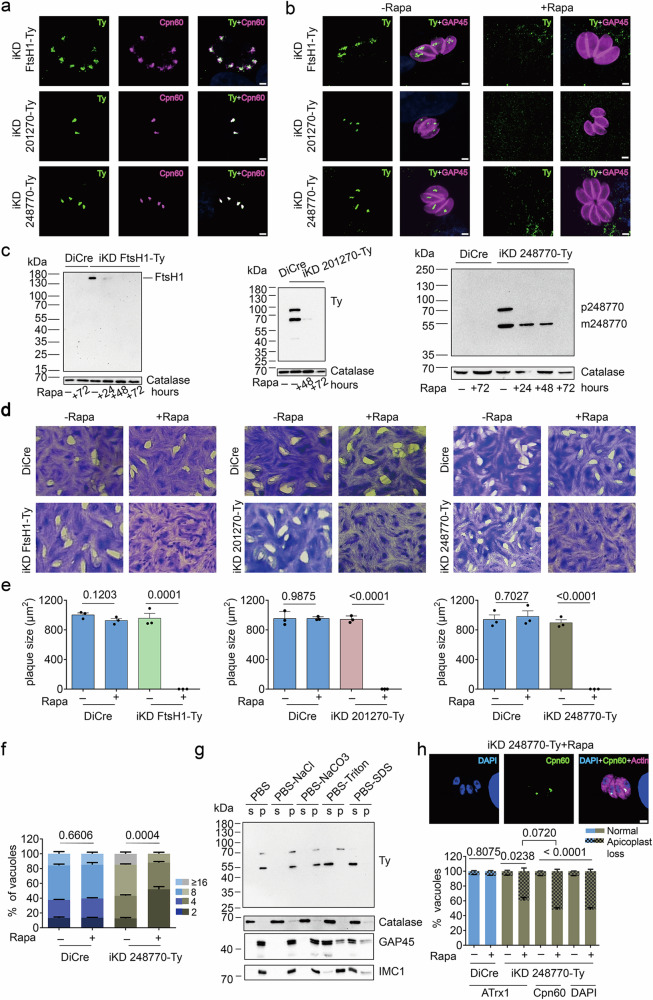
The apicoplast, a relic plastid organelle derived from secondary endosymbiosis, is crucial for many medically relevant Apicomplexa. While it no longer performs photosynthesis, the organelle retains several essential metabolic pathways. In this study, we examine the four primary metabolic pathways in the Toxoplasma gondii apicoplast, along with an accessory pathway, and identify conditions that can bypass these. Contrary to the prevailing view that the apicoplast is indispensable for T. gondii, we demonstrate that bypassing all pathways renders the apicoplast non-essential. We further show that T. gondii lacking an apicoplast (T. gondii-Apico) can be maintained indefinitely in culture, establishing a unique model to study the functions of this organelle. Through comprehensive metabolomic, transcriptomic, and proteomic analyses of T. gondii-Apico we uncover significant adaptation mechanisms following loss of the organelle and identify numerous putative apicoplast proteins revealed by their decreased abundance in T. gondii-Apico. Moreover, T. gondii-Apico parasites exhibit reduced sensitivity to apicoplast targeting compounds, providing a valuable tool for discovering new drugs acting on the organelle. The capability to culture T. gondii without its plastid offers new avenues for exploring apicoplast biology and developing novel therapeutic strategies against apicomplexan parasites.


Conflict of interest statement

Competing interests: The authors declare no competing interests.

Figures

Fig. 1
Fig. 1. Schematic overview of the metabolic pathways in the apicoplast of T. gondii.
Schematic depiction of the four-membrane enclosed apicoplast organelle. Enzymes are shown as circles, and transporters as barrels. Note that, for simplicity, transporters are depicted spanning multiple membranes. Enzymes of output-generating pathways that produce metabolites needed outside of the apicoplast are shown as colored circles (see legend), while supporting pathway enzymes are depicted in gray. Products/intermediates of the isoprenoid and heme synthesis pathways are exported and further processed in the cytosol or at the mitochondrion, while fatty acids and lipids generated in the apicoplast can be further processed at the endoplasmic reticulum (not shown). Enzymes investigated as part of this study are highlighted by their provided abbreviation and are marked with a white asterisk. Expected transporters of unknown identity are indicated by question marks. Abbreviations: PBGD, porphobilinogen deaminase; IspH, 4-hydroxy-3-methylbut−2-enyl diphosphate reductase; FabG, 3-ketoacyl-acyl carrier protein reductase; LipA, lipoic acid synthase; ATS1, glycerol 3-phosphate acyltransferase 1; MEP/DOXP, 2-C-methyl-D-erythritol 4-phosphate/ 1-deoxy-D-xylulose 5-phosphate; FASII, type II fatty acid synthase.
Fig. 2
Fig. 2. Partial rescue of the fatty acid and lipid precursor synthesis pathways in the T. gondii apicoplast.
a Indirect immunofluorescence assays (IFAs) of iKD FabG-Ty, iKD ATS1-Ty and iKD LipA-Ty parasites treated with rapamycin (Rapa) for 72 h or not, stained with anti-Ty, and anti-GAP45 (pellicle marker) antibodies (n = 3). b Western blots of iKD FabG-Ty, iKD ATS1-Ty, and iKD LipA-Ty and its parental controls after varying durations of Rapa treatment. Membranes were probed with anti-Ty and anti-catalase (loading control) antibodies (n = 3). c, d Plaque assays of DiCre and iKD FabG-Ty, iKD ATS1-Ty and iKD LipA-Ty in normal medium or medium supplemented with 100 µM myristic (C14:0) or palmitic acid (C16:0) (iKD FabG-Ty and iKD LipA-Ty) or 20 µM lysophosphatidic acid (LPA 0:0/14:0) (iKD ATS1-Ty) (c) and quantification of plaque sizes (n = 3) (d). e Intracellular growth assay of DiCre and iKD LipA-Ty after 24 h of intracellular growth and treatment for a total of 72 h with Rapa or not (n = 3). f Quantification of apicoplast loss of iKD LipA-Ty following treatment as for e (n = 3). g Measurement of 2H incorporation into major fatty acids of DiCre and iKD LipA-Ty parasites following 72 h of Rapa treatment and 24 h of 2H2O labeling (3.6% v/v) as measured by GC-MS (n = 4). Pictures in (a, b, and c) are representative of 3 independent experiments. Bar graphs in (dg) show the means (bars) of three or four independent experiments. In (d and g), dots represent the means of each experiment, based on at least 10 plaques and 4 biological replicates, respectively. Error bars indicate the standard deviation. In (df), Student’s two-sided t tests compare the indicated conditions. In (g), the indicated conditions were compared via a One-way ANOVA followed by Tukey’s pairwise comparison. All p-values are given and were considered significant at p < 0.05. Scale bars in a: 2 µm. Source data are provided as a Source Data file.
Fig. 3
Fig. 3. Bypass of the heme and isoprenoid synthesis pathways in the T. gondii apicoplast.
a Indirect immunofluorescence assays (IFAs) of iKD PBGD-Ty and iKD-IspH-Ty parasites in the presence (72 h) or absence of rapamycin (Rapa), stained with anti-Ty, and anti-GAP45 (pellicle marker) antibodies (n = 3). b Western blot of iKD PBGD-Ty and iKD-IspH-Ty parasite extracts and the parental control after different durations of Rapa treatment. Membranes were probed with anti-Ty and anti-catalase (loading control) antibodies (n = 3). c, d Plaque assays of DiCre and iKD PBGD-Ty parasites in the normal medium or supplemented with 300 µM 5-aminolevulinic acid (5ALA) in the presence or absence of Rapa (c) and quantification of plaque sizes (n = 3) (d). e IFA of iKD IspH-Ty and iKD IspH-MVA-HA parasites stained with anti-HA, and anti-GAP45 antibodies. f Western blot of iKD IspH-Ty and iKD IspH-MVA-HA parasite extracts, probed with anti-HA and anti-catalase (loading control) antibodies. g, h Plaque assays of iKD IspH-Ty and iKD IspH-MVA-HA parasites in the presence or absence of Rapa in normal medium (− MVL) or supplemented with 10 mM mevalonolactone (+ MVL) (g) and quantification of plaque sizes (n = 3) (h). Pictures in (ac, eg) are representative of three independent experiments. Bar graphs in (d and h) show the means (bars) of three independent experiments. Dots represent the means of the experiments, averaging at least 10 plaques per experiment. Error bars indicate the standard deviation and Student’s two-sided t tests compare the indicated conditions. p-values are given and were considered significant at p < 0.05. Scale bars in a and e: 2 µm. Source data are provided as a Source Data file.
Fig. 4
Fig. 4. Validation and characterization of T. gondii devoid of an apicoplast.
a, b Plaque assay of RH in the absence or presence of 40 µM actinonin (a) and quantification of plaque sizes (n = 3) (b). c Intracellular growth of RH parasites, determined at 24 h after inoculation and a total duration of 72 h actinonin treatment (40 µM) or not (n = 3). d Quantification of apicoplast loss based on ATrx1 signal in RH following treatment as for c (n = 3). e, f Plaque assay of RH and RH-MVA-HA parasites in normal medium (NM) and apicoplast-rescue medium (ARM) ± actinonin (40 µM) (e) and quantification of plaque sizes (n = 3) (f). g, h Plaque assay of RH-MVA-HA and RH-MVA-HA−Apico parasites in NM and ARM (g) and quantification of plaque sizes (n = 3) (h). i Intracellular growth assay of RH-MVA-HA and RH-MVA-HA−Apico in NM or ARM (n = 3). j Indirect immunofluorescence assays (IFAs) of RH-MVA-HA and RH-MVA-HA−Apico parasites stained with anti-Cpn60 (apicoplast lumen marker) and anti-actin (cytosol marker) or anti-ATrx1 (apicoplast membrane marker) and anti-GAP45 (pellicle marker) antibodies. k Western blot of RH, RH-MVA-HA, and RH-MVA-HA−Apico parasite extracts. Membranes were probed with anti-Cpn60 and anti-catalase (loading control) antibodies. The pre-processed (p) and mature (m) forms of Cpn60 are indicated. l PCR amplifying a fragment of the apicoplast genome and nuclear-encoded actin (control) in RH, RH-MVA-HA, and RH-MVA-HA−Apico parasites. The expected amplicon sizes are indicated. m Apicoplast loss in RH-MVA-HA following eight consecutive passages in NM or ARM as determined by ATrx1 signal (n = 3). n survival curve of mice infected with 1000 RH-MVA-HA or RH-MVA-HA−Apico parasites (3 mice per condition). Pictures in (jl) are representative of three independent experiments. All bar graphs show the means (bars) of three or more independent experiments with error bars indicating the standard deviation. Dots in (b, f and h) represent the average of each experiment, averaging at least 10 plaques per experiment. Student’s two-sided t tests compare the indicated conditions. p-values are given at were considered significant at p < 0.05. Scale bars in j: 2 µm. Source data are provided as a Source Data file.
Fig. 5
Fig. 5. T. gondii exhibit reduced sensitivity to apicoplast-targeting drugs under conditions bypassing the organelle.
ac Plaque assays of RH-MVA-HA in the presence of different concentrations of clindamycin (a), atovaquone (b), and triclosan (c) cultured in normal medium (NM) or apicoplast rescue medium (ARM) and the corresponding plaque size quantifications (n = 3) (df). gi Intracellular growth assays showing parasite numbers per vacuole following 24 h of growth in NM or ARM and a total of 36 h of drug exposure (10 µM) (n = 3). Note that the same results were used for the no-drug control in (gi). Pictures in (ac) are representative of three independent experiments. Bar graphs in (df) show the means (bars) of these three experiments, with dots averaging at least 10 plaques per experiment. Similarly, bar graphs in (gi) show the means of three independent experiments. Error bars in (di) indicate the standard deviation, and Student’s two-sided t tests compare the indicated conditions. In (gi), the average number of parasites per vacuole was compared. p-values are given and were considered significant at p < 0.05. Source data are provided as a Source Data file.
Fig. 6
Fig. 6. Metabolomic analyses of T. gondii lacking an apicoplast.
a Metabolomic profiling of RH, RH-MVA-HA, and RH-MVA-HA−Apico in normal medium (NM) and apicoplast rescue medium (ARM). Metabolites measured by GC-MS are categorized into distinct classes, with relative abundances displayed in a heatmap. Metabolite abundances were compared between the indicated conditions and tested for significant differences using Student’s two-sided t tests. Significantly altered metabolites (p < 0.05, FC > 2) are highlighted by the provision of the numerical fold change in the corresponding cell (n = 5). b 2H2O-labeling of intracellular RH, RH-MVA-HA, and RH-MVA-HA−Apico parasites over 24 h, followed by fatty acid (myristic acid, C14:0, and palmitic acid, C16:0) labeling analysis (excess molar enrichment of the M1 isotopologue, EM1 in %) via GC-MS (n = 3 - 4). c U−13C6-glucose labeling of purified extracellular parasites for 5 h, with isotopologue abundances measured by GC-MS (n = 3). d Intracellular growth assay comparing the growth rates of RH-MVA−Apico and RH-MVA-HA−ApicoΔUROS parasites in NM and ARM (n = 3). Bar graphs in (bd) represent the means of three or more independent experiments. Dots in b represent the 2H-enrichment calculated for each of the 3 − 4 independent biological replicates. All error bars denote the standard deviation. Student’s two-sided t tests were used to compare conditions, with p-values < 0.05 considered significant. Source data are provided as a Source Data file.
Fig. 7
Fig. 7. Loss of the apicoplast leads to a reduction in the level of its constituents, likely due to reduced protein stability.
a Volcano plot highlighting changes in protein levels of parasites lacking an apicoplast (RH-MVA-HA−Apico) in comparison to their control with an apicoplast (RH-MVA-HA), both cultured in apicoplast rescue medium (ARM). Differential abundance testing between the two conditions was performed using an unpaired t test. Non-significantly or < 1.5-fold altered proteins are displayed in gray, while significantly decreased or increased proteins (p-value  <  0.05, FC > 1.5) are displayed in red and blue, respectively (n = 3). b Significantly increased or decreased proteins sorted according to their sub-cellular localization using the hyperplexed Localization of Organelle Proteins by Isotopic Tagging (LOPIT) data available under https://proteome.shinyapps.io/toxolopittzex/. c Overview of proteins associated with metabolic pathways in the apicoplast and related enzymes in the cytosol, mitochondrion, and at the endoplasmic reticulum (ER). Symbols and colors (see legend) indicate each protein’s behavior in the comparative proteomic analysis plotted in (a). d Volcano plot highlighting changes in transcript levels of parasites lacking an apicoplast (RH-MVA-HA−Apico) in comparison to their control strain with an apicoplast (RH-MVA-HA), both cultured in apicoplast rescue medium (ARM) (n = 4). A differential expression analysis was performed with the statistical analysis R/Bioconductor package edgeR1.38.4. with multiple testing Benjamini and Hochberg correction FDR 5% and a fold change threshold of 2. Non-significantly or < 2-fold altered transcripts are displayed in gray, while significantly decreased or increased transcripts (p-value < 0.05, FC > 2) are displayed in blue and red, respectively. e Log fold changes from proteomic analyses plotted against log fold changes in transcriptomic analyses from the comparison of RH-MVA-HA and RH-MVA-HA−Apico parasites cultured in ARM (as plotted in a and d). Genes affected significantly at the RNA and protein level (p < 0.05, FC > 2 for transcriptomics, and FC > 1.5 for proteomics) are highlighted in red or blue for down- and upregulated products, respectively. Note that for the assessment of the subcellular localization (b), some compartments reported as distinct in the original study were merged for simplicity: apical1/apical2, rhoptries1/rhoptries2, PM – peripheral1/ PM – peripheral 2 and ER1/ER2. For abbreviations related to the enzymes in panel (c), please refer to the Supplementary Information file.
Fig. 8
Fig. 8. Characterization of a newly identified Coccidia-specific apicoplast protein.
a Indirect immunofluorescence assays (IFAs) of iKD FtsH1-Ty, iKD 201270-Ty, and iKD 248770-Ty parasites, stained with anti-Ty and anti-Cpn60 (apicoplast lumen marker) antibodies. b IFAs of iKD FtsH1-Ty, iKD 201270-Ty, and iKD 248770-Ty parasites treated with rapamycin (+ Rapa, 72 h) or not and stained with anti-Ty and anti-GAP45 (pellicle marker) antibodies. c Western blots of DiCre, iKD FtsH1-Ty, iKD 201270-Ty, and iKD 248770-Ty parasite extracts after different durations of Rapa treatment. Membranes were probed with anti-Ty and anti-catalase (loading control) antibodies (n = 3). d, e Plaque assays of DiCre, iKD FtsH1-Ty, iKD 201270-Ty and iKD 248770-Ty parasite in culture medium ± Rapa (d) and quantification of plaque sizes (n = 3). e, f Intracellular growth assay of DiCre and iKD 248770-Ty parasites. Data reflects intracellular growth over 24 h and the total duration of Rapa treatment of 72 h (n = 3). g Solubility assay of extracts from iKD 248770-Ty parasites. Membranes were probed with anti-Ty antibodies. Additionally, membranes were probed with anti-catalase, anti-GAP45, and anti-IMC1 antibodies as markers for the PBS-, Triton-, and SDS-soluble fraction, respectively. s, supernatant; p, pellet. h Quantification of apicoplast loss based on ATrx1 (apicoplast membrane marker), Cpn60, and DAPI staining in DiCre and iKD 248770-Ty parasites, following treatment as in f (n = 3). Pictures in (a, b, and g) are representative of three independent experiments. All bar graphs show the means (bars) of three independent experiments. In e, dots represent the means of each experiment, averaging at least 10 plaques per experiment. Error bars indicate the standard deviation. Student’s two-sided t tests compare the indicated conditions. p-values are given and were considered significant at p < 0.05. Scale bars in (a, b and h): 2 µm. Source data are provided as a Source Data file.

References

    1. McAuley, J. B. Congenital Toxoplasmosis. J. Pediatr. Infect. Dis. Soc.3, S30–S35 (2014). - PMC - PubMed
    1. Nissapatorn, V. Toxoplasma gondii and HIV: a never-ending story. Lancet HIV4, e146–e147 (2017). - PubMed
    1. Organization, W. H. World malaria report 2021 (2021).
    1. Bishop, R., Musoke, A., Morzaria, S., Gardner, M. & Nene, V. Theileria: intracellular protozoan parasites of wild and domestic ruminants transmitted by ixodid ticks. Parasitology129, S271–S283 (2004). - PubMed
    1. Reichel, M. P., Alejandra Ayanegui-Alcerreca, M., Gondim, L. F. & Ellis, J. T. What is the global economic impact of Neospora caninum in cattle - the billion dollar question. Int. J. Parasitol.43, 133–142 (2013). - PubMed

Substances

LinkOut - more resources