. 2025 Mar 1;16(1):2096.
doi: 10.1038/s41467-025-57379-4.

Genomically defined hypervirulent Klebsiella pneumoniae contributed to early-onset increased mortality

Affiliations

Genomically defined hypervirulent Klebsiella pneumoniae contributed to early-onset increased mortality

Yunfei Tang et al. Nat Commun. .

Abstract

The presence of all five of the virulence-associated genes iucA, iroB, peg-344, rmpA, and rmpA2 is presently the most accurate genomic means for predicting hypervirulent Klebsiella pneumoniae (hvKp-p). With this longitudinal cohort study, we firstly provide novel insights into the clinical and genomic characteristics of hvKp-p in high-risk regions. Through propensity score matching, we show that hvKp-p is less likely to acquire antimicrobial resistance but develops more severe disease and result in increased mortality. HvKp-p are predominantly isolated from hospital settings and caused pneumonia in majority of the cases. ST23 and KL1 are the most common types in the hvKp-p cohort. Community-acquired and healthcare-associated infections are also identified as independent risk factors for hvKp-p. This genomic definition, albeit imperfect, offers a practical and efficient alternative to murine models, allowing for early identification and timely intervention in clinical settings.


Conflict of interest statement

Competing interests: The authors declare no competing interests.

Figures

Fig. 1
Fig. 1. Clinical characteristics of patients with Kp infections.
A Annual isolate counts from 2017 to 2023 (total n = 1179), colored by specimen type. The blue line shows the number of hvKp-p isolates per year according to the right-hand y-axis. Data are presented as mean values ± SEM (central point indicates frequency, error bars indicate standard error of the mean). B Charlson Comorbidity Index (CCI) distribution colored by specimen type: Respiratory Tract (n = 605), Urogenital Tract (n = 276), Bloodstream (n = 141), Abdominal Cavity (n = 64), Skin and Soft Tissue (n = 53), Others (n = 40). Each point represents an individual patient. The half-violin plots show the density of CCI. The half-box plots indicate the median, interquartile range (IQR) including 25th and 75th percentiles, and the whiskers extend up to 1.5 × IQR. A two-tailed Kruskal-Wallis test was performed, followed by Dunn’s post-test with Bonferroni correction for multiple comparisons. P-values from left to right: < 0.001, 0.020, < 0.001. *: P-value between 0.01 and 0.05, **: P-value between 0.001 and 0.01, ***: P-value < 0.001. C Survival up to days 14, 28, and 90 for the hvKp-p (n = 118) and cKp-p cohort 2 (n = 118) after PSM. The corresponding table shows the number at risk over time. A two-tailed log-rank test was performed, and p-values are indicated in the figures. D Risk factors associated with hvKp-p infection (n = 127). Horizontal lines indicate 95% confidence intervals (CI), and squares represent odds ratios (ORs) calculated for each predictor. In the univariate logistic regression model, ORs were calculated for each listed variable. In the multivariable regression, variables with p < 0.1 in the univariate analysis were included to calculate adjusted ORs. A two-sided Wald test was performed. Source data are provided as a Source Data file.
Fig. 2
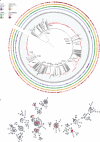
Fig. 2. Phylogenetic relationships of the Kp isolates and subtypes collected in this study.
A Circular phylogenetic tree of the 1179 isolates reconstructed from whole genome data by the maximum likelihood method. From the inner to outer circles, the first circle adjacent to the isolate names shows whether the isolates carry all of the five virulence genes, whether the patients infected by the isolate present sepsis, septic shock, or poor prognosis (N: negative; P: positive). B Minimum spanning tree constructed based on the allelic profiles of the associated STs by the goeBURST algorithm. The circles represent the STs, and the red fans represent the proportion of isolates (n = 127) carrying all of the five virulence genes among each ST. The numbers on the lines represent the numbers of different alleles between two STs. Source data are provided as a Source Data file.
Fig. 3
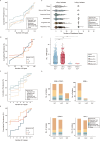
Fig. 3. Molecular characteristics of Kp isolates.
A, B) Cumulative prevalence of K-loci ordered by mean prevalence across specimen type and virulence factors (VFs). Lines in Fig. 3A are colored by specimen type as per panel A of Fig. 1. Lines in Fig. 3B are colored by VFs. 5VF: isolates harboring all five key virulence factors, including iucA, iroB, peg-344, rmpA, and rmpA2. 1-4VF: isolates harboring any combination of fewer than five key virulence factors. 0VF: isolates harboring none of the five key virulence factors. C, D Cumulative prevalence of predicted O-types ordered by mean prevalence across specimen type and VFs. E Distribution of the number of acquired antimicrobial resistance (AMR) genes between the hvKp-p and cKp-p isolates, stratified by specimen type. F Distribution of the number of AMR genes across four groups: cKp-p cohort without ICU admission (n = 732), cKp-p cohort with ICU admission (n = 320), hvKp-p cohort without ICU admission (n = 102) and hvKp-p cohort with ICU admission (n = 25). Bars are colored by ICU admission status (blue = not admitted, red = admitted). The center line represents the median, the box bounds the 25th and 75th percentiles, and the whiskers extend up to 1.5 × IQR. A two-tailed Kruskal-Wallis test was performed, followed by Dunn’s post-test with Bonferroni correction for multiple comparisons. P-values from left to right: < 0.001, < 0.001, < 0.001. *: P-value between 0.01 and 0.05, **: P-value between 0.001 and 0.01, ***: P-value < 0.001. G Frequency of genomes with different VFs, shown by ESBL, CRKP, and KPC gene status. Bars are colored by specimen type as shown in Panel A of Fig. 1. Source data are provided as a Source Data file.

References

    1. Liu, C. et al. An increased prevalence of carbapenem-resistant hypervirulent Klebsiella pneumoniae associated with the COVID-19 pandemic. Drug Resist. Updat.77, 101124 (2024). - PubMed
    1. Wang, Q. et al. Phenotypic and genotypic characterization of carbapenem-resistant enterobacteriaceae: data from a longitudinal large-scale CRE study in China (2012-2016). Clin. Infect. Dis.67, S196–S205 (2018). - PubMed
    1. Russo, T. A. & Marr, C. M. Hypervirulent Klebsiella pneumoniae. Clin. Microbiol. Rev.32, 10.1128/cmr.00001-19 (2019). - PMC - PubMed
    1. Liu, C., Guo, J., Lu, M., Shen, N. & Du, P. Dissemination of the mobilised RND efflux pump gene cluster tmexCD-toprJ among Klebsiella pneumoniae. The Lancet. Microbe4, e135 (2023). - PubMed
    1. Liu, C. et al. Emergence and Inter- and Intrahost Evolution of Pandrug-Resistant Klebsiella pneumoniae Coharboring tmexCD1-toprJ1, bla(NDM-1), and bla(KPC-2). Microbiol. Spectr.11, 10.1128/spectrum.02786-22 (2023). - PMC - PubMed

MeSH terms

LinkOut - more resources