. 2025 Mar 1;15(1):7305.
doi: 10.1038/s41598-025-91872-6.

Carbon minibeam radiation therapy results in tumor growth delay in an osteosarcoma murine model

Affiliations

Carbon minibeam radiation therapy results in tumor growth delay in an osteosarcoma murine model

Annaïg Bertho et al. Sci Rep. .

Abstract

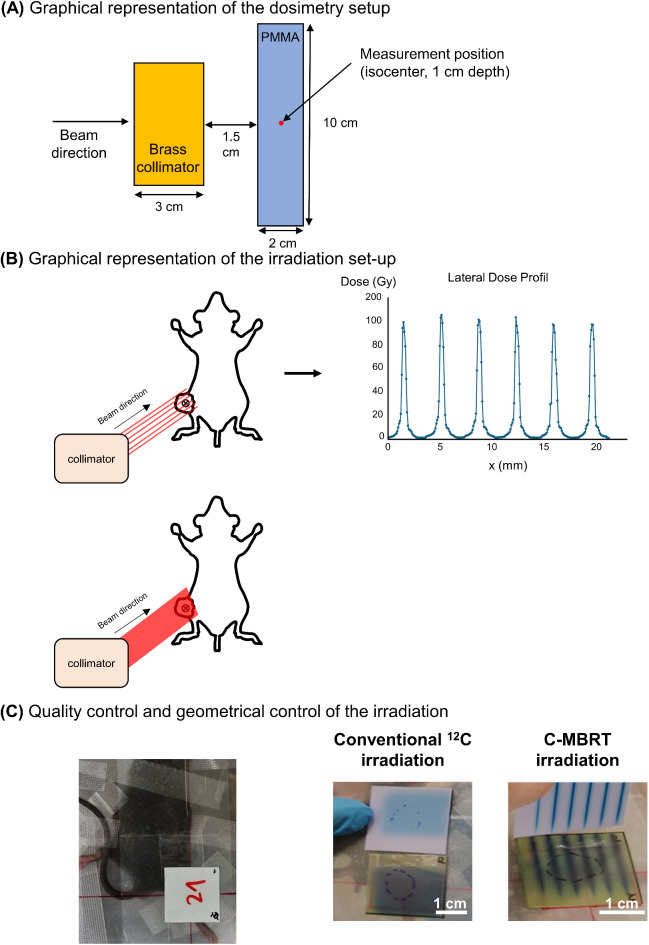
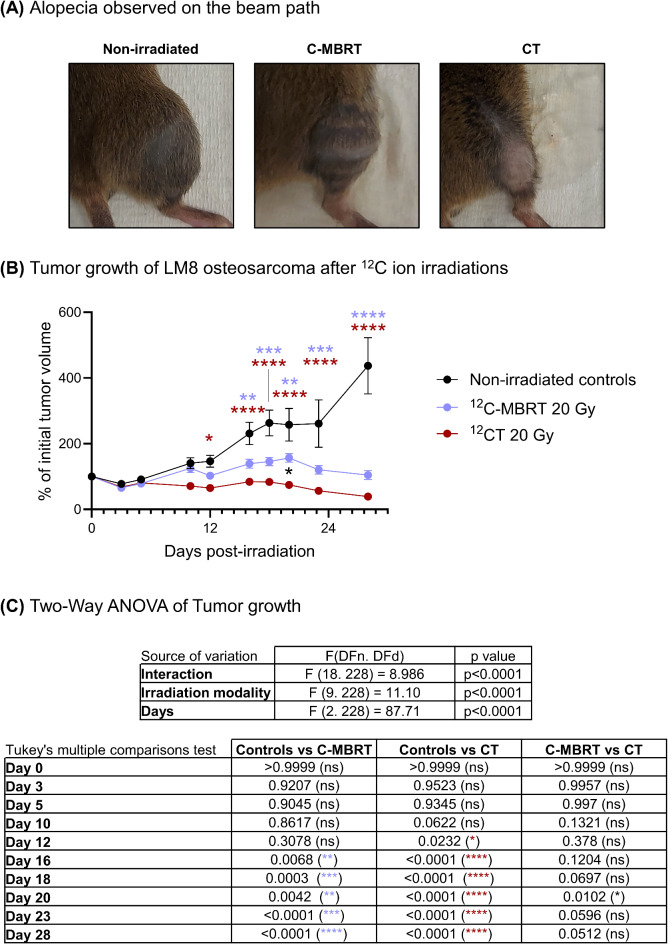
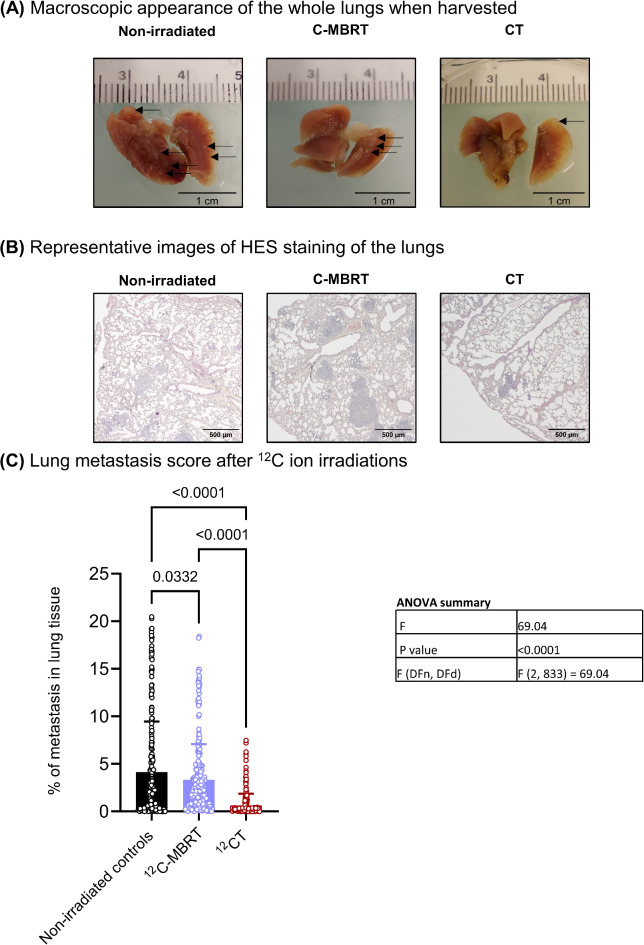
Despite remarkable advances, radiation therapy (RT) remains inefficient for some bulky tumors, radioresistant tumors, and certain pediatric tumors. Minibeam radiation therapy (MBRT) has emerged as a promising approach, reducing normal tissue toxicity while enhancing immune responses. Preclinical studies using X-rays and proton MBRT have demonstrated enhanced therapeutic index for aggressive tumor models. Combining MBRT's advantages of spatial dose fractionation with the physical and biological benefits of carbon ions could be a step further toward unleashing the full potential of MBRT. This study aims to perform the first in vivo study of local and systemic responses of a subcutaneous mouse osteosarcoma (metastatic) model to carbon MBRT (C-MBRT) versus conventional carbon ion therapy (CT). Irradiations were conducted at the GSI Helmholtz Centre in Germany using 180 MeV/u 12C ions beam. All irradiated animals received an average dose (20 Gy) and displayed a significant and similar tumor growth delay in addition to a decreased metastasis score compared to the non-irradiated group. In the C-MBRT group, 70% of the tumor volume received the valley dose, which is a very low dose of 1.5 Gy. The remaining 30% of the tumor received the peak dose of 105 Gy, resulting in an average dose of 20 Gy. These results suggest that C-MBRT triggered distinct mechanisms from CT and encourage further investigations to confirm the potential of C-MBRT for efficient treatment of radioresistant tumors.

Keywords: Carbon ions; Carbon minibeam radiation therapy (C-MBRT); Carbon therapy; Minibeam radiation therapy; Osteosarcoma; Radioresistant tumor.


Conflict of interest statement

Declarations. Competing interests: The authors declare no competing interests.

Figures

Fig. 1
Fig. 1
Design of the experimental set-up. (A) Graphical representation of the radiation set-up used in this study. Mice were irradiated vertically. (B) Radiographic films were placed on the mice’s skin at the beam exit for quality control. The films outlined the tumor to give the geometrical distribution of peaks and valleys in the C-MBRT group.
Fig. 2
Fig. 2
Clinical symptoms observed following C-MBRT and conventional 12C irradiations. (A) Representative images of radiation-induced alopecia restricted to the irradiated area observed in the C-MBRT and CT groups, compared to the non-irradiated controls at 28 days post-irradiation. Mice limb were shaved before the tumor cell injection, explaining the slightly uneven fur growth in the non-irradiated control animals (B) Tumor growth curve of mice LM8 osteosarcoma after 12C irradiations. C-MBRT and CT lead to similar tumor control. In black = non-irradiated controls; blue = C-MBRT irradiated group; and red = CT irradiated group. Data are presented as the mean ± Standard error of the mean (SEM) (C) Statistical analysis regarding tumor growth was done using Two-Way ANOVA and Tukey’s multiple comparisons test. p-values < 0.05 were considered significant. *p < 0.05; **p < 0.01; ***p < 0.001; ****p-value < 0.0001.
Fig. 3
Fig. 3
LM8 osteosarcoma proliferative state following C-MBRT and CT, at the end of the study. (A) Proliferative state of the tumor cells. The graphic represents the density of Ki67-positive cells in the tumor: in black = non-irradiated controls; in blue = C-MBRT irradiated group; and red = CT irradiated group. Data are represented as the mean ± Standard Deviation (SD). (B) Representative images of Ki67 staining in the tumor, following C-MBRT and CT, compared to the non-irradiated controls. (C) Statistical analysis regarding Ki67-positive cell density in the tumor was done using One-Way ANOVA and Tukey’s multiple comparisons test. p-values < 0.05 were considered significant. *p < 0.05; **p < 0.01; ***p < 0.001; ****p-value < 0.0001.
Fig. 4
Fig. 4
T-cell infiltration of LM8 osteosarcoma following C-MBRT and CT, compared to the non-irradiated controls. (A) Representative images of CD8 staining of the tumors in the C-MBRT, CT, and non-irradiated groups. (B) CD8 positive T-cell infiltration of the tumor cells. The graphic represents the percentage of CD8-positive staining in the tumor section: in black = non-irradiated controls; in blue = C-MBRT irradiated group; and in red = CT irradiated group. Data are represented as the mean ± Standard Deviation (SD). Statistical analysis regarding CD8-positive cell density in the tumor was done using One-Way ANOVA and Tukey’s multiple comparisons test. p-values < 0.05 were considered significant. *p < 0.05; **p < 0.01; ***p < 0.001; ****p-value < 0.0001.
Fig. 5
Fig. 5
LM8 osteosarcoma metastasis score following C-MBRT and CT, 28 days after irradiation. (A) Macroscopic aspect of the whole lungs at the end of the study. (B) Representative images of HES staining of the lungs. (C) The graphic represents the lung metastasis score: in black = non-irradiated controls; in blue = C-MBRT irradiated group; and red = CT irradiated group. Data are represented as the mean ± Standard Deviation (SD). Statistical analysis regarding the lung metastasis score was done using One-Way ANOVA and Tukey’s multiple comparisons test. p-values < 0.05 were considered significant. *p < 0.05; **p < 0.01; ***p < 0.001; ****p-value < 0.0001.

References

    1. Prezado, Y. et al. Spatially fractionated radiation therapy: A critical review on current status of clinical and preclinical studies and knowledge gaps. Phys. Med. Biol.69(10), 1–21, 2024. - PubMed
    1. Dilmanian, F. A. et al. Interlaced x-ray microplanar beams: A radiosurgery approach with clinical potential. Proc. Natl. Acad. Sci. U S A103 (25), 9709–9714 (2006). - PMC - PubMed
    1. Deman, P. et al. Monochromatic minibeams radiotherapy: From healthy tissue-sparing effect studies toward first experimental glioma bearing rats therapy. Int. J. Radiat. Oncol. Biol. Phys.82 (4), e693–700 (2012). - PubMed
    1. Prezado, Y. et al. Tolerance to dose escalation in minibeam radiation therapy applied to normal rat brain: Long-term clinical, radiological and histopathological analysis. Radiat. Res.184 (3), 314–321 (2015). - PubMed
    1. Prezado, Y. et al. Proton minibeam radiation therapy spares normal rat brain: Long-term clinical, radiological and histopathological analysis. Sci. Rep.7 (1), 14403 (2017). - PMC - PubMed