

Genome-wide association study identifying novel risk variants associated with glycaemic traits in the continental African AWI-Gen cohort
- PMID: 40025146
- PMCID: PMC12069158
- DOI: 10.1007/s00125-025-06395-6
Genome-wide association study identifying novel risk variants associated with glycaemic traits in the continental African AWI-Gen cohort
Abstract
Aims/hypothesis: Glycaemic traits such as high fasting glucose levels and insulin resistance are positively associated with the risk of type 2 diabetes and other cardiometabolic diseases. Genetic association studies have identified hundreds of associations for each glycaemic trait, yet very few studies have involved continental African populations. We report the results of genome-wide association studies (GWASs) in a pan-African cohort for four glycaemic traits, namely fasting glucose, fasting insulin, insulin resistance (HOMA-IR) and beta cell function (HOMA-B), which are quantitative variables that affect the risk of developing type 2 diabetes.
Methods: GWASs for the four traits were conducted in approximately 10,000 individuals from the Africa Wits-INDEPTH Partnership for Genomics Studies (AWI-Gen) cohort, with participants from Burkina Faso, Ghana, Kenya and South Africa. Association testing was performed using linear mixed models implemented in BOLT-LMM, with age, sex, BMI and principal components as covariates. Replication, fine mapping and functional annotation were performed using standard approaches.
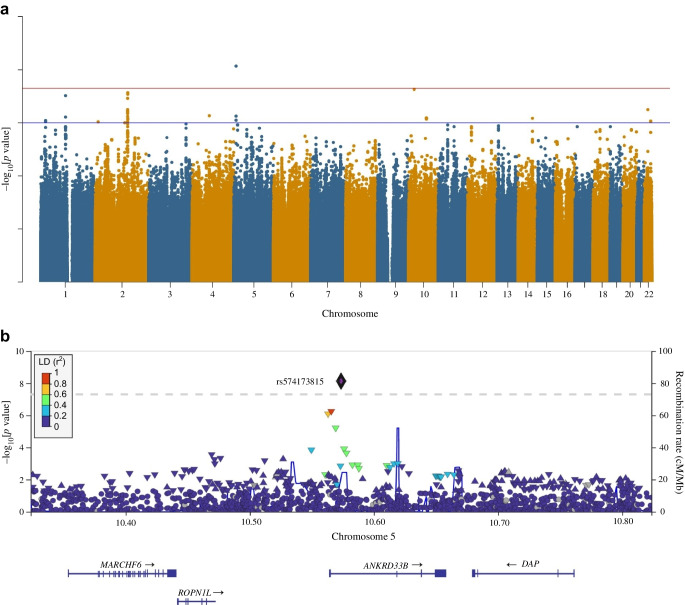
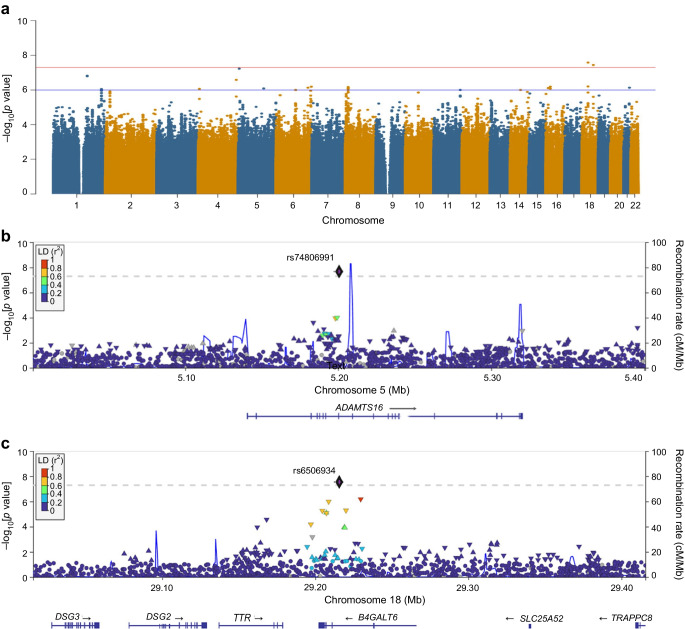
Results: We identified a novel signal (rs574173815) in the intron of the ankyrin repeat domain 33B (ANKRD33B) gene associated with fasting glucose, and a novel signal (rs114029796) in the intronic region of the WD repeat domain 7 (WDR7) gene associated with fasting insulin. SNPs in WDR7 have been shown to be associated with type 2 diabetes. A variant (rs74806991) in the intron of ADAM metallopeptidase with thrombospondin type 1 motif 16 (ADAMTS16) and another variant (rs6506934) in the β-1,4-galactosyltransferase 6 gene (B4GALT6) are associated with HOMA-IR. Both ADAMTS16 and B4GALT6 are implicated in the development of type 2 diabetes. In addition, our study replicated several well-established fasting glucose signals in the GCK-YTK6, SLC2A2 and THORLNC gene regions.
Conclusions/interpretation: Our findings highlight the importance of performing GWASs for glycaemic traits in under-represented populations, especially continental African populations, to discover novel associated variants and broaden our knowledge of the genetic aetiology of glycaemic traits. The limited replication of well-known signals in this study hints at the possibility of a unique genetic architecture of these traits in African populations.
Data availability: The dataset used in this study is available in the European Genome-Phenome Archive (EGA) database ( https://ega-archive.org/ ) under study accession code EGAS00001002482. The phenotype dataset accession code is EGAD00001006425 and the genotype dataset accession code is EGAD00010001996. The availability of these datasets is subject to controlled access by the Data and Biospecimen Access Committee of the H3Africa Consortium. GWAS summary statistics are accessible through the NHGRI-EBI GWAS Catalog ( https://www.ebi.ac.uk/gwas/ ).
Keywords: African ancestry; Fasting glucose; Fasting insulin; GWAS; Type 2 diabetes.
© 2025. The Author(s).
Conflict of interest statement
Acknowledgements: We thank all AWI-Gen participants for their consent to participate in the study and all the field workers, laboratory scientists, data managers and other support staff who contributed to sample collection and data generation. The complete list of AWI-Gen Consortium contributing members is provided in ESM Table 8. We acknowledge Jean-Tristan Brandenburg for developing and help in troubleshooting the H3A-GWAS pipeline used for quality control analysis and fine mapping, and Scott Hazelhurst for help with the use of the computing infrastructure. This study used the high-performance computing facilities at the University of Witwatersrand. Data on glycaemic traits used for replication have been contributed by MAGIC investigators and have been downloaded from www.magicinvestigators.org.African . We acknowledge other researchers who have publicly provided their data, which is cited accordingly in the manuscript used for replications in this study. Data availability: The dataset used in this study is available in the European Genome–Phenome Archive (EGA) database ( https://ega-archive.org/ ) under study accession code EGAS00001002482. The phenotype dataset accession code is EGAD00001006425 and the genotype dataset accession code is EGAD00010001996. The availability of these datasets is subject to controlled access by the Data and Biospecimen Access Committee of the H3Africa Consortium. GWAS summary statistics are accessible through the NHGRI-EBI GWAS Catalog ( https://www.ebi.ac.uk/gwas/ ; FG-BMIadjusted, GCST90503329; FG-BMIunadjusted, GCST90503330; FI-BMIadjusted, GCST90503331; FI-BMIunadjusted, GCST90503332; HOMA-B-BMIadjusted, GCST90503333; HOMA-B-BMIunadjusted, GCST90503334; HOMA-IR-BMIadjusted, GCST90503335; HOMA-IR-BMIunadjusted, GCST90503336). Other published datasets included in this study are referenced in the Methods section. Code availability: No custom codes were used in this study. We used publicly available software (referenced in the Methods section) in this research. The H3A-Africa GWAS pipeline was used for quality control analysis and fine mapping, and can be accessed at https://github.com/h3abionet/h3agwas . Other scripts used in this study are available at https://github.com/chirrie/GWAS-of-glycaemic-traits . Funding: The AWI-Gen Collaborative Center is funded by the National Human Genome Research Institute (NHGRI; grant number U54HG006938) as part of the Human Heredity and Health in Africa Consortium. Additional funding was granted by the Department of Science and Technology (now the Department of Science and Innovation), South Africa (award number DST/CON 0056/2014). The funders were not involved in the study’s design, in collection, analysis and interpretation of data, or in drafting the report, and did not restrict publication of the research. Authors’ relationships and activities: The authors declare that there are no relationships or activities that might bias, or be perceived to bias, their work. Contribution statement: AC, DS and MR conceived the study. ANW and NJC guided VJC regarding participant inclusion and exclusion criteria. VJC performed all analyses under the guidance of AC, DS and MR. VJC drafted the manuscript with input and supervision from MR, AC and DS. EAN, GA, ZS, PRB and IK directed fieldwork and sample collection. All authors have read, commented on, and approved the submitted version. VJC is responsible for the integrity of the work as whole.
Figures

References
-
- Porte D Jr, Kahn SE (2001) β-cell dysfunction and failure in type 2 diabetes: potential mechanisms. Diabetes 50(Suppl 1):S160. 10.2337/diabetes.50.2007.S160 - PubMed
-
- Pereira L, Mutesa L, Tindana P, Ramsay M (2021) African genetic diversity and adaptation inform a precision medicine agenda. Nat Rev Genet 22(5):284–306. 10.1038/s41576-020-00306-8 - PubMed
MeSH terms
Substances
Grants and funding
LinkOut - more resources
Full Text Sources
Medical
Miscellaneous
