. 2025 Mar 1;90(4):36.
doi: 10.1007/s00285-025-02196-y.

Evaluating the long-term effects of combination antiretroviral therapy of HIV infection: a modeling study

Affiliations

Evaluating the long-term effects of combination antiretroviral therapy of HIV infection: a modeling study

Jing Cai et al. J Math Biol. .

Abstract

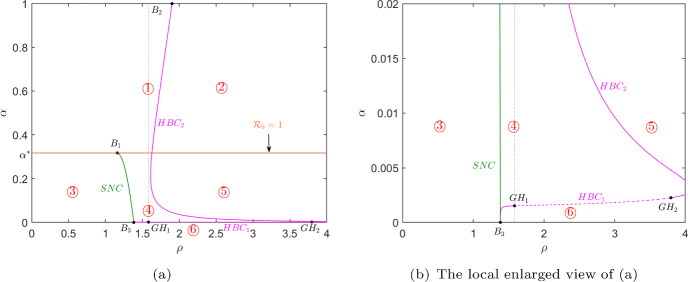
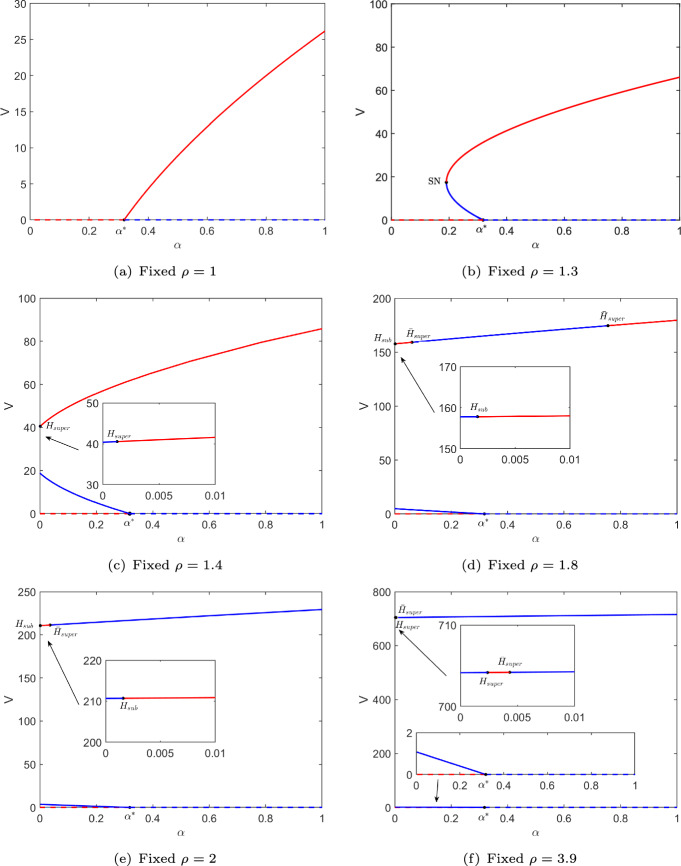
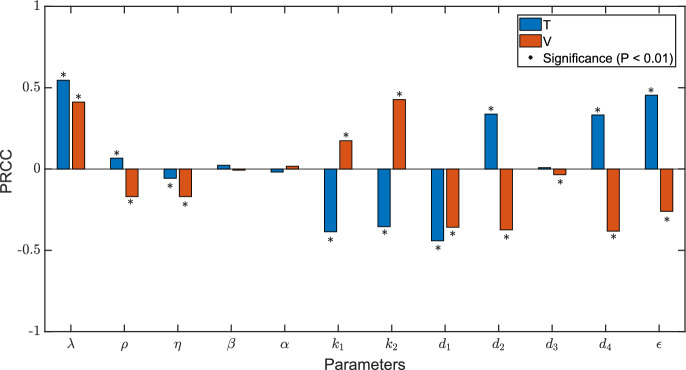
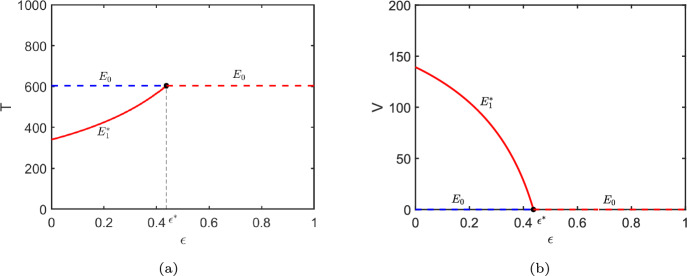
Current HIV/AIDS treatments effectively reduce viral loads to undetectable levels as measured by conventional clinical assays, but immune recovery remains highly variable among patients. To assess the long-term treatment efficacy, we propose a mathematical model that incorporates latently infected CD4 + T cells and the homeostatic proliferation of CD4 + T cells. We investigate the dynamics of this model both theoretically and numerically, demonstrating that homeostatic proliferation can induce bistability, which implies that steady-state CD4 + T cell count is sensitively affected by initial conditions. The model exhibits rich dynamics, including saddle node bifurcations, Hopf bifurcations, and saddle node bifurcations related to periodic orbits. The interplay between homeostatic proliferation and latent HIV infection significantly influences the model's dynamic behavior. Additionally, we integrate combination antiretroviral therapy (cART) into the model and fit the revised model to clinical data on long-term CD4 + T cell counts before and after treatment. Quantitative analysis estimates the effects of long-term cART, revealing an increasing sensitivity of steady-state CD4 + T cell count to drug efficacy. Correlation analysis indicates that the heightened activation of latently infected cells helps enhance treatment efficacy. These findings underscore the critical roles of CD4 + T cell homeostatic proliferation and latently infected cell production in HIV persistence despite treatment, providing valuable insights for understanding disease progression and developing more effective therapies, potentially towards eradication.

Keywords: Bifurcations and periodic orbits; Bistability; Data fitting; Latent HIV infection; Within-host model.


Conflict of interest statement

Declarations. Conflict of interest: The authors declare that they have no known competing financial interests or personal relationships that could have appeared to influence the work reported in this paper.

Figures

Fig. 1
Fig. 1
Saddle node bifurcation curve (green curve and marked SNC) and Hopf bifurcation curves (magenta curves and marked HBCi,i=1,2) in ρ,α plane, where the solid (dashed) magenta line represents the supercritical (subcritical) Hopf bifurcation. The orange line represents α=α=0.3179 corresponding to R0=1. The thresholds B1=1.161,0.3179,B2=1.903,1,B3=1.384,0 are critical points and GH1=1.584,0.001523,GH2=3.797,0.002257 are Generalized Hopf (Bautin) bifurcation points. All other parameter values except parameters ρ and α are taken from Table 1
Fig. 2
Fig. 2
Bifurcation diagrams of component V of equilibria of the model with respect to parameter α for different values of parameter ρ, where α=0.3179 corresponding to R0=1. SN(on SNC) corresponds to saddle node bifurcation, H(on HBC1), H¯ and H¯¯(on HBC2) express Hopf bifurcation where the subscripts super and sub represent that the Hopf bifurcation is supercritical and subcritical, respectively. The dashed and solid curves represent E0 and E, where the red curve expresses stable equilibrium and the blue curve shows unstable one
Fig. 3
Fig. 3
a, b Bifurcation diagrams of the periodic orbit generated by the Hopf bifurcation point Hsub and H¯super in Fig. 2e. cf are the phase diagrams and solution trajectories of model (1) when α=0.00162 in (a) and α=0.069 in (b), respectively. The red and blue curves represent stable and unstable periodic orbits respectively
Fig. 4
Fig. 4
Dynamics of CD4+ T cells (mm-1) over the days. Simulation results are compared with clinical data. Blue and red points correspond to before and after treatment clinical data, while solid blue and red curves denote fitting results before and after treatment, respectively
Fig. 5
Fig. 5
Sensitivity tests of uninfected CD4+ T cells (T) and viruses (V) to all parameters in model (9). The specific values of PRCCs could be observed from Table 5
Fig. 6
Fig. 6
Bifurcation diagrams of components T and V of the equilibria with respect to parameter ϵ. The threshold value ϵ=0.437 corresponds to R0=1. The dashed and solid curves represent E0 and E1 respectively, where the red curves express the stable equilibrium and the blue curves show the unstable one. Other parameter values are taken from Table 4 (Patient01)

References

    1. Archin NM, Liberty AL, Kashuba AD et al (2012) Administration of vorinostat disrupts HIV-1 latency in patients on antiretroviral therapy. Nature 487(7408):482–485. 10.1038/nature11286 - DOI - PMC - PubMed
    1. Castillo-Chavez C, Song B (2004) Dynamical models of tuberculosis and their applications. Math Biosci Eng 1(2):361–404. 10.3934/mbe.2004.1.361 - DOI - PubMed
    1. Catalfamo M, Wilhelm C, Tcheung L et al (2011) CD4 and CD8 T cell immune activation during chronic HIV infection: roles of homeostasis, HIV, type I IFN, and IL-7. J Immunol 186(4):2106–2116. 10.4049/jimmunol.1002000 - DOI - PMC - PubMed
    1. Chomont N, El-Far M, Ancuta P et al (2009) HIV reservoir size and persistence are driven by T cell survival and homeostatic proliferation. Nat Med 15(8):893–900. 10.1038/nm.1972 - DOI - PMC - PubMed
    1. Chun TW, Carruth L, Finzi D et al (1997) Quantification of latent tissue reservoirs and total body viral load in HIV-1 infection. Nature 387(6629):183–188. 10.1038/387183a0 - DOI - PubMed

MeSH terms

Substances