. 2025 Mar 2;82(1):98.
doi: 10.1007/s00018-025-05625-9.

Cell-type-specific requirement for TYK2 in murine immune cells under steady state and challenged conditions

Affiliations

Cell-type-specific requirement for TYK2 in murine immune cells under steady state and challenged conditions

Anzhelika Karjalainen et al. Cell Mol Life Sci. .

Abstract

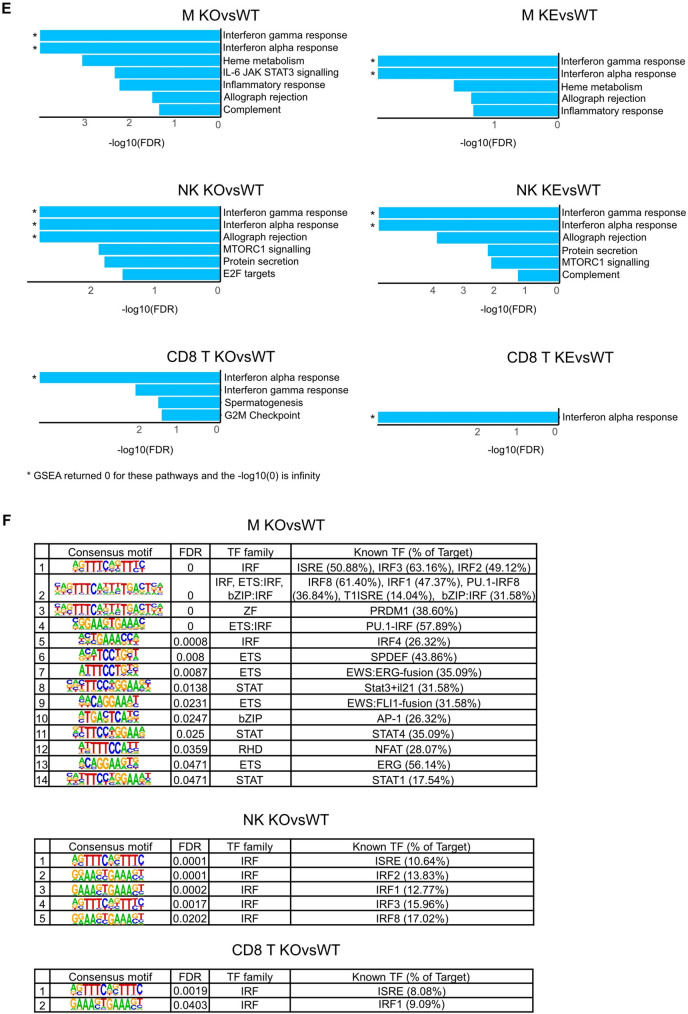
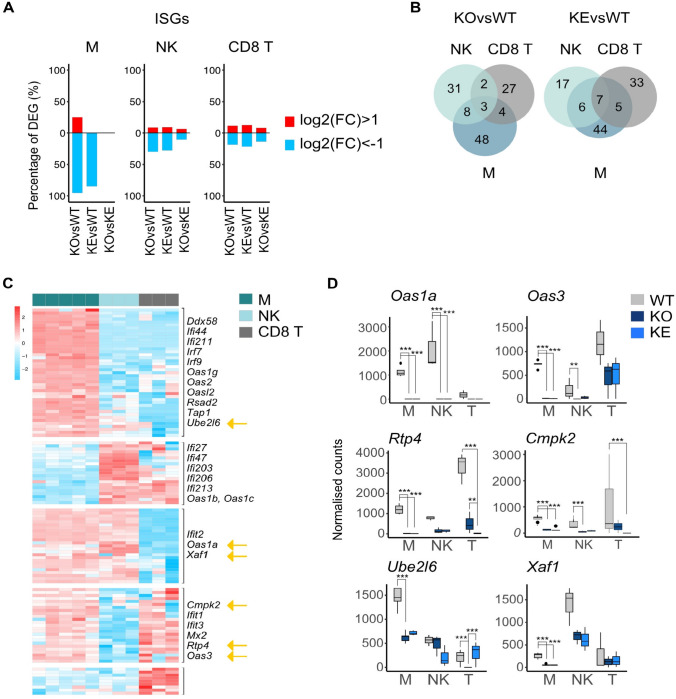
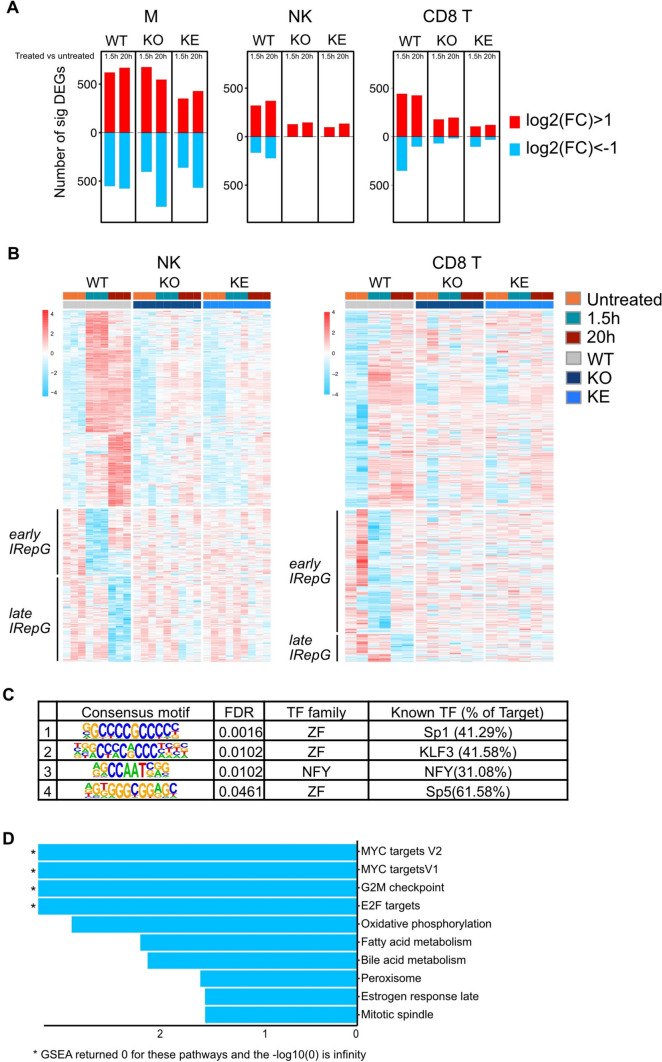
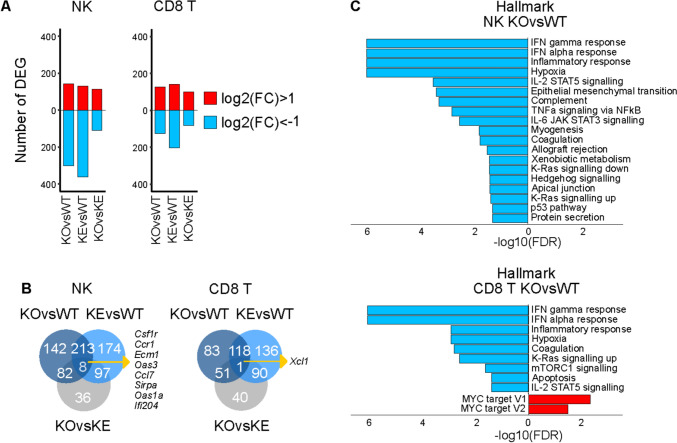
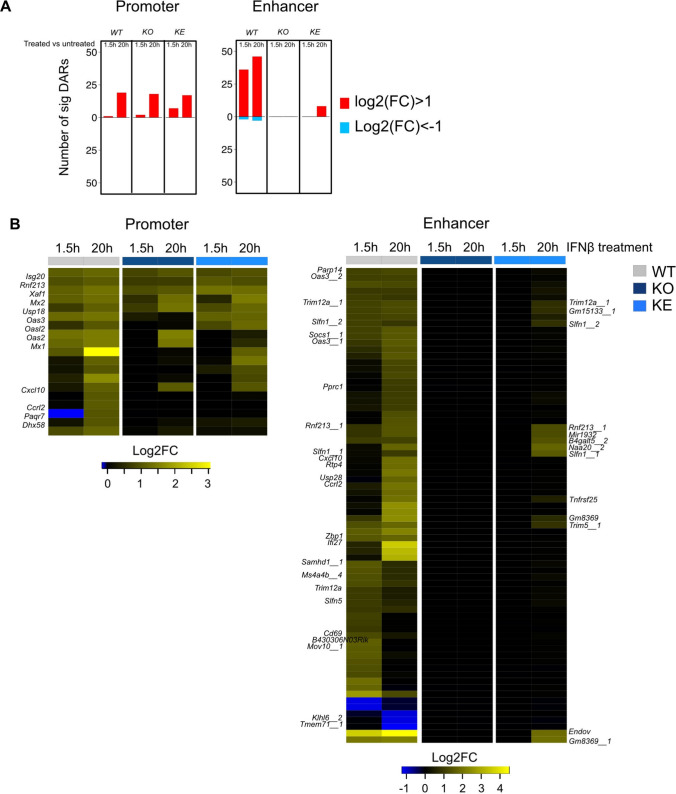
Tyrosine kinase 2 (TYK2) deficiency and loss or inhibition of kinase activity in men and mice leads to similar immune compromised phenotypes, predominantly through impairment of interferon (IFN) and interleukin 12 family responses. Here we relate the transcriptome changes to phenotypical changes observed in TYK2-deficient (Tyk2-/-) and TYK2 kinase-inactive (Tyk2K923E) mice in naïve splenic immune cells and upon ex vivo IFN treatment or in vivo tumor transplant infiltration. The TYK2 activities under homeostatic and both challenged conditions are highly cell-type-specific with respect to quantity and quality of transcriptionally dependent genes. The major impact of loss of TYK2 protein or kinase activity in splenic homeostatic macrophages, NK and CD8+ T cells and tumor-derived cytolytic cells is on IFN responses. While reportedly TYK2 deficiency leads to partial impairment of IFN-I responses, we identified cell-type-specific IFN-I-repressed gene sets completely dependent on TYK2 kinase activity. Reported kinase-inactive functions of TYK2 relate to signaling crosstalk, metabolic functions and cell differentiation or maturation. None of these phenotypes relates to respective enriched gene sets in the TYK2 kinase-inactive cell types. Nonetheless, the scaffolding functions of TYK2 are capable to change transcriptional activities at single gene levels and chromatin accessibility at promoter-distal regions upon cytokine treatment most prominently in CD8+ T cells. The cell-type-specific transcriptomic and epigenetic effects of TYK2 shed new light on the biology of this JAK family member and are relevant for current and future treatment of autoimmune and inflammatory diseases with TYK2 inhibitors.

Keywords: CD8+ T cells; Interferon; JAK-STAT; Macrophages; NK cells; Splenic immune cells; Tonic signaling; Tumor-infiltrating cells.


Conflict of interest statement

Declarations. Conflict of interests: The authors have no relevant financial or non-financial interests to disclose. Ethical Approval: All mice used in this study were bred at the University of Veterinary Medicine Vienna under specific-pathogen-free conditions according to Federation of European Laboratory Animal Science Associations (FELASA) guidelines. All experiments were performed in accordance with the European Union 2010/63 EU directive and the Austrian Federal Ministry of Science and Research according to §§ 26ff animal experimentation law. All animal experiments were approved by the Ethics and Animal Welfare Committee of the University of Veterinary Medicine Vienna Animal Experiments Act, Tierversuchsgesetz 2012—TVG 2012 (BMBWF_GZ:2020–0.200.397, approval 27.03.2020; BMWFW-68.205/0068-WF/V/3b/2015, approval 17.04.2015; BMWFW-68.205/0103-WF/V/3b/2015, approval 19.06.2015; BMBWF-68.205/0174-V/3b/2018, approval 09.10.2018) and conform to the guidelines of FELASA and ARRIVE (Animal Research: Reporting of In Vivo Experiments). Consent to Participate: Not applicable. Consent to Publish: All authors reviewed their respective results contributions and contributed to the final manuscript. All authors approved this manuscript for publication.

Figures

Fig. 1
Fig. 1
Experimental setup and transcriptional profiles of splenic macrophages, NK cells and CD8+ T cells upon loss of TYK2 or its kinase activity. A Scheme of experimental design with genetically modified mice (WT, wild type mice; KO, Tyk2−/− mice; KE, Tyk2K923E mice), collection of cells (M, macrophages; NK, natural killer cells; CD8 T, CD8+ T cells), treatments, next generation sequencing and computational analysis. B Number of significantly (|FC|> 2 or absolute log2(FC) > 1, FDR < 0.05) differentially expressed genes (DEG) determined by DESeq2 in the indicated genotype comparisons; upregulated (red) and downregulated (blue). C Heat map with scaled mRNA expression values (log2 cpm, counts per million) of DEG patterns (1–6). D Venn diagrams of genotype comparisons and cell type-specific DEG. E Highly represented pathways identified by gene set enrichment analysis (GSEA) against MSigDB v7.2 Hallmark pathways. False discovery rates (FDR) are indicated. *GSEA returned 0 and -log10(0) is infinity. F Hypergeometric Optimization of Motif EnRichment (HOMER) cis-regulatory motif discovery of TYK2-dependent DEG; FDR, transcription factor (TF) family and members and the percent of genes with the enriched motifs are indicated
Fig. 1
Fig. 1
Experimental setup and transcriptional profiles of splenic macrophages, NK cells and CD8+ T cells upon loss of TYK2 or its kinase activity. A Scheme of experimental design with genetically modified mice (WT, wild type mice; KO, Tyk2−/− mice; KE, Tyk2K923E mice), collection of cells (M, macrophages; NK, natural killer cells; CD8 T, CD8+ T cells), treatments, next generation sequencing and computational analysis. B Number of significantly (|FC|> 2 or absolute log2(FC) > 1, FDR < 0.05) differentially expressed genes (DEG) determined by DESeq2 in the indicated genotype comparisons; upregulated (red) and downregulated (blue). C Heat map with scaled mRNA expression values (log2 cpm, counts per million) of DEG patterns (1–6). D Venn diagrams of genotype comparisons and cell type-specific DEG. E Highly represented pathways identified by gene set enrichment analysis (GSEA) against MSigDB v7.2 Hallmark pathways. False discovery rates (FDR) are indicated. *GSEA returned 0 and -log10(0) is infinity. F Hypergeometric Optimization of Motif EnRichment (HOMER) cis-regulatory motif discovery of TYK2-dependent DEG; FDR, transcription factor (TF) family and members and the percent of genes with the enriched motifs are indicated
Fig. 2
Fig. 2
TYK2-dependent IFN signatures in splenic immune cells under steady state condition. A Percentage of IFN-stimulated genes (ISG), up- (red) or downregulated (blue) among DEG (|FC|> 2 or absolute log2(FC) > 1, FDR < 0.05). B Venn diagrams of genotype comparisons and cell type-specific DE ISG. C Heat map with scaled mRNA expression values (log2 cpm, counts per million) of DE ISG of WT macrophages, NK and CD8+ T cells, ‘robust’ ISG [50] named, arrows indicate ISG in (D). D Number of DESeq2 basemean reads aligned to ISG, mean and standard deviation are shown, *p < 0.05, ** p < 0.01, *** p < 0.001
Fig. 3
Fig. 3
Expression levels of JAK-STAT signaling constituents under steady state conditions. A Scaled mRNA expression values of selected JAK-STAT signaling genes. B Number of DESeq2 basemean reads aligned to selected JAK-STAT signaling genes, mean and standard deviation are shown. C mRNA levels of selected of JAK-STAT signaling genes in NK and CD8+ T cells measured by RT-qPCR and shown as relative expression compared to the indicated housekeeping gene and given as mean ± SD. One-way ANOVA with Tukey multiple comparison, *p < 0.05, ** p < 0.01, *** p < 0.001
Fig. 4
Fig. 4
Transcriptional and functional profiles of splenic NK cells. A Scaled mRNA expression values of selected effector genes (log2 cpm, counts per million); A/I, activating/inhibitory; genotype patterns of DEG (1 and 2) are indicated. B CXCR3 cell surface expression of splenic NK cells of naïve mice analyzed by flow cytometry. Mean percentages ± SEM of CXCR3+ cells out of CD3ε-NK1.1+ cells from two independent experiments are shown; n = 12 for pooled experiments per genotype. *** p < 0.001. C Scaled mRNA expression values of leading genes in the mTORC1 signaling Hallmark. D Agilent Seahorse XF Cell Mito Stress Test of NK cells. NK cell representative oxygen consumption rate (OCR) curves are shown. Injections of oligomycin, FCCP, and rotenone + antimycin A are indicated by grey lines. NK cell ATP production and basal respiration were calculated for WT, Tyk2−/− and Tyk2K923E cells (n = 5) and are given as relative values compared to WT (100%). Two-way ANOVA with Tukey multiple comparison was used to assess statistical significance, *p ≤ 0.05
Fig. 5
Fig. 5
TYK2-dependent cytotoxicity of CD8+ T cells. A SIINFEKL peptide non-reactive (dashed line) or SIINFEKL peptide reactive (continuous line) T cells were co-cultured with CFSE-stained, OVA-expressing EG7 target cells at indicated effector:target ratios (30:1, 15:1, 5:1, 1:1) and after 16 h specific lysis was assessed by flow cytometry. Mean values ± SEM of technical replicates from one representative out of two independent experiments are shown. B WT, Tyk2−/− and Tyk2K923E mice were immunised with mTRP-2/CPG and after 7 days challenged with syngeneic splenocytes pulsed with mTRP2 peptide (CFSEhigh), pulsed with unspecific peptide (CFSEmid) or left unpulsed (CSFElow) at a 1:1:1 ratio. The specific killing was analysed in lymph node cell suspensions after 18 h by flow cytometry. Mean values ± SEM of technical replicates from one representative out of three independent experiments are shown; n = 5 per group. * p < 0.05, *** p < 0.001, **** p < 0.0001
Fig. 6
Fig. 6
IFNβ treatments of in vitro cultured macrophages, NK and CD8+ T cells. A Number of significantly DE genes (|FC|> 2, FDR < 0.05) that are either upregulated (red) or downregulated (blue) at the indicated treatment time points as compared to untreated controls. B Scaled mRNA expression values of IFNβ-upregulated or repressed genes (log2 cpm, counts per million) in NK and CD8+ T cells after 1.5 h or 20 h treatment. C Hypergeometric Optimization of Motif EnRichment (HOMER) cis-regulatory motif discovery of IFNβ-repressed genes (1.5 h and 20 h IFNβ treatment combined) from NK and CD8+ T cells; FDR, transcription factor (TF) family and members and the percent of genes with the enriched motifs are indicated. D Gene set enrichment analysis (GSEA) of IFNβ-repressed genes in NK cells after 20 h treatment
Fig. 7
Fig. 7
Transcriptomes of tumor-infiltrating Tyk2-deficient NK and CD8+ T cells. A Number of significantly (|FC|> 2 or absolute log2(FC) > 1, FDR < 0.05) differentially expressed (DE) genes determined by DESeq2 in the indicated genotype comparisons; upregulated (red) and downregulated (blue). B Venn diagrams of genotype comparisons of DEG in NK and CD8+ T cells. C Gene set enrichment analysis (GSEA) of NK or CD8+ T cells DEG from indicated comparisons; positive normalized enrichment scores (NES) (red) and negative NES (blue)
Fig. 8
Fig. 8
Chromatin accessibility of IFNβ-treated CD8+ T cells. A Number of significantly (|FC|> 2 or absolute log2(FC) > 1, FDR < 0.05) differentially accessible (DA) regions within promoter regions (± 200 bp from TSS) or proximal enhancer regions (± 3000 > bp < 200 bp from TSS) determined by DESeq2 in the indicated genotype comparisons; more accessible (red) and less accessible (blue). B Heatmap of log2(FC) of significantly DA regions in WT CD8+ T cells within promoter or enhancer regions

References

    1. Wöss K, Simonović N, Strobl B, Macho-Maschler S, Müller M (2019) TYK2: an upstream kinase of STATs in cancer. Cancers (Basel) 11:1728. 10.3390/cancers11111728 - PMC - PubMed
    1. Boisson-Dupuis S, Ramirez-Alejo N, Li Z, Patin E, Rao G, Kerner G, Lim CK, Krementsov DN, Hernandez N, Ma CS, Zhang Q, Markle J, Martinez-Barricarte R, Payne K, Fisch R, Deswarte C, Halpern J, Bouaziz M, Mulwa J, Sivanesan D, Lazarov T, Naves R, Garcia P, Itan Y, Boisson B, Checchi A, Jabot-Hanin F, Cobat A, Guennoun A, Jackson CC, Pekcan S, Caliskaner Z, Inostroza J, Costa-Carvalho BT, de Albuquerque JAT, Garcia-Ortiz H, Orozco L, Ozcelik T, Abid A, Rhorfi IA, Souhi H, Amrani HN, Zegmout A, Geissmann F, Michnick SW, Muller-Fleckenstein I, Fleckenstein B, Puel A, Ciancanelli MJ, Marr N, Abolhassani H, Balcells ME, Condino-Neto A, Strickler A, Abarca K, Teuscher C, Ochs HD, Reisli I, Sayar EH, El-Baghdadi J, Bustamante J, Hammarström L, Tangye SG, Pellegrini S, Quintana-Murci L, Abel L, Casanova JL (2018) Tuberculosis and impaired IL-23-dependent IFN-γ immunity in humans homozygous for a common TYK2 missense variant. Sci Immunol 3:eaau8714. 10.1126/sciimmunol.aau8714 - PMC - PubMed
    1. Gorman JA, Hundhausen C, Kinsman M, Arkatkar T, Allenspach EJ, Clough C, West SE, Thomas K, Eken A, Khim S, Hale M, Oukka M, Jackson SW, Cerosaletti K, Buckner JH, Rawlings DJ (2019) The TYK2-P1104A autoimmune protective variant limits coordinate signals required to generate specialized T cell subsets. Front Immunol 10:44. 10.3389/fimmu.2019.00044 - PMC - PubMed
    1. Kreins AY, Ciancanelli MJ, Okada S, Kong XF, Ramírez-Alejo N, Kilic SS, El Baghdadi J, Nonoyama S, Mahdaviani SA, Ailal F, Bousfiha A, Mansouri D, Nievas E, Ma CS, Rao G, Bernasconi A, Sun Kuehn H, Niemela J, Stoddard J, Deveau P, Cobat A, El Azbaoui S, Sabri A, Lim CK, Sundin M, Avery DT, Halwani R, Grant AV, Boisson B, Bogunovic D, Itan Y, Moncada-Velez M, Martinez-Barricarte R, Migaud M, Deswarte C, Alsina L, Kotlarz D, Klein C, Muller-Fleckenstein I, Fleckenstein B, Cormier-Daire V, Rose-John S, Picard C, Hammarstrom L, Puel A, Al-Muhsen S, Abel L, Chaussabel D, Rosenzweig SD, Minegishi Y, Tangye SG, Bustamante J, Casanova JL, Boisson-Dupuis S (2015) Human TYK2 deficiency: Mycobacterial and viral infections without hyper-IgE syndrome. J Exp Med 212:1641–1662. 10.1084/jem.20140280 - PMC - PubMed
    1. Li Z, Gakovic M, Ragimbeau J, Eloranta ML, Rönnblom L, Michel F, Pellegrini S (2013) Two rare disease-associated Tyk2 variants are catalytically impaired but signaling competent. J Immunol 190:2335–2344. 10.4049/jimmunol.1203118 - PubMed

LinkOut - more resources