. 2025 Apr;37(14):e2419253.
doi: 10.1002/adma.202419253. Epub 2025 Mar 3.

Kinetically Dormant Ni-Rich Layered Cathode During High-Voltage Operation

Affiliations

Kinetically Dormant Ni-Rich Layered Cathode During High-Voltage Operation

Jiyu Cai et al. Adv Mater. 2025 Apr.

Abstract

The degradation of Ni-rich cathodes during long-term operation at high voltage has garnered significant attention from both academia and industry. Despite many post-mortem qualitative structural analyses, precise quantification of their individual and coupling contributions to the overall capacity degradation remains challenging. Here, by leveraging multiscale synchrotron X-ray probes, electron microscopy, and post-galvanostatic intermittent titration technique, the thermodynamically irreversible and kinetically reversible capacity loss is successfully deconvoluted in a polycrystalline LiNi0.83Mn0.1Co0.07O2 cathode during long-term charge/discharge cycling in full cell configuration. Contradicting the dramatic capacity loss, the layered structure remains highly alive even after 1000 cycles at 4.6 V while undergoing a three-order of magnitude reduction in the mass transfer kinetics, leading to almost fully recoverable capacity under kinetic-free conditions. Such kinetic dormant behavior after cycling is not simply ascribed to poor chemical diffusion by reconstructed cathode surface but highly synchronizes with the lattice strain evolution stemming from the structural heterogeneity between deeply delithiated layered and degraded rock-salt phases at high voltage. These findings deepen the degradation mechanism of high-voltage cathodes to achieve long-cycling and fast-charging performance.

Keywords: degradation; high voltage; kinetics; lattice strain; nickel‐rich layered cathodes; quantification; thermodynamics.


Conflict of interest statement

The authors declare no conflict of interest.

Figures

Figure 1
Figure 1
Long‐Term Cycling of the Model Full Cells and the Observed Issues on the Cathode and Anode as Commonly Reported. a) Electrochemical evaluations of Ni83 at 4.2, 4.4, and 4.6 V in full cells against graphite anode for two formation cycles at C/10, 1000 testing cycles at 1C, and 10 post‐test cycles at C/10. High‐resolution STEM images and selected area FFT patterns compare the local surface structure on b) pristine Ni83 cathode and c) aged Ni83 cathode after 1000 cycles at 4.6 V, showing the exacerbated surface reconstruction of rock‐salt structure during high voltage operation. The comparison of surface and interior structure between pristine material and cycled cathodes at different voltages is shown in Figure S5 (Supporting Information). e) Soft XAS Ni L‐edge spectra in TEY and TFY channels for surface and bulk information in pristine and cycled cathodes at various upper voltages, respectively. The reference spectra of Ni2+, Ni3+, and Ni4+ are provided to reveal the Ni valence state change at the utmost surface. XRF color maps of graphite electrode surfaces with quantitative analysis of migrated transition metals in the full cells coupled with Ni83 cathode at f) 4.2 V, g) 4.4 V, and h) 4.6 V.
Figure 2
Figure 2
Inconsistency between Electrochemical Evaluation and Bulk‐Type Post‐Mortem Diagnoses of the Harvested Cathodes in Full Cells. The discharging profiles of full cells using Ni83 cathodes at a) 4.2 V, b) 4.4 V, and c) 4.6 V in the formation cycle at C/10, long‐term cycling of 5th, 500th, and 1000th cycles at 1C and post‐test cycle at C/10, as well as the half cells of pristine and harvested cathodes at C/10. The cathode at higher voltage suffers more severe capacity fading. d) Synchrotron‐based ex situ HE‐XRD characterizations exhibit good, layered structure without significant rock‐salt or spinel phase in all cycled Ni83 cathodes at various upper voltages after 1000 cycles, compared with pristine Ni83 cathode. The X‐ray wavelength is 0.1173 Å. e) XANES and f) EXAFS spectra of Ni K‐edge to reveal the slight evolutions of valence states and radical distances in all cycled Ni83 cathodes at various upper voltages. The Co and Mn spectra are shown in Figure S9 (Supporting Information). g) The cross‐sectional SEM images in a large view of multiple Ni83 particles at 4.6 V after 1000 cycles (see pristine and cycled cathodes at 4.2 and 4.4 V in Figure S10, Supporting Information). Inlet: zoom‐in view showing some narrow intergranular cracks throughout the entire particle. No significant particle fracture for the isolation of active material is seen at 4.6 V after 1000 cycles.
Figure 3
Figure 3
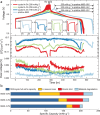
Performance Deconvolution to Unveil the Critical Contribution of Kinetic Limits. a) GITT profiles of Ni83ǀǀLi half cells using pristine Ni83 cathode and the cycled Ni83 cathodes after 1000 cycles in full cells in different voltage windows, as well as the comparison of their discharge capacity. Inlet images show their single iteration of the current pulse and relaxation processes. b) A quantitative reference of the deterioration contribution of Li reservoir loss, kinetic limits, or material degradation, individually, in Ni83 cathodes in different voltage windows after 1000 cycles. The contribution from kinetic limits is defined as the capacity gap between the constant‐current tests and the GITT tests of the same harvested cathode half cells. The contribution from material degradation is determined by the capacity gap in GITT tests between the harvested cathode and the pristine cathode. Li reservoir loss is assumed as the capacity gap between the 1010th‐cycle full cells and the first‐cycle harvested cathode half cells at the same current rate of C/10, representing the Li vacancy existing in cathode material for the incomplete re‐lithiation at the lower end of SOC.
Figure 4
Figure 4
Key Insights from Mass‐Transfer Kinetic Characteristics toward Phase Transitions in Cycled Ni‐Rich Cathode. a) Electrochemical cycling of Ni83 cathode at 4.6 V in full cells for 100, 300, 500, and 1000 cycles at 1C, followed by 3 cycles at C/10. b) Cycling‐evolutions of the quantitative kinetic reversible loss and thermodynamically irreversible loss in harvested Ni83 cathodes at three upper voltages. c) The reversible capacity losses in all harvested Ni83 cathodes show a strong dependence on the kinetic deterioration at H2‐H3 transition at high voltage. The 1st, 100th, 300th, 500th, and 1000th‐cycle evolutions of d–f) voltage‐dependent chemical diffusion of Li+, g–i)thermodynamic “equilibrium” phase transitions derived from GITT relaxation steps under “kinetic‐free” circumstance, and j–l) kinetic‐limited phase transitions from galvanostatic cycling tests at C/10 in Ni83 cathodes at a) 4.2 V (see raw data in Figure S11, Supporting Information), b) 4.4 V (Figure S12, Supporting Information), and c) 4.6 V, respectively. In diffusion plots, solid symbols represent the charging process and hollow symbols for the discharging process.
Figure 5
Figure 5
Severe Kinetic Inhibition at High SOCs in Affiliation to Structural Heterogeneity with Transformed Rock‐Salt Structure in Surface Layer. The comparison of voltage gains in the GITT pulse steps at a) low SOC of 3.8 V and b) high SOC of 4.3 V as a function of the square root of time in the pristine Ni83 cathode and the cycled Ni83 cathode at 4.6 V for 1000 cycles. c) The derived surface‐independent coefficients of chemical diffusion using the linear voltage gain (Et0) and the overall mass transfer kinetics using the total voltage gain (Et0+Et * ). d) The chemical diffusion coefficient of bulk cathode material, including the rock‐salt surface layer and the “core” layered structure, is analytically calculated as a function of the rock‐salt layer thickness using the experimentally determined diffusion coefficients (4 × 10⁻¹¹ cm2 s−1 for NiO structure[ 24 ] vs 3.9 × 10⁻⁸ cm2 s−1 for layered structure from GITT test of pristine cathode), respectively. The inlet schematically shows this analytical model of Li diffusion in cathode primary particle of 100 nm radius with a CEI layer (including rock‐salt phase) at the surface. e) The diagrams of layered structure transition in the delithiation process and the rock‐salt structure illustrate two major structural discrepancies of large mismatch strain perpendicular to layer planes and the layer plane shift due to changing stacking order in H2‐H3 transition at high SOC region. f) Synchrotron‐based in‐situ XRD of pristine Ni83 cathode in 1st cycle. g) The evolution of lattice constant c and a via Rietveld refinements. h) The correlation plots of voltage‐dependent mismatch strain of rock‐salt and layered structures, the “equilibrium” phase transition in GITT‐dQdV, and the non‐linear voltage gain (Et * ) standing for the energy barrier of mass‐transfer kinetics.

References

    1. a) Han Y. K., Heng S., Wang Y., Qu Q. T., Zheng H. H., ACS Energy Lett. 2020, 5, 2421;
    2. b) Schmuch R., Wagner R., Horpel G., Placke T., Winter M., Nat. Energy 2018, 3, 267;
    3. c) Hu Y., Yu Y., Huang K., Wang L., J. Energy Storage 2020, 27, 101111.
    1. a) Li W. D., Asl H. Y., Xie Q., Manthiram A., J. Am. Chem. Soc. 2019, 141, 5097; - PubMed
    2. b) Li H. Y., Liu A. R., Zhang N., Wang Y. Q., Yin S., Wu H. H., Dahn J. R., Chem. Mater. 2019, 31, 7574;
    3. c) Yan P., Zheng J., Gu M., Xiao J., Zhang J.‐G., Wang C.‐M., Nat. Commun. 2017, 8, 14101; - PMC - PubMed
    4. d) Lin F., Markus I. M., Nordlund D., Weng T.‐C., Asta M. D., Xin H. L., Doeff M. M., Nat. Commun. 2014, 5, 3529. - PubMed
    1. a) Xu G. L., Liu Q., Lau K. K. S., Liu Y., Liu X., Gao H., Zhou X. W., Zhuang M. H., Ren Y., Li J. D., Shao M. H., Ouyang M. G., Pan F., Chen Z. H., Amine K., Chen G. H., Nat. Energy 2019, 4, 484;
    2. b) Zhao C., Wang C. W., Liu X., Hwang I., Li T. Y., Zhou X. W., Diao J. C., Deng J. J., Qin Y., Yang Z. Z., Wang G. Y., Xu W. Q., Sun C. J., Wu L. L., Cha W., Robinson I., Harder R., Jiang Y., Bicer T., Li J. T., Lu W. Q., Li L. X., Liu Y. Z., Sun S. G., Xu G. L., Amine K., Nat. Energy 2024, 9, 345;
    3. c) Cai M. Z., Dong Y. H., Xie M., Dong W. J., Dong C. L., Dai P., Zhang H., Wang X., Sun X. Z., Zhang S. N., Yoon M., Xu H. W., Ge Y. S., Li J., Huang F. Q., Nat. Energy 2023, 8, 159.
    1. a) Sun H. H., Kim U.‐H., Park J.‐H., Park S.‐W., Seo D.‐H., Heller A., Mullins C. B., Yoon C. S., Sun Y.‐K., Nat. Commun. 2021, 12, 6552; - PMC - PubMed
    2. b) Kim U. H., Park G. T., Son B. K., Nam G. W., Liu J., Kuo L. Y., Kaghazchi P., Yoon C. S., Sun Y. K., Nat. Energy 2020, 5, 860.
    1. a) Tan S., Shadike Z., Li J. Z., Wang X. L., Yang Y., Lin R. Q., Cresce A., Hu J. T., Hunt A., Waluyo I., Ma L., Monaco F., Cloetens P., Xiao J., Liu Y. J., Yang X. Q., Xu K., Hu E. Y., Nat. Energy 2022, 7, 484;
    2. b) Xue W. J., Huang M. J., Li Y. T., Zhu Y. G., Gao R., Xiao X. H., Zhang W. X., Li S. P., Xu G. Y., Yu Y., Li P., Lopez J., Yu D. W., Dong Y. H., Fan W. W., Shi Z., Xiong R., Sun C. J., Hwang I., Lee W. K., Shao‐Horn Y., Johnson J. A., Li J., Nat. Energy 2021, 6, 495.