. 2025 Mar 3;135(5):e186291.
doi: 10.1172/JCI186291.

Endothelial OX40 activation facilitates tumor cell escape from T cell surveillance through S1P/YAP-mediated angiogenesis

Affiliations

Endothelial OX40 activation facilitates tumor cell escape from T cell surveillance through S1P/YAP-mediated angiogenesis

Baoyu He et al. J Clin Invest. .

Abstract

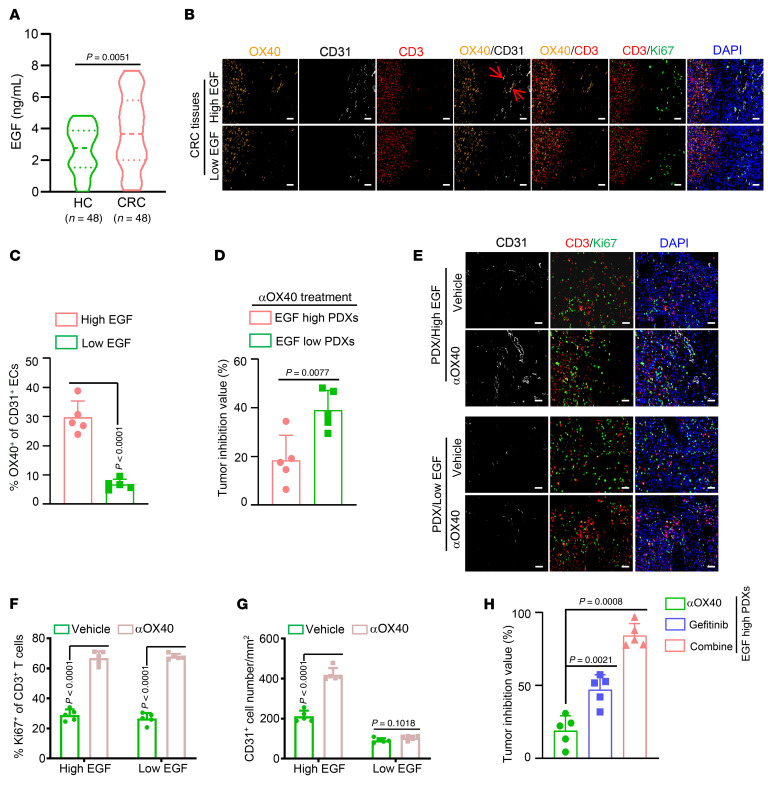
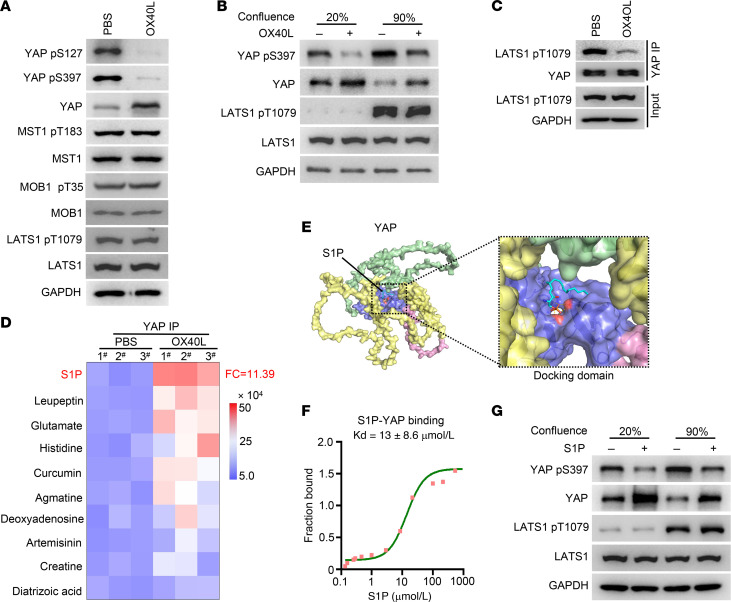
Understanding the complexity of the tumor microenvironment is vital for improving immunotherapy outcomes. Here, we report that the T cell costimulatory molecule OX40 was highly expressed in tumor endothelial cells (ECs) and was negatively associated with the prognosis of patients, which is irrelevant to T cell activation. Analysis of conditional OX40 loss- and gain-of-function transgenic mice showed that OX40 signal in ECs counteracted the antitumor effects produced in T cells by promoting angiogenesis. Mechanistically, leucine-rich repeat-containing GPCR5 (Lgr5+ ) cancer stem cells induced OX40 expression in tumor ECs via EGF/STAT3 signaling. Activated OX40 interacted with Spns lysolipid transporter 2 (Spns2), obstructing the export of sphingosine 1-phosphate (S1P) and resulting in S1P intracellular accumulation. Increased S1P directly bound to Yes 1-associated protein (YAP), disrupting its interaction with large tumor suppressor kinase 1 (LATS1) and promoting YAP nuclear translocation. Finally, the YAP inhibitor verteporfin enhanced the antitumor effects of the OX40 agonist. Together, these findings reveal an unexpected protumor role of OX40 in ECs, highlighting the effect of nonimmune cell compartments on immunotherapy.

Keywords: Cancer immunotherapy; Endothelial cells; Immunology; Oncology.


Conflict of interest statement

Conflict of interest: The authors declare that no conflict of interest exists.

Figures

Figure 1
Figure 1. OX40 activation promotes tumor growth and metastasis in T cell–immunocompromised mice.
(A and B) Images (left) and volume (right) of subcutaneous tumors established using MC38 cells treated with mouse OX40L protein (OX40L; 200 mg/mouse, i.p.) or anti–mouse OX40 agonistic antibody (αOX40; 100 μg/mouse, i.p.) in BALB/c nude mice (A) and NSG mice (B) (n = 8). (CE) Bioluminescent intensity (C), metastatic nodules in the liver (D), and survival of mice (E) from the colon orthotopic metastasis model established using MC38 cells treated with mouse OX40L protein (OX40L; 200 mg/mouse, i.p.) or anti–mouse OX40 agonistic antibody (αOX40; 100 μg/mouse, i.p.) in NSG mice (n = 6). (FH) Bioluminescent intensity (F), metastatic nodules in the lung (G), and survival of mice (H) from the pulmonary metastasis model established using MC38 cells treated with mouse OX40L protein (OX40L; 200 mg/mouse, i.p.) or anti–mouse OX40 agonistic antibody (αOX40; 100 μg/mouse, i.p.) in NSG mice (n = 6). (I) Anti–mouse CD3 antibody (200 μg/mouse, i.p.) was applied to deplete T cells in C57BL/6J mice. Then, CD3+ T cells were measured by flow cytometric analysis in CD45+ single-cell suspensions sorted from subcutaneous tumors in CD3+ T cell–depleted mice and IgG control mice (n = 3). (J) Images (left) and volume (right) of subcutaneous tumors established using MC38 cells treated with vehicle or anti–mouse OX40 agonistic antibody (αOX40; 100 μg/mouse, i.p.) in IgG mice and CD3+ T cell–depleted mice (n = 8). Two-way ANOVA (A, B, and J), 1-way ANOVA (C, D, F, G, and I), or log-rank test (E and H) was used for statistical analysis. Lg ROI, log10 region of interest.
Figure 2
Figure 2. Confirmation of high expression of OX40 specifically in tumor ECs and the protumor effects.
(A) OX40 gene expression in various cell subpopulations of CRC and NT tissues using scRNA-Seq data (n = 5). FC, fold change. (B) Proportion of OX40 and OX40+ ECs in CRC and NT tissues (n = 5). (C) Representative images of multicolor immunofluorescence using anti-OX40 (green) and anti-CD31 (red) antibodies in CRC and NT tissues (n = 162). Scale bars: 30 μm. (D) Analysis of the OX40+ EC percentages in CRC and NT tissues. The data were obtained from a tissue microarray, which included 162 pairs of CRC and NT tissues. (E) OX40 expression in sorted CD31+ cells from CRC and NT tissues (n = 3). (F) First, 162 CRCs were divided into 2 groups based on the median values of Ki67+ percentages in CD3+ T cells: CD3+Ki67 and CD3+Ki67+. Further, these 2 groups were divided into 4 parts based on the median values of OX40+ percentages in ECs: CD3+Ki67;CD31+OX40 (n = 41), CD3+Ki67;CD31+OX40+ (n = 40), CD3+Ki67+;CD31+OX40 (n = 41), and CD3+Ki67+;CD31+OX40+ (n = 40). Kaplan-Meier analysis of the overall survival probability of patients in the 4 groups was performed. (GJ) C57BL/6J mice with conditional knockin (Ox40ki/ki;Cd31cre/–) or knockout (Ox40fl/fl;Cd31cre/–) of OX40 in ECs were established using the CRISPR/Cas9 method. Subcutaneous tumors (G and I) and splenic injection for the liver metastasis model (H and J) were constructed in these mice using MC38 cells and treated with recombinant mouse OX40L (n = 5 or 10). In H and J, the red arrows indicate the implanted primary tumor in the spleen, and the white arrows indicate metastatic tumor lesions. Two-tailed Student’s t test (D and E), log-rank test (F), 2-way ANOVA (G and I), or 1-way ANOVA (H and J) was used for statistical analysis.
Figure 3
Figure 3. Cancer stem cell–derived EGF triggers OX40 expression in ECs.
(A) Five pairs of shredded CRC and corresponding NT tissues suspended in basic medium were placed in the upper chamber of a 24-well Transwell system with polycarbonate filters. Thereafter, HUVECs were seeded in the bottom layer grown for 48 hours. Then, OX40 expression in HUVECs was measured by quantitative real-time PCR (qRT-PCR) (n = 3). (BD) OX40 expression was measured in HUVECs treated with media derived from the indicated cells using qRT-PCR (n = 3). (E) HUVECs were treated with indicated media for 48 hours and then subjected to reverse chromatin immunoprecipitation analyses. The heatmap displays potential transcription factors that interact with OX40 promoter. (F) HUVECs were first treated with media derived from Lgr5 and Lgr5+ SW480 cells and then exposed to DMSO or the STAT3 inhibitor Stattic (10 μM). OX40 expression was evaluated in HUVECs by qRT-PCR (n = 3). (G) Luciferase activity of the OX40 promoter in HUVECs treated with DMSO or the STAT3 inhibitor Stattic (n = 3). (H and I) Expression of 70 angiogenesis-associated cytokines was evaluated in tumor epithelial cells (Epi) (H) and Lgr5+ tumor epithelial cells (I) compared with their corresponding controls using scRNA-Seq data. (J) EGF levels were measured in media derived from the indicated cells using enzyme-linked immunosorbent assay (n = 3). (K) OX40 expression was evaluated in HUVECs treated with vehicle or exogenous EGF using qRT-PCR (n = 3). (L) First, scrambled NC (siNC) or siRNAs against EGF were transfected into Lgr5+ SW480 cells for 72 hours. Then, HUVECs were exposed to media derived from these cells. OX40 expression was evaluated in HUVECs using qRT-PCR (n = 3). One-way ANOVA (A, C, F, and JL) or 2-tailed Student’s t test (D and G) was used for statistical analysis.
Figure 4
Figure 4. Serum EGF serves as a biomarker for predicting the efficacy of OX40 agonists.
(A) EGF levels were measured in sera from patients with CRC and healthy control participants (HC) (n = 48). (B and C) The CRC patients were divided into 2 groups based on the median value of serum EGF levels: the EGF-low group and the EGF-high group. (B) Representative images of multicolor immunofluorescence using anti-OX40 (orange), anti-CD31 (white), anti-CD3 (red), and anti-Ki67 (green) antibodies in tumor tissues of CRC patients with high or low serum EGF levels (n = 5). Scale bars: 50 μm. (C) Statistical analysis of OX40+ EC percentages in tumor tissues of indicated CRC patients (n = 5). (D) Tumor inhibition values of anti-human αOX40 treatment (20 μg/mouse, i.p.) for PDX tumors derived from CRC patients with high or low serum EGF levels in BALB/c nude mice (n = 5). (E) Representative images of multicolor immunofluorescence using anti-CD3, anti-CD31, and anti-OX40 antibodies in PDX tumors from CRC patients with high or low serum EGF levels (n = 5). Scale bars: 50 μm. (F and G) Statistical analysis of Ki67+ T cell percentages (F) and vascular density (G; n = 5). (H) Tumor inhibition values of anti-human αOX40 (20 μg/mouse, i.p.), gefitinib (80 mg/kg, oral gavage), or their combination for PDX tumors from CRC patients with high serum EGF levels (n = 5). One-way ANOVA (A, C, D, F, and G) or 2-tailed Student’s t test (H) was used for statistical analysis.
Figure 5
Figure 5. OX40 signal exerts protumor effects by promoting YAP nuclear translocation.
(A) Tumor cell medium–stimulated HUVECs were treated with PBS or OX40L protein (100 ng/mL) for 48 hours and then subjected to transcriptome sequencing. Enriched pathways were pooled using differentially expressed genes after OX40L treatment (left). The heatmap displays the expression of genes associated with endothelial-mesenchymal transition (right). (B and C) Genes encoding mesenchymal markers and adhesive molecules were evaluated in OX40 or OX40+ tumor ECs using scRNA-Seq data. (D) PBS- or OX40L-treated HUVECs were fractionated into cytoplasmic (Cyto) and nuclear (Nuc) fractions and subjected to protein mass spectrometry. (E) PBS- or OX40L-treated HUVECs were immunostained with YAP antibody. Scale bars: 5 μm. (F and G) Expression of YAP downstream genes was measured in sorted CD31+ cells from CRC and NT tissues by qRT-PCR (F, n = 3) and in OX40 and OX40+ ECs from CRC tissues using scRNA-Seq data (G, n = 5). (H) Representative images of CRC tissues immunostained using the indicated antibodies. The white boxes indicate OX40+ or OX40 ECs (n = 162). Scale bar: 5 μm. (I) YAP+ percentages in OX40 ECs and OX40+ ECs from tumor tissues (n = 162). (J) Subcutaneous tumors were established in mice with conditional knockin of OX40 in ECs or in control mice. The mice were treated with verteporfin for 3 weeks (n = 10). (KM) Subcutaneous tumor and pulmonary metastasis models were established using MC38 cells in BALB/c nude mice. The mice were treated with OX40L or a combination of mouse OX40L protein and verteporfin. (K) Tumor volume (n = 8). (L and M) Metastatic nodules in the lung (L) and mouse survival (M) (n = 6). Two-tailed Student’s t test (F and I), 2-way ANOVA (J and K), 1-way ANOVA (L), or log-rank test (M) was used for statistical analysis.
Figure 6
Figure 6. OX40 signal impacts YAP protein stability through modulating S1P-YAP interaction.
(A) HUVECs were treated with PBS or human OX40L protein (100 ng/mL) for 48 hours. The cell lysates were immunoblotted using the indicated antibodies. (B) HUVECs were cultured at 20% or 90% confluence. The cells were treated with PBS or human OX40L protein (100 ng/mL) for 48 hours and subjected to immunoblotting using the indicated antibodies. (C) HUVECs were treated with PBS or human OX40L (100 ng/mL) for 48 hours. Cell lysates were immunoprecipitated using an anti-YAP antibody, followed by blotting with the indicated antibodies. (D) HUVECs were treated with PBS or human OX40L protein (100 ng/mL) for 48 hours. Cell lysates were immunoprecipitated using an anti-YAP antibody. Metabolites in the immunocomplexes were extracted. The quantitative abundance of metabolites was measured using a trace-level metabolite detection method based on liquid chromatography–mass spectrometry (LC-MS) (n = 3). (E) Docking model of S1P and YAP. The full-length YAP structure was predicted using AlphaFold. Surface presentation of the YAP complex with S1P (cyan) bound to its central cavity. (F) Analysis of S1P binding to the purified YAP protein using the in vitro microscale thermophoresis binding assay. (G) HUVECs were cultured at 20% or 90% confluence. The cells were then treated with PBS or S1P (10 μM) for 48 hours and subjected to immunoblotting using the indicated antibodies.
Figure 7
Figure 7. S1P disrupts the interaction between YAP and the p-LATS1 kinase.
(A) HUVECs treated with DMSO or S1P (10 μM) were immunostained with an anti-YAP antibody. Scale bars: 5 μm. (B) Expression of YAP downstream genes was evaluated in HUVECs treated with DMSO or S1P using qRT-PCR (n = 3). (C) Subcutaneous tumor models were established using MC38 cells in BALB/c nude mice. The mice were treated with S1P (5 mg/kg, i.p.) or a combination of S1P and verteporfin (n = 8). (D) DMSO- or S1P-treated HUVECs were immunoprecipitated using an anti-YAP antibody followed by blotting with the indicated antibodies. (E) Docking models of YAP–p-LATS1 and YAP-S1P. (F) HUVECs were grown to 10%, 30%, 60%, or 90% confluence. Cell lysates were immunoprecipitated using an anti-YAP antibody. p-LATS1 expression was measured using Western blot analysis in total cell lysates. Metabolites in the immunocomplex were extracted. The quantitative abundance of S1P was measured using an LC-MS–based trace-level metabolite detection method (n = 3). (G) HUVECs were grown to 90% confluence. Then, the cells were treated with DMSO or S1P at the indicated concentrations and subjected to immunoprecipitation using IgG or anti-YAP antibodies. Cells at 20% confluence were used as a control. (H) HUVECs were cultured with S1P-free fetal bovine serum. The cells were transfected with scrambled siRNA (siNC) or mixed siRNAs against SPHK1 and SPHK2. Cell lysates were immunoprecipitated with an anti-YAP antibody and blotted with the indicated antibodies. (I) A diagram summarizing the proposed model in which OX40 activation or accumulated S1P disrupts the YAP and p-LATS1 interaction, leading to increased YAP stability, augmented YAP-TEAD4 interaction, and, ultimately, transactive capacity. Two-tailed Student’s t test (B) or 2-way ANOVA (C) was used for statistical analysis.
Figure 8
Figure 8. OX40 signal induces S1P accumulation via interaction with Spns2.
(A) Tumor cell medium–stimulated HUVECs were treated with PBS or OX40L protein (100 ng/mL) for 48 hours. Cells were harvested and metabolites were extracted. Metabolite abundance was determined using an untargeted metabolomic test (n = 3). Heatmaps displayed the top 20 differential metabolites (10 upregulated and 10 downregulated). (B) Quantitative abundance of S1P was measured in HUVECs treated with PBS or OX40L protein at the indicated concentrations for 48 hours (n = 3). (C) HUVECs were treated with vehicle, OX40L protein, or OX40L plus siRNAs against Spns2, S1PL, SGPP1, or SPHK1/2. The quantitative abundance of intracellular S1P was measured (n = 3). (D) HUVECs were treated with vehicle, human OX40L protein (100 ng/mL), or OX40L plus siRNAs against Spns2, S1PL, SGPP1, or SPHK1/2. The cells were then subjected to immunoblotting using the indicated antibodies. (E) HUVECs were treated with vehicle, human OX40L protein (100 ng/mL), OX40L plus multiple siRNAs against S1PL, SGPP1, and SPHK1/2 together, or OX40L plus multiple siRNAs against Spns2, S1PL, SGPP1, and SPHK1/2 together. The quantitative abundances of intracellular (left) and extracellular (right) S1P were measured (n = 3). (F) HUVECs were treated with vehicle or human OX40L protein (100 ng/mL) for 48 hours. Cell lysates were immunoprecipitated using an anti-OX40 antibody, followed by blotting with the indicated antibodies. (G) HUVECs were treated with vehicle or OX40L protein for 48 hours. Cell lysates were immunoprecipitated using an anti-Spns2 antibody. Metabolites in the immunocomplex were extracted. The quantitative abundance of S1P was measured using an LC-MS–based trace-level metabolite detection method (n = 3). (H) Different docking models of S1P and Spns2. One-way ANOVA (B, C, and E) or 2-tailed Student’s t test (G) was used for statistical analysis.
Figure 9
Figure 9. The combination of verteporfin and OX40 agonist synergistically leads to tumor repression in PDX tumors.
(A and B) Subcutaneous xenograft tumors established using 3 CRC patient–derived xenografts (PDXs) in BALB/c nude mice were treated with anti-human αOX40 (20 μg/mouse, i.p.), verteporfin (60 mg/kg, i.p.), or a combination of both (A; n = 6 or 7 mice per cohort). Tumor inhibition values for αOX40, verteporfin, and drug combinations were calculated and compared (B). (CE) Subcutaneous tumors generated from CRC PDX-1 were immunostained using anti-CD31 (white), anti-CD3 (red), and anti-Ki67 (green) antibodies. (C) Representative images of multicolor immunofluorescence (n = 5). Scale bars: 50 μm. (D and E) Quantification of Ki67+ T cell percentages (D) and vascular density (E) (n = 5). Two-way ANOVA (A) or 1-way ANOVA (B, D, and E) was used for statistical analysis.
Figure 10
Figure 10. The synergistic effects of the OX40 agonist and verteporfin were superior to the OX40 agonist and PD-1 antibody combination.
(A and B) Subcutaneous tumors established using MC38, ID8, or GL261 cells in C57BL/6J mice were treated with anti-mouse αOX40 (100 μg/mouse, i.p.), anti–mouse PD-1 antibody (αPD-1; 200 μg/mouse, i.p.), verteporfin (60 mg/kg, i.p.), αOX40 plus αPD-1, or αOX40 plus verteporfin (A; n = 8 mice per cohort). Tumor inhibition values for αOX40, αPD-1, verteporfin, and drug combinations were calculated and compared (B). (CE) Subcutaneous tumors generated from MC38 cells were immunostained using anti-CD31 (white), anti-CD3 (red), and anti-Ki67 (green) antibodies. (C) Representative images of multicolor immunofluorescence staining (n = 5). Scale bars: 50 μm. (D and E) Quantification of Ki67+ T cell percentages (D) and vascular density (E) (n = 5). Two-way ANOVA (A) or 1-way ANOVA (B, D, and E) was used for statistical analysis.

References

    1. McLaughlin M, et al. Inflammatory microenvironment remodelling by tumour cells after radiotherapy. Nat Rev Cancer. 2020;20(4):203–217. doi: 10.1038/s41568-020-0246-1. - DOI - PubMed
    1. Togashi Y, et al. Regulatory T cells in cancer immunosuppression — implications for anticancer therapy. Nat Rev Clin Oncol. 2019;16(6):356–371. doi: 10.1038/s41571-019-0175-7. - DOI - PubMed
    1. Fan Y, et al. Epithelial SOX9 drives progression and metastases of gastric adenocarcinoma by promoting immunosuppressive tumour microenvironment. Gut. 2023;72(4):624–637. doi: 10.1136/gutjnl-2021-326581. - DOI - PubMed
    1. Barker HE, et al. The tumour microenvironment after radiotherapy: mechanisms of resistance and recurrence. Nat Rev Cancer. 2015;15(7):409–425. doi: 10.1038/nrc3958. - DOI - PMC - PubMed
    1. Ho WJ, et al. The tumour microenvironment in pancreatic cancer — clinical challenges and opportunities. Nat Rev Clin Oncol. 2020;17(9):527–540. doi: 10.1038/s41571-020-0363-5. - DOI - PMC - PubMed

MeSH terms