. 2025 Feb 28;15(9):6708-6717.
doi: 10.1039/d4ra08191a. eCollection 2025 Feb 26.

Selective dual-mode detection of reactive oxygen species and metal ions by chemodosimetric vs. chelation pathways: fluorescence 'turn-on' with OCl- and Zn2+/Mn2+, employing theoretical, practical, and bioimaging applications

Affiliations

Selective dual-mode detection of reactive oxygen species and metal ions by chemodosimetric vs. chelation pathways: fluorescence 'turn-on' with OCl- and Zn2+/Mn2+, employing theoretical, practical, and bioimaging applications

Malavika S Kumar et al. RSC Adv. .

Abstract

An indole-coupled diaminomaleonitrile-based fluorescent chemosensor IMA has been designed and developed for the selective detection of ROS (OCl-) and metal ions Zn2+ and Mn2+ via chemodosimetric and chelation pathways respectively. The selective sensing of OCl- is induced by a method of oxidatively cleaving of the imine bond of IMA, forming free indole aldehyde, which results in a 21-fold enhancement of fluorescence at 521 nm, with a detection limit of 2.8 µM. On the other hand, the selective binding of IMA with Zn2+ and Mn2+ results in chelation-induced enhanced fluorescence (CHEF) and increased intermolecular charge transfer (ICT), leading to a 4-fold and 3-fold fluorescence enhancement at 432 nm and 435 nm, with the detection limits of 12.71 µM and 17.34 µM, respectively. UV-vis spectroscopy, fluorescence, DFT study, mass spectra, 1H-NMR analysis, and Job's plot analysis have been used to validate the sensing mechanism of IMA with OCl-, Zn2+, and Mn2+. For practical applications, the binding of IMA with OCl- has been utilized in the detection of commercial samples like bleaching powder and water analysis. Bio-imaging studies were conducted with IMA in the presence of OCl- and Zn2+ using green gram seeds in a physiological medium.


Conflict of interest statement

There are no conflicts of interest to declare.

Figures

Scheme 1
Scheme 1. (a) Ethanol, acetic acid, r.t., 48 h.
Fig. 1
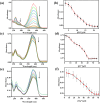
Fig. 1. (a), (c) and (e) Absorption titration spectra of IMA (c = 20 µM) in presence of OCl (0–24 µM), Zn2+ (0–57 µM), and Mn2+ (0–72 µM), respectively (c = 200 µM). (b), (d) and (f) Variation of absorbance as a function of OCl, Zn2+ and Mn2+ concentration respectively at 378 nm with error bars (error amount, 5%; Y error bar for both [±] deviation).
Fig. 2
Fig. 2. (a) Fluorescence titration experiment of IMA (c = 20 µM) in presence of OCl (c = 200 µM) (0–40 µM). Inset: changes of emission colour in absence and presence OCl under UV light irradiation. (b) Variation of fluorescence as a function of [OCl] with error bars (error amount, 5%; Y error bar for both [±] deviation).
Fig. 3
Fig. 3. (a) and (c) Fluorescence titration experiment of IMA (c = 20 µM) with Zn2+ (0–95 µM), and Mn2+ (0–95 µM) respectively (c = 200 µM). Inset: changes of emission colours in absence and presence of Zn2+ and Mn2+ respectively under UV light irradiation. (b) and (d) Binding isotherm for variation of emission intensity with Zn2+ and Mn2+ concentration respectively (error amount, 5%; Y error bar for both [±] deviation).
Fig. 4
Fig. 4. (a) Emission color changes of IMA in presence of various anions under UV light irradiation. (b) Interference fluorescence spectra of IMA (c = 20 µM) with various interfering anions (15 equiv.) (λex = 378 nm). (c) Fluorescence responses of IMA in bar representation with different anions.
Fig. 5
Fig. 5. (a) Emission color changes of IMA in presence of various metal ions under UV light irradiation. (b) Interference fluorescence spectra of IMA (c = 20 µM) with various interfering cations (15 equiv.) (λex = 378 nm). (c) Fluorescence response of IMA in bar representation with different cations.
Scheme 2
Scheme 2. Probable pathway for sensing of OCl and Mn+ (Zn2+, Mn2+) by IMA.
Scheme 3
Scheme 3. Proposed mechanism of OCl detection by IMA.
Fig. 6
Fig. 6. (a) Fluorescence study of IMA (c = 20 µM) with bleaching powder solution (c = 200 µM) (0–25 µM) and (b) corresponding changes of emission intensity as a function of [OCl].
Fig. 7
Fig. 7. Bar graph of emission intensity of IMA in different water solution without (green bars) and with (maroon bars) OCl treatment.
Fig. 8
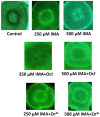
Fig. 8. The epi-fluorescent microscopy images (490–570 nm green illumination filter) of sections of gram seed roots under low power (10×) magnification at different experimental conditions. Top panel: control (with 0.1% DMSO), 250 µM and 500 µM of IMA. Middle panel: 250 µM and 500 µM of IMA + 100 µM NaOCl, bottom panel: 250 µM and 500 µM of IMA + 100 µM Zn2+.
Fig. 9
Fig. 9. Geometry optimized molecular structures of (a) IMA and (b) IMA–Zn complex. (c) IMA–Mn complex.
Fig. 10
Fig. 10. Frontier molecular orbital with energy difference of IMA, IMA–Zn complex and IMA–Mn complex.

References

    1. Wu J. Liu W. Ge J. Zhang H. Wang P. Chem. Soc. Rev. 2011;40:3483–3495. - PubMed
    1. Wu S.-P. Du K.-J. Sung Y.-M. Dalton Trans. 2010;39:4363–4368. - PubMed
    1. Vajpayee V. Song Y. H. Jung Y. J. Kang S. C. Kim H. Kim I. S. Wang M. Cook T. R. Stang P. J. Chi K.-W. Dalton Trans. 2012;41:3046–3052. - PMC - PubMed
    1. Jiang Y. Zheng G. Duan Q. Yang L. Zhang J. Zhang H. He J. Sun H. Ho D. Chem. Commun. 2018;54:7967–7970. - PubMed
    1. Ji R. Qin K. Liu A. Zhu Y. Ge Y. Tetrahedron Lett. 2018;59:2372–2375.

LinkOut - more resources