[Preprint]. 2025 Sep 22:2025.02.16.638529.
doi: 10.1101/2025.02.16.638529.

Mitochondrially Transcribed dsRNA Mediates Manganese-induced Neuroinflammation

Affiliations

Mitochondrially Transcribed dsRNA Mediates Manganese-induced Neuroinflammation

Avanti Gokhale et al. bioRxiv. .

Abstract

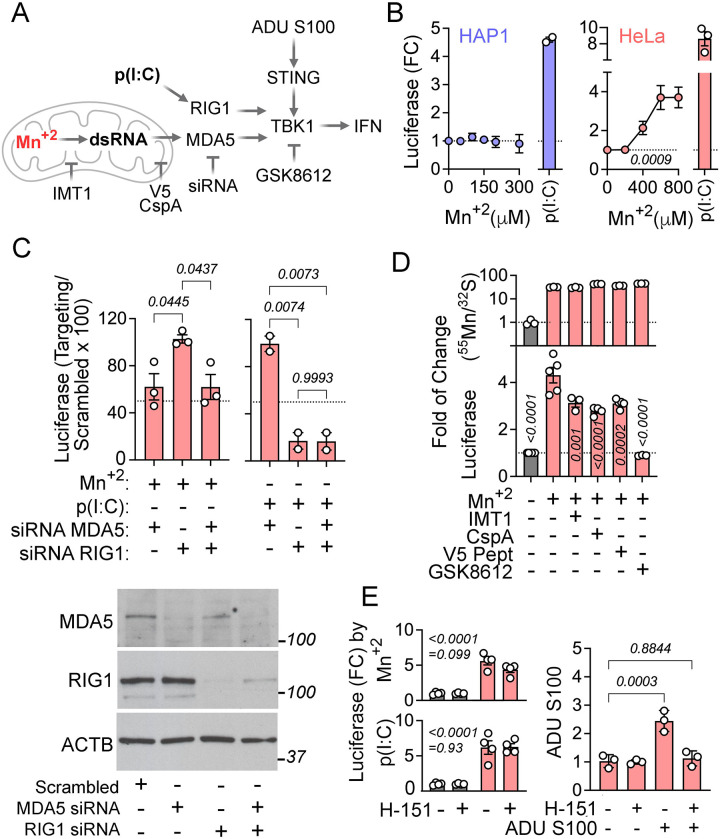
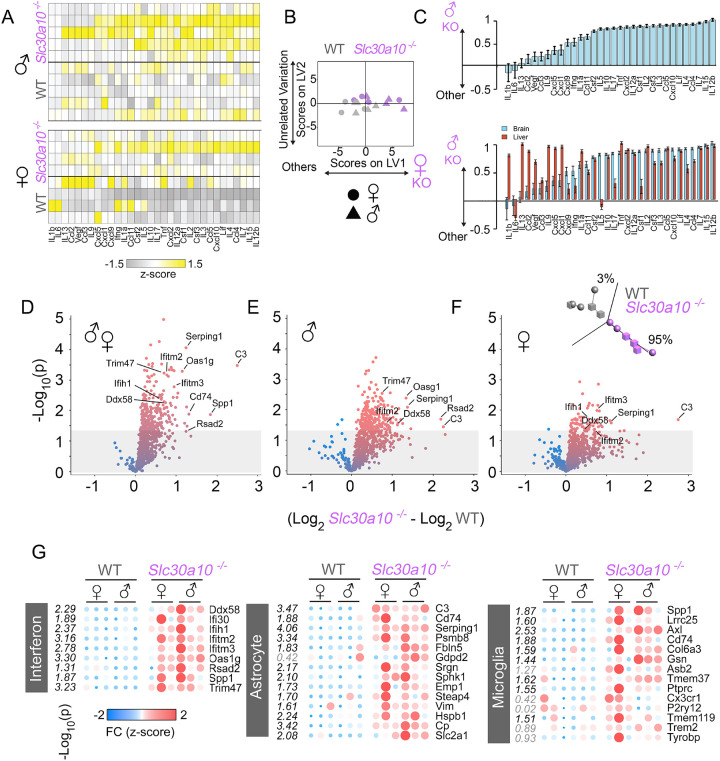
Manganese (Mn) is an essential trace element required for various biological functions, but excessive Mn levels are neurotoxic and lead to significant health concerns. The mechanisms underlying Mn-induced neurotoxicity remain poorly understood. Neuropathological studies of affected brain regions reveal astrogliosis, and neuronal loss, along with evidence of neuroinflammation. Here, we present a novel Mn-dependent mechanism linking mitochondrial dysfunction to neuroinflammation. We found that Mn disrupts mitochondrial transcriptome processing, resulting in the accumulation of complementary RNAs that form double-stranded RNA (dsRNA). This dsRNA is released to the cytoplasm, where it activates cytosolic sensor pathways, triggering type I interferon responses and inflammatory cytokine production. This mechanism is evident in 100-day human cerebral organoids, where Mn-induced inflammatory responses are observed predominantly in mature astrocytes. Similar effects were observed in the transcriptome and cytokine profile of female and male mouse brains carrying mutations in the SLC30A10 gene, a model of hypermanganesemia with dystonia1 disorder. These findings highlight a previously unrecognized role for mitochondrial dsRNA in Mn-induced neuroinflammation and provide insights into the molecular pathogenesis of manganism. We propose that this mitochondrial dsRNA-induced inflammatory pathway could be active in other diseases caused by environmental or genetic factors.

Keywords: astrocyte; dsRNA; interferon; manganese.


Conflict of interest statement

Competing interests The authors report no competing interests.

Figures

Figure 1:
Figure 1:. Manganese induces the accumulation of noncoding mitochondrial RNA sequences and mitochondrial dsRNA.
A) Heatmaps of log2 CLTC normalized NanoString counts of RNA hybridized with probes targeted to non-coding sequences in the light strand transcripts and for nuclear encoded mitochondrial proteins as control. RNA was isolated from four replicate samples of either wild-type HAP1 or HeLa treated either in the absence or presence of manganese (300μM and 800μM, respectively) for 24h, or untreated wild-type and SLC30A10 null HAP1 cells. Numbers in italics represent −log10 p values (t-test followed by Benjamini-Hochberg FDR correction, q). B) Manganese treatment and SLC30A10 deficiency similarly alter the MitoString transcriptome. Linear and non-linear data reduction by principal component analysis (PCA) and Uniform Manifold Approximation and Projection (UMAP), respectively of all the RNA counts measured by the MitoString panel. Lines connecting PCA represent Euclidean distances. C)Top Panel: Manganese was measured by ICP-MS at 24h post treatment in cell pellets of at least 3 independent experiments represented by different symbols, in brain cortex punch biopsies and liver of 8 weeks old wild type (WT) and Slc30a10−/− (KO) 3 female (◯) and 3 male (□) mice. No sex differences were noted following two-way ANOVA test. Bottom Panel: Fold of change in metal content normalized by phosphate of HAP1 or HeLa cells treated in the absence or presence of manganese as in (a), were data from two experiments are combined and in wild type (WT) and Slc30a10−/− (KO) mouse cortex and liver. One-way ANOVA followed by Šídák’s multiple comparisons test. D) Immunofluorescence detection of dsRNA and the mitochondrial RNA granule component, GSRF1, in HAP1 and HeLa cells treated either in the absence or presence of manganese. E) Quantification of dsRNA overlapping with GRSF1 in cells treated either in the absence or presence manganese, the POLMRT inhibitor IMT1 (1μM), or with dsRNA specific RNAse III before addition of the dsRNA J2 antibody. Dotted lines represent the average intensity of cells treated in the absence or presence manganese. One-way ANOVA followed by Šídák’s multiple comparisons tests.
Figure 2:
Figure 2:. Manganese-induced dsRNA upregulates interferon β transcription.
A) Diagram summarizing the pathway activated by manganese effects in mitochondria leading to IFNβ transcription. Depicted are the components targeted by inhibitors and the pathway agonists, poly (I:C) and ADU S100. Created with elements of Biorender.com. B) Interferon β promoter luciferase reporter activity measured in either HAP1 or HeLa cells following 24h treatment with the indicated manganese dose. For positive control 10μg/ml of high molecular weight poly (I:C) was added. Average ± SEM of 3 experiments. One-way ANOVA followed by Dunnett’s multiple comparisons test. Dotted line marks luciferase activity in the absence of manganese. C) Interferon β promoter luciferase reporter activity measured in HeLa cells transfected with non-targeting and targeting siRNAs followed by 24h treatment with 800μM manganese or 10 μg/ml poly (I:C). Data are depicted as percentage of signal in scrambled sequence siRNA transfected cells. Average ± SEM of 3 experiments. Dotted line marks 50% reduction. One-way ANOVA followed by Tukey’s multiple comparisons test. Bottom panel depicts western blots of protein level downregulation following siRNA transfections. D) Top panel depicts manganese content determined by ICP-MS in HeLa cells incubated with 800μM manganese with and without the indicated inhibitor, identical conditions as employed for the bottom panel experiments. Bottom panel shows luciferase activity measured in HeLa cells following 24h treatment with the indicated manganese dose. For positive control, 10μg/ml of poly (I:C) were added. Average ± SEM of 5 experiments. Two-way ANOVA followed by Bonferroni’s multiple comparisons test. E) Luciferase activity measured in HeLa cells following 24h treatment with 800μM manganese (top left panel) or 10μg/ml poly(I:C) (bottom left panel) in the presence or absence of the Sting inhibitor H-151. Right panel shows 0.5μM H-151 inhibition of luciferase induction by transfection of 1μM ADU S100 Sting agonist. Average± SE. Two-way ANOVA followed by Bonferroni’s multiple comparisons test. Top numbers show manganese effect, bottom number show drug effect.
Figure 3:
Figure 3:. Manganese upregulates inflammatory cytokine secretion.
A) Inflammatory cytokine antibody array probed with media conditioned for 48h collected from treated HeLa cells without or with 750μM manganese. B) Densitometry quantification of positive spots in the array blots shown in (a) and Supplementary Fig. 3A. C) IL-8 cytokine levels measured by ELISA in 48h conditioned media collected from HeLa cells treated without or with the indicated manganese concentration. Average ± SEM of 3 experiments. One-way ANOVA followed by Dunnett’s multiple comparisons test. D) IL-8 cytokine levels measured by ELISA in 48h conditioned media collected from HeLa cells treated without or with 800μM manganese and the indicated inhibitor. Average ± SEM of 4 experiments. One-way ANOVA followed by Dunnett’s multiple comparisons test. E) Cell survival of HeLa cells exposed to increased concentrations of manganese with and without the indicated inhibitor. Average ± SEM of 3–4 experiments. Two-way ANOVA followed by Bonferroni’s multiple comparisons test.
Figure 4:
Figure 4:. Manganese alters mitochondrial transcripts and induces the interferon type I response in human cerebral organoids.
A) Lineage marker expression measured by NanoString over developmental time. Average ± SEM of 4 organoids per time point. One-way ANOVA followed by Dunnett’s multiple comparisons test. B) Heatmap of RNA levels of organoid differentiation markers and nuclear encoded mitochondrial transcripts measured by NanoString in individual organoids over time of development. Log2 of normalized counts of the gene were used for the heatmap. C) Heatmap of nuclear and mitochondrial encoded mitochondrial transcripts measured by NanoString in individual organoids over time of development. The difference of normalized counts from manganese-induced minus non-treated organoids per time point is expressed as Log2. Non-responsive organelles at 30 days were compared to responses in 100-day organelles. Two-tailed t-test expressed as −Log10. D) Volcano plot of the genes in the Neuroinflammatory panel that change expression in the transcriptome of 100-day organoids following 48h of 250μM manganese treatment. Significance threshold was set at 0.05 (marked by the line). E) Heatmap of IRF3 or NFκB transcriptional target genes and interferon stimulated genes included in the Neuroinflammatory panel (d) that change following manganese exposure. Two-tailed t-test expressed as −Log10. F) Cytokines in conditioned media collected from 100-day organoids following mock or 48h treatment with 250μM manganese. IL6, IL8 and beta 2 microglobulin levels were determined by MesoScale assay. Average ± SEM. Each dot represents an individual organoid. Data from two organoid batches. Statistics for beta 2 microglobulin paired t test and for IL6 and IL8 Wilcoxon matched-pairs signed rank test. For B, C and E symbol size is proportional to the Log2 value in between rows. Data available in Supplementary Information Dataset S1 and S2.
Figure 5:
Figure 5:. Single cell RNAseq analysis of manganese treated 100-day cerebral organoids.
A) UMAP embedding of all samples (12 organoids aged 100 days) integrated and normalized with SCT transform. Cells are colored by cluster assignment. B) Proportion of cells assigned to each cluster from individual organoids. Color scheme is the same as in A). C) Dot plot of cell identity marker and inflammatory gene expression in cell clusters shown in A) (Supplementary Information Dataset S4). Dot size is proportional to percentage of cells expressing the gene and color reflects average expression level. D) Volcano plot of the manganese differentially regulated genes in astrocytes (Supplementary Information Dataset S5). Cut off is p<0.05 and 0.5< average log2FC <−0.5. Highlighted genes belong to the categories identified by gene enrichment analysis (e) or describing astrocyte function. E) Main up and down regulated pathways in manganese treated astrocytes when comparing the genes curated in Molecular Signatures Database employing EnrichR tool for gene ontology analysis (Supplementary Information Dataset S6). Triangles are up-regulated genes. Circles are downregulated genes. F) Heatmap of the scaled gene counts in the astrocyte cluster for individual organoids (Supplementary Information Dataset S7). G) Feature plot depicting the cells expressing CXCL8 and CXCL10 in control and manganese treated organoids. H) UMAP embedding of the subclustered astrocyte population from all organoids. J) Differential expression of genes belonging to the interferon response, mitochondrial transcripts and RNA processing in the three astrocytes subclusters in response to manganese (Supplementary Information Dataset S8). K) Immunofluorescence for dsRNA in manganese treated 100-day organoids and in iPSC derived astrocytes. 1) 100-day organoids stained for GFAP (red), DNA (blue) and dsRNA (green). Scale bar= 25μm. 2) Quantification of the percentage of GFAP cells that were positive for dsRNA in (1) and dsRNA in mitochondria in iPSC derived astrocytes shown in (3).1.9x refers to fold of increase, Mann Whitney test 3) Human astrocytes derived from iPSC treated or not with 250μM Manganese for 24h and stained for dsRNA (green) and the mitochondrial marker TOM20 (red). Scale bar =10μm.
Fig 6:
Fig 6:. Cortex from a mouse model of hypermanganesemia with dystonia 1 disorder has increased pro-inflammatory cytokines.
A) Heat map of z-scored cytokine levels measured by Luminex multiplex assays in cortex samples of wild type and Slc30a10−/− male and female mice. The cytokines are named by gene name. B) A discriminant partial least squares regression model constructed from the cytokine dataset regressed genotype. The model identifies a latent variable (LV1) that scores animals based on cytokine protein expression measurements and predicts genotype. LV2 describes variation that is not connected to genotype. LV1 and LV2 account for approximately 44% and 4% of the dataset variation, respectively. C) Top panel: LV1 is composed of cytokines that are elevated and able to predict the KO genotype in a leave-one-out cross validation in male mice samples (mean ± SD across LV1 generated for all models in the cross validation). Bottom panel: Comparison of LV1s from cortex and liver (in supplementary information) from Slc30a10−/− male animals. D) Volcano plots of TBP normalized NanoString counts of RNA isolated from brain of a cohort of 6 wild type and 6 Slc30a10−/− female and male mice, hybridized with probes targeted to neuroinflammatory gene sequences (Supplementary Information Dataset S9). E) Volcano plots of TBP normalized NanoString counts of RNA isolated from brain of a cohort of 3 wild type and 3 Slc30a10−/− male mice. F) Volcano plots of TBP normalized NanoString counts of RNA isolated from brain of a cohort of 3 wild type and 3 Slc30a10−/− female mice. Insert: Linear near data reduction by principal component analysis (PCA) of all the RNA counts measured by the neuroinflammatory panel separates the samples of both sexes by genotype. G) Heatmaps of interferon stimulated genes, genes expressed in astrocytes or in microglia, included in the Neuroinflammatory panel that change significantly following manganese exposure (Supplementary Information Dataset 9). Two-tailed t-test expressed as −Log10.

References

    1. Balachandran RC, Mukhopadhyay S, McBride D, et al. Brain manganese and the balance between essential roles and neurotoxicity. J Biol Chem. May 8 2020;295(19):6312–6329. doi: 10.1074/jbc.REV119.009453 - DOI - PMC - PubMed
    1. Peres TV, Schettinger MR, Chen P, et al. “Manganese-induced neurotoxicity: a review of its behavioral consequences and neuroprotective strategies”. BMC Pharmacol Toxicol. Nov 4 2016;17(1):57. doi: 10.1186/s40360-016-0099-0 - DOI - PMC - PubMed
    1. Lucas EL, Bertrand P, Guazzetti S, et al. Impact of ferromanganese alloy plants on household dust manganese levels: implications for childhood exposure. Environ Res. Apr 2015;138:279–90. doi: 10.1016/j.envres.2015.01.019 - DOI - PMC - PubMed
    1. Kornblith ES, Casey SL, Lobdell DT, Colledge MA, Bowler RM. Environmental exposure to manganese in air: Tremor, motor and cognitive symptom profiles. Neurotoxicology. Jan 2018;64:152–158. doi: 10.1016/j.neuro.2017.09.012 - DOI - PMC - PubMed
    1. Schullehner J, Thygesen M, Kristiansen SM, Hansen B, Pedersen CB, Dalsgaard S. Exposure to Manganese in Drinking Water during Childhood and Association with Attention-Deficit Hyperactivity Disorder: A Nationwide Cohort Study. Environ Health Perspect. Sep 2020;128(9):97004. doi: 10.1289/EHP6391 - DOI - PMC - PubMed

Publication types

LinkOut - more resources