[Preprint]. 2025 Mar 17:2025.02.13.637721.
doi: 10.1101/2025.02.13.637721.

Single-cell multiome and spatial profiling reveals pancreas cell type-specific gene regulatory programs driving type 1 diabetes progression

Affiliations

Single-cell multiome and spatial profiling reveals pancreas cell type-specific gene regulatory programs driving type 1 diabetes progression

Rebecca Melton et al. bioRxiv. .

Update in

Abstract

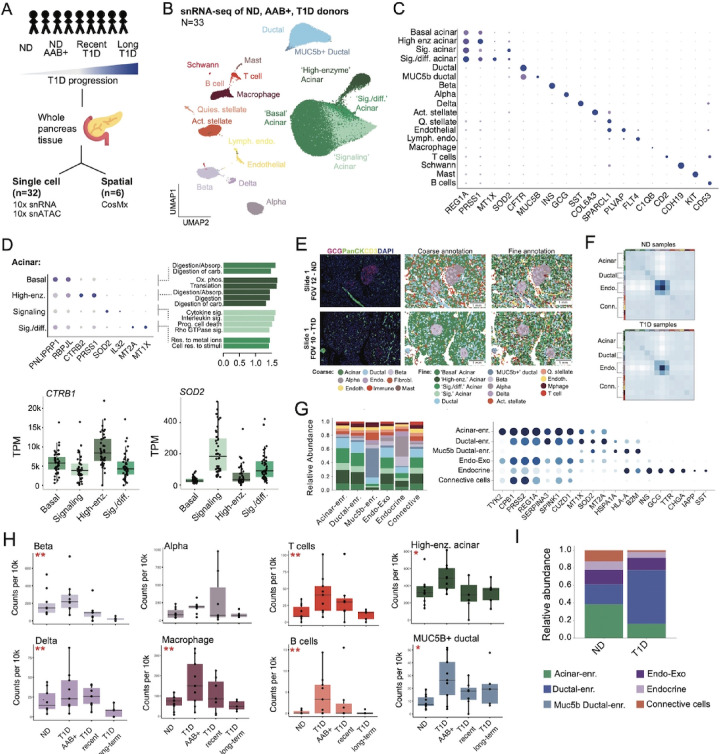
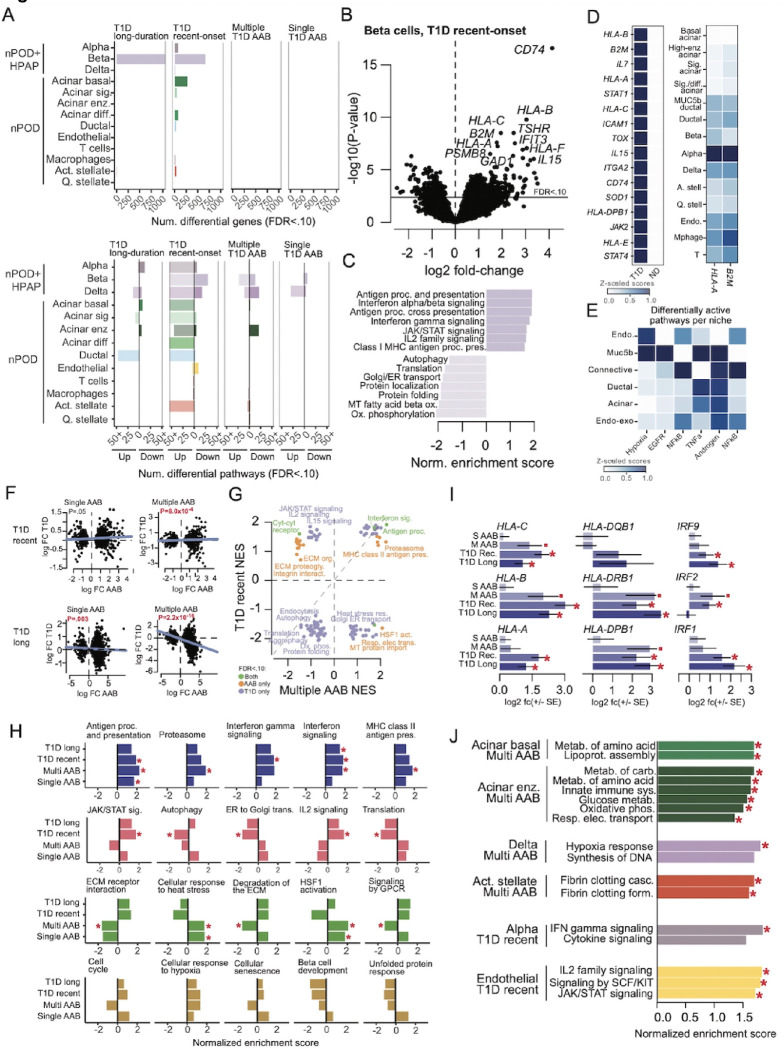
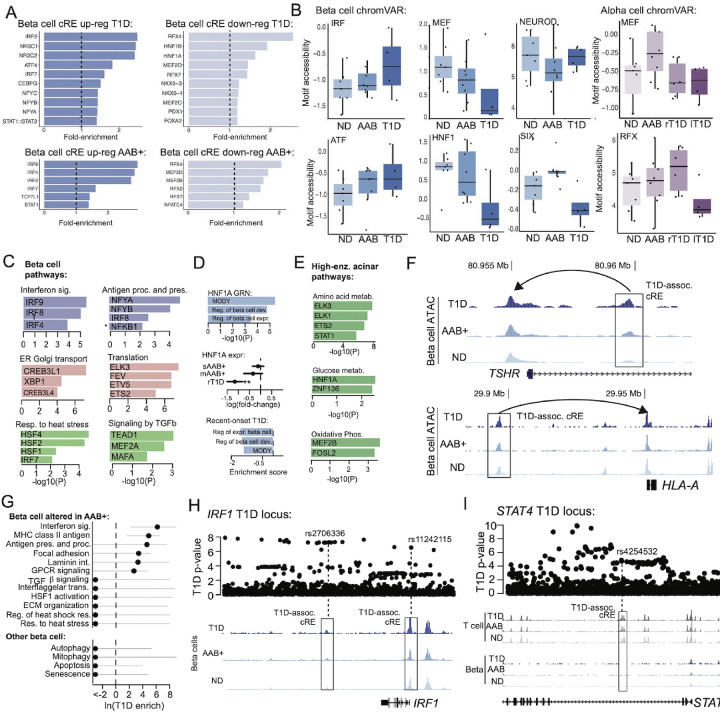
Cell type-specific regulatory programs that drive type 1 diabetes (T1D) in the pancreas are poorly understood. Here we performed single nucleus multiomics and spatial transcriptomics in up to 32 non-diabetic (ND), autoantibody-positive (AAB+), and T1D pancreas donors. Genomic profiles from 853,005 cells mapped to 12 pancreatic cell types, including multiple exocrine sub-types. Beta, acinar, and other cell types, and related cellular niches, had altered abundance and gene activity in T1D progression, including distinct pathways altered in AAB+ compared to T1D. We identified epigenomic drivers of gene activity in T1D and AAB+ which, combined with genetic association, revealed causal pathways of T1D risk including antigen presentation in beta cells. Finally, single cell and spatial profiles together revealed widespread changes in cell-cell signaling in T1D including signals affecting beta cell regulation. Overall, these results revealed drivers of T1D progression in the pancreas, which form the basis for therapeutic targets for disease prevention.


Conflict of interest statement

Declaration of interests The following conflicts of interest are reported for several authors. K.J.G has done consulting for Genentech, received honoraria from Pfizer, holds stock in Neurocrine biosciences, and his spouse is employed by Altos Labs, Inc. J.C. and R.M.E hold stock in and are employed by Pfizer Inc. F.J.T. consults for Immunai, Singularity Bio, CytoReason, Cellarity and Omniscope, and has ownership interest in Dermagnostix and Cellarity.

Figures

Figure 1.
Figure 1.. Cell type-specific map of gene expression in the pancreas.
(A) Design of study profiling human pancreas from ND, ND AAB+ and T1D donors using single cell assays. (B) Uniform manifold approximation and projection (UMAP) plot showing clustering of 276,906 nuclei from single nuclear RNA-seq of 32 whole pancreas donors from the nPOD biorepository. Clusters are labeled based on cell type and sub-type annotations. (C) Dot plot showing the normalized expression levels of selected known marker genes for pancreatic cell types and sub-types. (D) Dot plot of genes with preferential expression across different sub-types of acinar cells (top left), and normalized enrichment score (NES) of pathways enriched in each subtype using fGSEA (top right). Donor transcripts per million (TPM) of selected genes with preferential expression in different sub-types of acinar cells. (E) Representative FOV per condition (ND: top, T1D: bottom) showing (from left to right) immunofluorescence, coarse cell type annotation with the spatial gene panel directly, and finer-grained cell type annotation transferred from the snRNA-seq data. (F) Matrix plots showing the neighborhood enrichment of cell types based on spatial neighbors. (G) Stacked barplot illustrating the relative abundance of each cell type in each multicellular niche (left). Dot plot showing the normalized gene expression levels of spatially variable genes across multi-cellular pancreatic niches (right). (H) Normalized cell counts for selected pancreatic cell types and sub-types organized by donor T1D and ND AAB+ status. ** FDR<.10, * uncorrected p<.05. (I) Stacked barplot showing the relative abundance of each multi-cellular niche per condition. Niches with * have altered abundance in ND samples (p<0.05).
Figure 2.
Figure 2.. Cell type-specific map of accessible chromatin in the pancreas.
(A) Uniform manifold approximation and projection (UMAP) plot showing clustering of 203,348 nuclei from single nuclear ATAC-seq of 29 whole pancreas donors from the nPOD biorepository. Clusters are labeled with cell type and sub-type identity based on label transfer from the gene expression map. (B) Genome browser showing cell type-specific accessible chromatin signal at the promoter regions of known marker genes for pancreatic cell types. (C) Heatmap showing genome-wide accessibility from chromVAR of sequence motifs for selected transcription factors (TF) across cell types (left), and boxplots showing donor-level accessibility of selected TF sequence motifs across cell types (right). (D) Genome-wide accessibility of sequence motifs for TFs with preferential enrichment in specific sub-types of acinar cells (left), and log fold-change in expression for genes in structural sub-families for the enriched TF motifs (right). (E) Number of cREs identified across all cell types and the percentage of cREs that do not overlap previous catalogs of cREs from Zhang et al and Chiou et al (top). Example of a pancreatic T cell-specific cRE novel to this study compared to previous catalogs at the ZNF746 locus. (F) Sequence motifs for TFs enriched in cREs with activity specific to each cell type (left) and barplots showing -log10 p-values of gene sets enriched for proximity to cell type-specific cREs using GREAT. (G) Example of a cRE active in pancreatic T cells and macrophages that overlaps a candidate causal T1D risk variant at the PRCKQ locus. (H) Number of gene-CRE links per gene per cell type (top) and schematic of TF gene regulatory network (GRN) creation (bottom). (I) Matrix plot showing the scaled Z-score of TF activities for top TFs identified for each cell type using a t-test with overestimated variance. (J) Spatial plot of selected TFs showing the TF activity profile (top), and cell type distribution for the respective cell type (bottom).
Figure 3.
Figure 3.. Cell type-specific changes in gene expression in T1D progression.
(A) Number of genes in each pancreatic cell type with significant (FDR<.10) changes in expression in ND AAB+ or T1D status compared to non-diabetes. Endocrine cell types include scRNA-seq data from HPAP donors (top). Number of biological pathways enriched in genes with up- and down-regulated expression in each cell type in ND AAB+ or T1D (bottom). (B) Volcano plot showing differential expression results in beta cells in recent-onset T1D compared to ND. (C) Bar plot showing normalized enrichment score (NES) of biological pathways enriched in up- and down-regulated genes in beta cells in recent-onset T1D (bottom). (D) Scaled expression in spatial profiles of genes with up-regulated expression in T1D in beta cells (left). Spatially-dependent expression of selected genes (HLA-A, B2M) up-regulated in T1D in each cell type (right). (E) Biological pathways with differential expression within spatial niches in T1D compared to ND in spatial profiles. (F) Scatterplot of log fold-change in expression of genes in beta cells in single or multiple ND AAB+ compared to recent-onset T1D (top) and longer-duration T1D (bottom). Line shown in each plot is from a linear model of log fold-change values, and p-values are from Spearman correlation. (G) Normalized enrichment score (NES) of biological pathways enriched in differential expression results of recent-onset T1D and multiple ND AAB+. Pathways are colored based on significant enrichment (FDR<.10) in either, or both, disease states. (H) Normalized enrichment score of biological pathways enriched in differential expression results in beta cells across each T1D state (single ND AAB+, multiple ND AAB+, recent-onset T1D, and long-duration T1D) compared to non-diabetes. Red stars are for pathways with significant enrichment (FDR<.10) in each state. (I) Log fold-change of expression of selected MHC and interferon related genes in beta cells in each state compared to ND. Red stars indicate genes with significant change in expression (FDR<.10) and red dots indicate more nominal change in expression (un-corrected p<.05). (J) Normalized enrichment score (NES) of biological pathways enriched in genes with up- and down-regulated expression in ND AAB+ and T1D in other pancreatic cell types. Red stars indicate pathways with significant enrichment (FDR<.10).
Figure 4.
Figure 4.. Epigenomic changes in pancreatic cell types in T1D progression.
(A) Fold enrichment of sequence motifs for transcription factors (TFs) enriched in beta cell cREs with up-regulated or down-regulated activity in recent-onset T1D (top) or ND AAB+ (bottom). (B) Box plots showing donor-level genome-wide accessibility of selected TF motifs in beta cells (left) and alpha cells (right) from chromVAR across non-diabetes (ND), ND AAB+ (AAB) and recent-onset T1D (T1D). (C) TF GRNs enriched for overlap with genes in biological pathways in beta cells altered in T1D progression. (D) Biological pathways in beta cells enriched for overlap with the HNF1A GRN (top). Beta cell expression of HNF1A in T1D progression (middle). Beta cell activity of biological pathways linked to the HNF1A GRN in T1D progression (bottom). (E) Genome browser views of the TSHR (top) and HLA-A (bottom) loci where beta cell cREs with altered activity in T1D were linked to genes with concordant changes in expression in T1D. (F) Genome-wide enrichment of T1D-associated variants in beta cell cREs linked to pathways with altered expression in ND AAB+. (G) Genome browser view of T1D associated variants and beta cell accessible chromatin in non-diabetes, ND AAB+ and T1D at the IRF1 locus, where candidate T1D variant overlaps a beta cell cRE with altered activity in T1D progression. (H) Genome browser view of T1D associated variants and both beta cell and T cell accessible chromatin in non-diabetes, ND AAB+, and T1D at the STAT4 locus. Candidate T1D variants at this locus overlap a T cell cRE but not a beta cell cRE.
Figure 5.
Figure 5.. Cell-cell signaling networks altered in T1D progression.
(A) Summary of total interaction strength (top) and number of interactions (middle) for each pancreatic cell type lineage in non-diabetes, ND AAB+, recent-onset T1D and long-duration T1D. Bar plot showing the number of ligand receptor interactions identified per donor in spatial slides (bottom). (B) Heatmap showing normalized interaction strength of outgoing and incoming signals for each cell type among donors which were non-diabetes, ND AAB+, recent-onset T1D and long-duration T1D. Stars represent the significance of the difference in interaction strength in each disease state compared to non-diabetes using permutations. **FDR<.01, *FDR<.05. (C) Difference in strength of interactions between beta cells and other pancreatic cell types and sub-types in ND AAB+, recent-onset T1D and long-duration T1D. **FDR<.01, *FDR<.05. (D) Interaction strength of outgoing and incoming signals for each cell type summarized by broad functional categories. **FDR<.01, *FDR<.05. (E) Normalized interaction strength in recent-onset T1D and non-diabetes for ligands with significant change in incoming or outgoing signal involving beta cells. (F) Heatmap per donor showing the interaction score of the top ligand-receptor interactions from a likelihood ratio test comparing ND and T1D donors. (G) Spatial plots of a representative FOV per condition (T1D: top, ND: bottom) highlighting, from left to right, spots where the interaction between HLA-C and CD8A presented a significant spatial pattern and the cell types where this interaction occurs. (H) Volcano plot showing genes with up- and down-regulated expression in EndoC-BH1 cells after treatment with BMP5 compared to no treatment (left). Biological pathways enriched in genes with up- and down-regulated expression in BMP5 exposure (right). (I) Volcano plot showing genes with up- and down-regulated expression in EndoC-BH1 cells after treatment with granulin (GRN) compared to no treatment (left). Biological pathways enriched in genes with up- and down-regulated expression after GRN exposure (right).

References

    1. Lehuen A., Diana J., Zaccone P. & Cooke A. Immune cell crosstalk in type 1 diabetes. Nat. Rev. Immunol. 10, 501–513 (2010). - PubMed
    1. Eguchi K. & Nagai R. Islet inflammation in type 2 diabetes and physiology Find the latest version : Islet inflammation in type 2 diabetes and physiology. J. Clin. Invest. 127, 14–23 (2017). - PMC - PubMed
    1. Boldison J. & Wong F. S. Immune and Pancreatic β Cell Interactions in Type 1 Diabetes. Trends Endocrinol. Metab. 27, 856–867 (2016). - PubMed
    1. Fasolino M. et al. Single-cell multi-omics analysis of human pancreatic islets reveals novel cellular states in type 1 diabetes. Nat. Metab. 4, 284–299 (2022). - PMC - PubMed
    1. Chiou J. et al. Interpreting type 1 diabetes risk with genetics and single-cell epigenomics. Nature 594, 398–402 (2021). - PMC - PubMed

Publication types

LinkOut - more resources