[Preprint]. 2025 Feb 22:2025.02.22.639648.
doi: 10.1101/2025.02.22.639648.

Suprachiasmatic Neuromedin-S Neurons Regulate Arousal

Affiliations

Suprachiasmatic Neuromedin-S Neurons Regulate Arousal

Yu-Er Wu et al. bioRxiv. .

Abstract

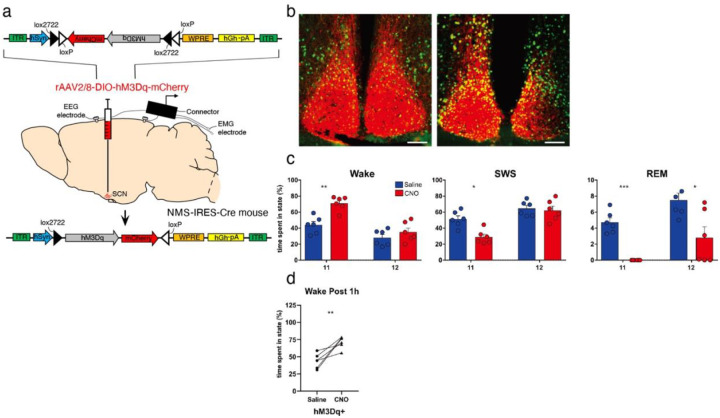
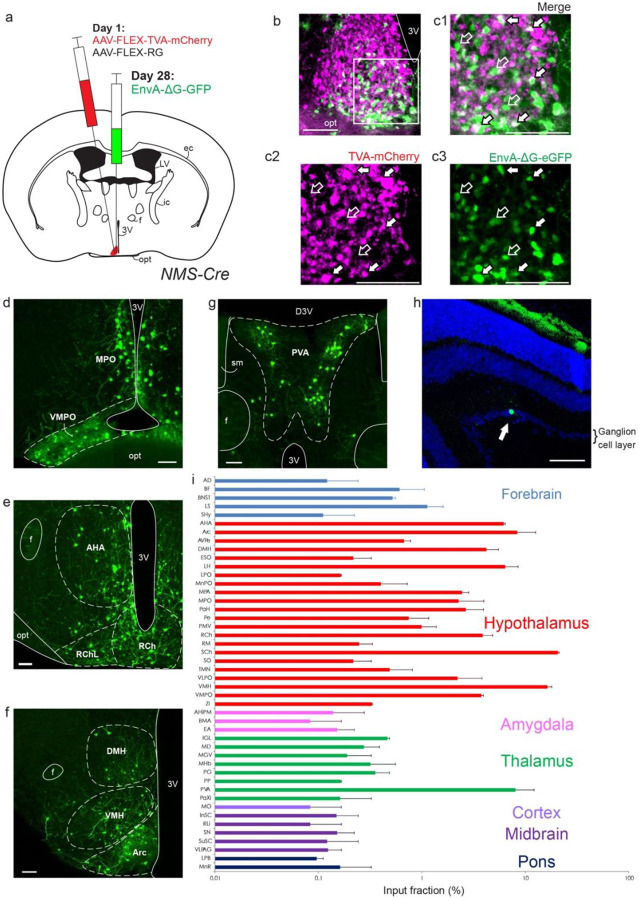
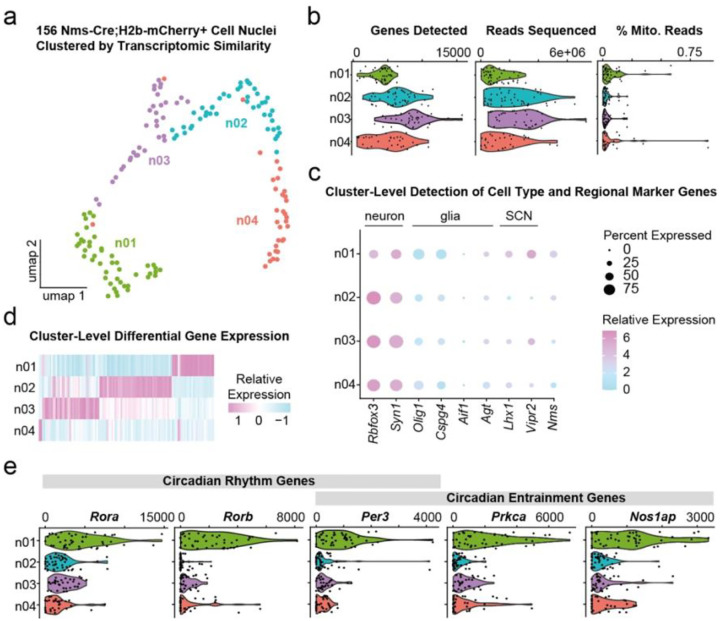
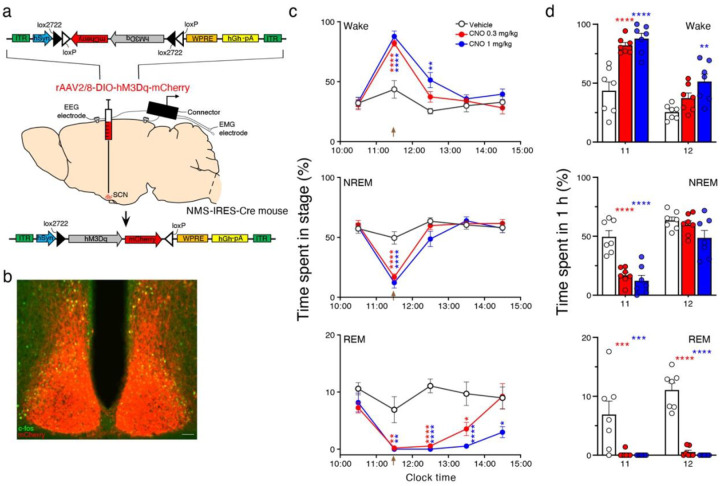
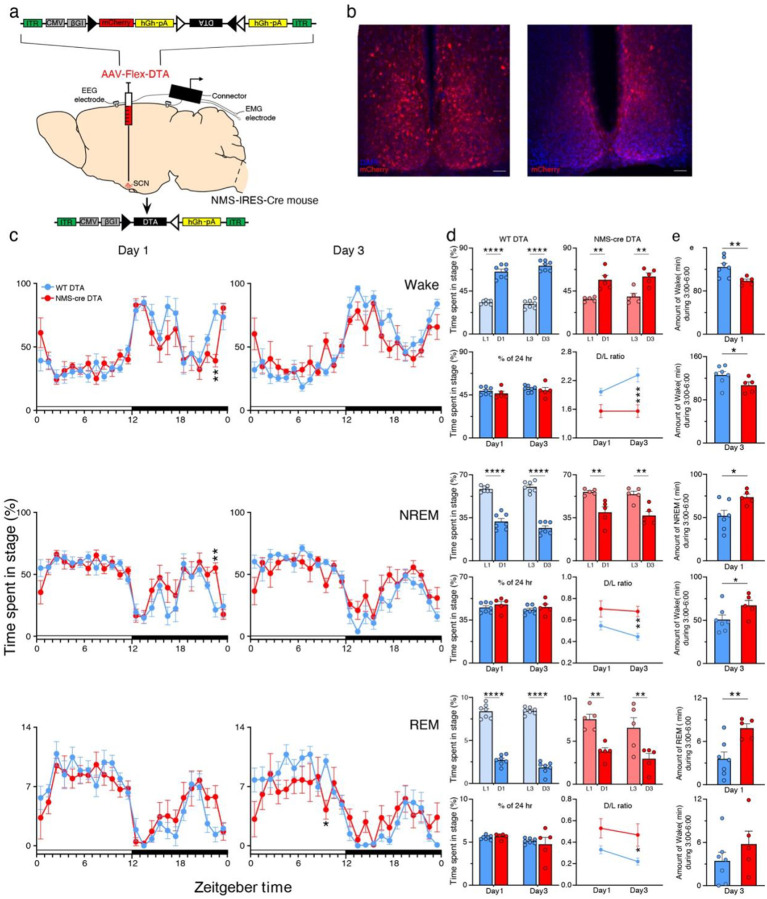
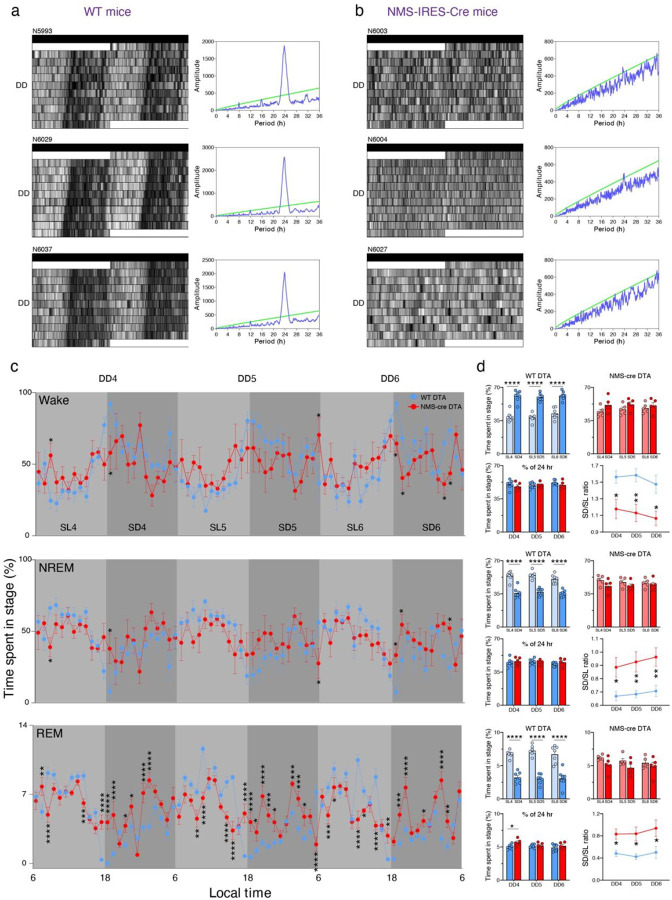
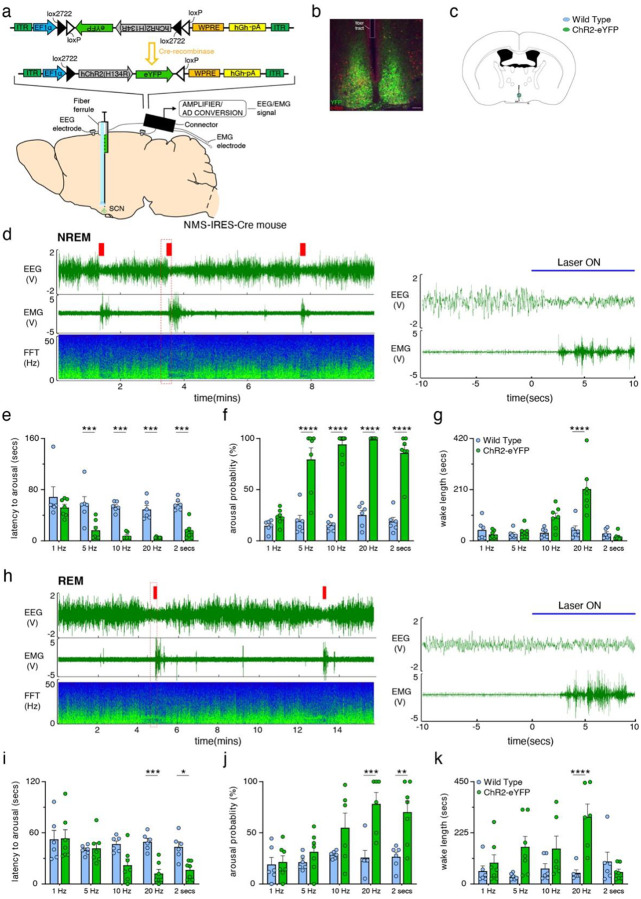
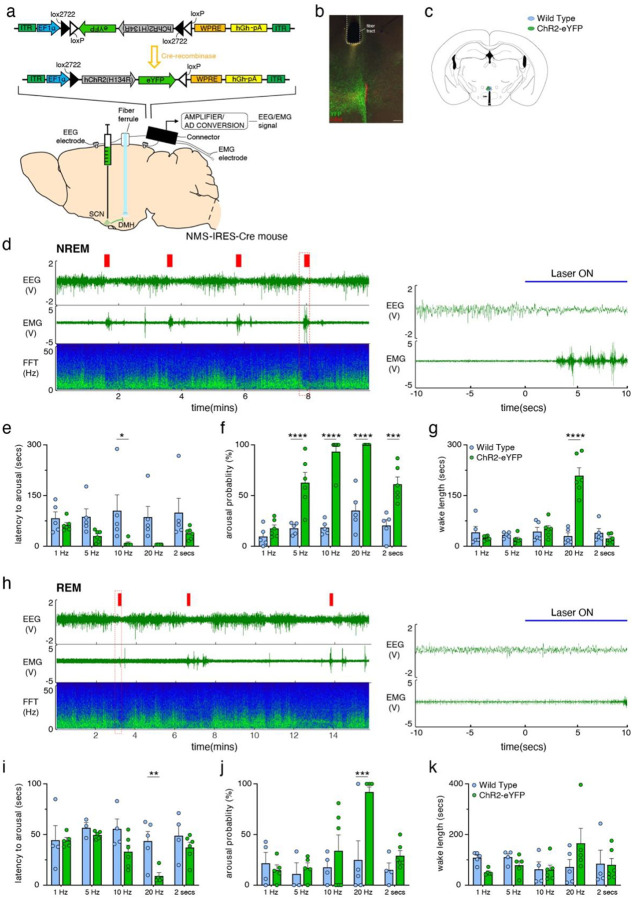
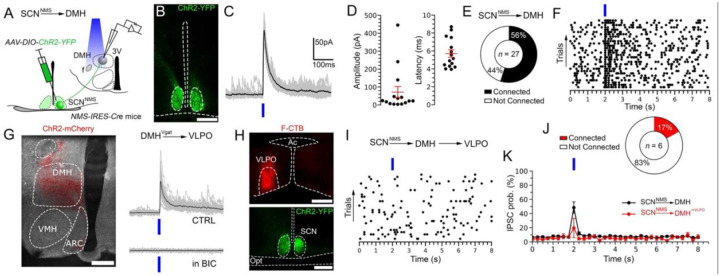
Mammalian circadian rhythms, which orchestrate the daily temporal structure of biological processes, including the sleep-wake cycle, are primarily regulated by the circadian clock in the hypothalamic suprachiasmatic nucleus (SCN). The SCN clock is also implicated in providing an arousal 'signal,' particularly during the wake-maintenance zone (WMZ) of our biological day, essential for sustaining normal levels of wakefulness in the presence of mounting sleep pressure. Here we identify a role for SCN Neuromedin-S (SCNNMS) neurons in regulating the level of arousal, especially during the WMZ. We used chemogenetic and optogenetic methods to activate SCNNMS neurons in vivo, which potently drove wakefulness. Fiber photometry confirmed the wake-active profile of SCNNM neurons. Genetically ablating SCNNMS neurons disrupted the sleep-wake cycle, reducing wakefulness during the dark period and abolished the circadian rhythm of body temperature. SCNNMS neurons target the dorsomedial hypothalamic nucleus (DMH), and photostimulation of their terminals within the DMH rapidly produces arousal from sleep. Presynaptic inputs to SCNNMS neurons were also identified, including regions known to influence SCN clock regulation. Unexpectedly, we discovered strong input from the preoptic area (POA), which itself receives substantial inhibitory input from the DMH, forming a possible arousal-promoting circuit (SCN->DMH->POA->SCN). Finally, we analyzed the transcriptional profile of SCNNMS neurons via single-nuclei RNA-Seq, revealing three distinct subtypes. Our findings link molecularly-defined SCN neurons to sleep-wake patterns, body temperature rhythms, and arousal control.


Conflict of interest statement

Competing interests The authors declare no competing interests.

Figures

Extended Data Fig. 1.
Extended Data Fig. 1.. Chemogenetic activation of SCNNMS neurons increases wakefulness.
a, Schematic illustration of the experimental setup: AAV-hSyn-DIO-hM3Dq-mCherry was bilaterally injected into the SCN of NMS-IRES-Cre mice. Two weeks later, the mice were equipped with an EEG/EMG headset to record sleep-wake patterns. b, Photomicrograph depicting immunofluorescent expression of hM3Dq-mCherry (Red) and cFos (green) in SCNNMS neurons. Scale bar, 200μm. Clear co-localization of mCherry expression and cFos induction, indicating activation of hM3Dq-expressing neurons in response to CNO. c, Total time spent in wakefulness, NREM sleep, and REM sleep during the 1st h and 2nd h recording following the saline or CNO administration (n = 6 mice). Two-way ANOVA followed by Sidak post hoc test is shown. *p < 0.05; **p < 0.01; ***p < 0.001. d, Total time spent in wakefulness during the 1st h recording following the saline or CNO administration (n = 6 mice). Values are the mean ± SEM for each group (n = 6 mice). Two-way ANOVA followed by Sidak post hoc test is shown. **p < 0.01.
Extended Data Fig. 2.
Extended Data Fig. 2.. Distribution of inputs to SCNNMS neurons.
a, Schematic of unilateral stereotaxic injections of the two starter viruses (AAV-FLEX-TVA-mCherry and AAV-FLEX-RG) into the SCN, then 3 weeks later unilateral injections of pseudotyped modified rabies (EnvA-ΔG-eGFP) into the same location. b,c, Photomicrographs showing injection site 3 weeks after rabies injection. TVA-mCherry transfected neurons are labeled in magenta. Starter population neurons, i.e. neurons with both TVA-mCherry and EnvA-ΔG-eGFP, are labeled in white. SCN input neurons expressing EnvA-ΔG-eGFP are labeled in green. C1-C3 show boxed area in B. Filled arrows point towards starter population neurons, while unfilled arrows point towards neurons expressing only EnvA-ΔG-eGFP or TVA-mCherry. Scale bar: 100μm. d,e,g, Photomicrographs showing EnvA-ΔG-eGFP expressing input neurons to the SCN in the medial preoptic nucleus and ventromedial preoptic nucleus (d), anterior hypothalamic area and retrochiasmatic area (e), dorsomedial hypothalamic nucleus, ventromedial hypothalamic nucleus, and arcuate hypothalamic nucleus (f), and paraventricular thalamic nucleus. Scale bar: 100μm. h, Photomicrograph showing EnvA-ΔG-eGFP expressing input neuron (green, filled arrow) in the ganglion cell layer of the retina, counter-stained with DAPI. Scale bar: 100μm. i, Bar chart depicting the number of inputs to the SCN as a percentage of the total number of input neurons (n=2 cases, error bars indicate mean ± S.E.M. x-axis shown as a logarithmic scale). Abbreviations: 3V; 3rd ventricle, AD; anterodorsal thalamic nucleus, AHA; anterior hypothalamic area, AHiPM; amygdalohippocampal area, posteromedial part, Arc; arcuate hypothalamic nucleus, AVPe; anteroventral periventricular nucleus, BF; basal forebrain, BMA; basomedial amygdaloid nucleus, BNST; bed nucleus of the stria terminalis, D3V; dorsal 3rd ventricle, DMH; dorsomedial hypothalamic nucleus, EA; extended amygdala, ec; external capsule, ESO; episupraoptic nucleus, f; fornix, ic; internal capsule, IGL; intergeniculate leaflet, InSC; intermediate stratum, LH; lateral hypothalamic area, LPB; lateral parabrachial nucleus, LPO; lateral preoptic area, LS; lateral septal nucleus, LV; lateral ventricle, MD; mediodorsal thalamic nucleus, MGV; medial geniculate nucleus, ventral part, MHb; medial habenular nucleus, MnPO; median preoptic nucleus, MnR; median raphe nucleus, MO; medial orbital complex, MPA; medial preoptic area, MPO; medial preoptic nucleus, opt; optic tract, PaH; paraventricular hypothalamic nucleus, PaXi; paraxiphoid nucleus of thalamus, Pe; periventricular hypothalamic nucleus, PG; pregeniculate area, PMV; premammillary nucleus, ventral part, PP; peripeduncular nucleus, PVA; paraventricular thalamic nucleus, RCh; retrochiasmatic area, RChL; retrochiasmatic area, lateral part, RLi; rostral linear nucleus, RM; retromammillary nucleus, SCh; suprachiasmatic nucleus, SHy; septohypothalamic nucleus, sm; stria medullaris, SN; substantia nigra, SO; supraoptic nucleus, SuSC; superficial stratum of the superior colliculus, TMN; tuberomammillary nucleus, VLPAG; ventrolateral periaqueductal gray, VLPO; ventrolateral preoptic nucleus, VMH; ventromedial hypothalamic nucleus, VMPO; ventromedial preoptic nucleus, ZI; zona incerta.
Extended Data Fig. 3.
Extended Data Fig. 3.. In vivo fiber photometry of SCNNMS neurons during natural sleep-wake behavior and during a light pulse.
a, Experimental schema depicting viral vector injection of AAV10-EF1α-FLEX-GCaMP6s into the SCN of a NMS-IRES-Cre mouse and surgically implanted photometry fiber for recording population Ca2+ activity and EEG/EMG head stage for recording sleep-wake. b, Representative photomicrograph of GCaMP6s containing neurons (green) and the tip of the photometry fiber in the SCN of a NMS-IRES-Cre mouse. Scale bar: 200 μm. ox; optic chiasm, 3V; 3rd ventricle. c, Population Ca2+ activity in SCNNMS neurons during several sleep-wake cycles. d, Ca2+ activity averaged over wake (55 episodes per mouse), NREM sleep (55 episodes per mouse) and REM sleep (12 episodes from each mouse) episodes from 3 mice. Mean ± SEM, one-way ANOVA (F(2,363) = 79.26, p < 0.0001), followed by Tukey’s multiple comparison test. **** p < 0.0001. e, Ca2+ activity in SCNNMS neurons at arousal state transitions. Upper panels: mean (± SEM) Ca2+ activity across all transitions (n = 3 mice). Lower: heatmaps depicting individual arousal state transitions from NREM sleep to wake (11 transitions per mouse), wake to NREM sleep (22 transitions per mouse), NREM sleep to REM sleep (11 transitions per mouse) and REM sleep to wake (9 transitions per mouse). Black dotted line indicates time of transition. Paired two-tailed t-test. ***p < 0.001; **** p < 0.0001. f, Mean (± SEM) Ca2+ activity over all mice at the initiation of the light pulse. Black dotted line indicates onset of the light pulse. Paired two-tailed t-test. **p < 0.01. Heatmap depicting Ca2+ activity at the light pulse for each mouse. White dotted line indicates onset of the light pulse.
Extended Data Fig. 4.
Extended Data Fig. 4.. Molecular subtyping of Nms+ neurons in the SCN.
a, Uniform Manifold Approximation and Projection (UMAP) two-dimensional embedding of single-nuclei transcriptomes after Louvain clustering in high-dimensional gene space. b, Violin plots of genes detected per nucleus, reads sequenced per nucleus, and percentage of reads from mitochondrial genes. c, Dot plot of cluster-level detection rate and expression of select marker genes. d, Heatmap of genes differentially expressed across clusters. e, Violin plots of circadian rhythm and entrainment genes from KEGG analysis of differentially expressed genes in cluster n01.
Fig. 1.
Fig. 1.. Chemogenetic activation of SCNNMS neurons increases wakefulness.
a, Schematic illustration of the experimental setup: AAV-hSyn-DIO-hM3Dq-mCherry was bilaterally injected into the SCN of NMS-IRES-Cre mice. Two weeks later, the mice were equipped with an EEG/EMG headset to record sleep-wake patterns. b, Photomicrograph depicting immunofluorescent expression of hM3Dq-mCherry (Red) and cFos (green) in SCNNMS neurons. Scale bar, 200μm. Clear co-localization of mCherry expression and cFos induction, indicating activation of hM3Dq-expressing neurons in response to CNO. c, Time course of changes in wakefulness, NREM sleep, and REM sleep following the administration of vehicle or CNO in mice expressing hM3Dq in SCNNMS neurons. Each circle represents the mean hourly amount of time spent in each stage. Values are the mean ± SEM for each group (n = 7 mice). Two-way ANOVA followed by Sidak post hoc test is shown. *p < 0.05; **p < 0.01; ****p < 0.0001. d, Total time spent in wakefulness, NREM sleep, and REM sleep during the 1st h and 2nd h recording following the vehicle or CNO administration (n = 7 mice). Two-way ANOVA followed by Sidak post hoc test is shown. **p < 0.01; ***p < 0.001; ****p < 0.0001.
Fig. 2.
Fig. 2.. Effect of selective ablation of SCNNMS neurons on sleep–wake.
a, Experimental schematic: AAV-CMV-Flex-DTA-mCherry was bilaterally injected into the SCN of NMS-IRES-Cre mice. Mice were subsequently implanted with an EEG/EMG electrode to record sleep-wake. b, Photomicrograph depicting expression of Flex-DTA-mCherry (Red) in SCNNMS neurons in NMS-IRES-Cre mice or wild-type littermates (WT) mice. As non-NMS neurons do not express Cre and therefore are not killed by the Cre-dependent AAV-DTA, these neurons expressing mCherry indicate the injection site. Scale bar, 200μm. c, Hourly distribution of wakefulness, NREM sleep, and REM sleep for two days. Bars indicate mean ± SEM for the group (n = 5 to 7 mice). Two-way ANOVA followed by Sidak post hoc test is shown. *p < 0.05; **p < 0.01. d, Upper panels: Amounts (mean ± SEM) of the vigilance stages during the two days light (L1, L3) and dark (D1, D3) periods in WT mice (upper left panels; n = 7 mice) and NMS-IRES-cre mice (upper right panels; n = 5 mice). Lower panels: 24 h amounts (mean ± SEM) of the vigilance stages during the two days (Day1, Day3; lower left panels) and dark to light (D/L) ratio for each vigilance stage stages during the two days Day1, Day3; lower right panels). Two-way ANOVA followed by Sidak post hoc test is shown. *p < 0.05; **p < 0.01; ***p < 0.001; ****p < 0.0001. e, Total time spent in wakefulness, NREM sleep, and REM sleep during the 3:00 am to 6:00 am (n = 5 to 7 mice). Paired two-tailed t-test. *p < 0.05; **p < 0.01.
Fig. 3.
Fig. 3.. Circadian Rhythm of Body Temperature is Arrhythmic following Selective Ablation of SCNNMS Neurons.
a,b, Representative actograms showing body temperature (Tb) circadian rhythms (gray scale: darker represents higher temperature) and associated periodograms during ten days in constant dark (DD) from three WT mice (a) and three NMS-IRES-Cre mice (b). Note a profound disruption of Tb rhythms in NMS-IRES-Cre mice, while these rhythms remain unaltered in WT mice. c, Time-course of wakefulness, NREM sleep, and REM sleep during the 4th, 5th and 6th day in constant darkness. Bars indicate mean ± SEM for the group (n = 5 to 7 mice). Two-way ANOVA followed by Sidak post hoc test is shown. *p < 0.05; **p < 0.01; ***p < 0.001; ****p < 0.0001. d, Upper panels: Amounts (mean ± SEM) of the vigilance stages during the 4th, 5th and 6th subjective light (SL4, SL5, SL6) and subjective dark (SD4, SD5, SD6) periods in WT mice (upper left panels; n = 7 mice) and NMS-IRES-cre mice (upper right panels; n = 5 mice). Lower panels: 24 h amounts (mean ± SEM) of the vigilance stages during the 4th, 5th and 6th day in constant darkness (DD4, DD5, DD6; lower left panels) and subjective dark to subjective light (D/L) ratio for each vigilance stage stages during the 4th, 5th and 6th day in constant darkness (DD4, DD5, DD6; lower right panels). Two-way ANOVA followed by Sidak post hoc test is shown. *p < 0.05; **p < 0.01; ****p < 0.0001.
Fig. 4.
Fig. 4.. Optogenetic Stimulation of SCNNMS Neurons in vivo Rapidly Triggers Arousal.
a, Experimental schematic: AAV-EF1a-DIO-ChR2-eYFP was bilaterally injected into the SCN of NMS-IRES-Cre mice and an optical fiber was implanted over the injection site. Mice were also equipped with an EEG/EMG headset to record sleep-wake. b, Photomicrograph depicting expression of ChR2-eYFP in SCNNMS neurons (green) and optic fiber placement. Scale bar, 200μm. c, Location of the optic fiber tips within the SCN of ChR2-eYFP-expressing (green) and control (blue) mice. d, Left: example EEG/EMG traces and corresponding FFT analysis from a mouse expressing ChR2-eYFP in the SCN following optogenetic stimulation of SCNNMS cell bodies during NREM sleep (red bars; 10 s, 20 Hz, 10-ms pulses). Right: higher magnification of the red boxed area in the left-hand panel. Following optogenetic stimulation onset, the mouse awoke almost immediately. e,f,g, Latency to arousal (e), arousal probability during the optogenetic stimulation (f), and length of the wake episode following the stimulation (g) in wild-type (WT) and ChR2-eYFP mice over a range of stimulation frequencies delivered during NREM sleep. Bars represent mean ± SEM for the group (n = 6 to 7 mice per stimulation frequency per genotype), and individual data points represent the mean values for individual mice (calculated from 20 stimulations per stimulation frequency). h, Left: example sleep-wake recording from a mouse expressing ChR2-eYFP in the SCN following optogenetic stimulation of SCNNMS cell bodies during REM sleep (red bars; 10 s, 20 Hz, 10-ms pulses). Right: higher magnification of the red boxed area in the left-hand panel is shown. i,j,k, Latency to arousal (i), arousal probability during the optogenetic stimulation (j), and length of the wake episode following the stimulus (k) in WT and ChR2-eYFP mice over a range of stimulation frequencies delivered during REM sleep. Bars represent mean ± SEM for the group (n = 6 to 7 mice per stimulation frequency per genotype), and individual data points represent the mean values for individual mice (calculated from 20 stimulations per stimulation frequency). Two-way ANOVA followed by Sidak post hoc test is shown. *p < 0.05; **p < 0.01; ***p < 0.001; ****p < 0.0001.
Fig. 5.
Fig. 5.. Optogenetic stimulation of SCNNMS terminals in the DMH area rapidly triggers arousal.
a, Experimental schematic: AAV-EF1a-DIO-ChR2-eYFP was bilaterally injected into the SCN of NMS-IRES-Cre mice and an optical fiber was implanted over the ipsilateral DMH area. Mice were also equipped with an EEG/EMG headset to record sleep-wake. b, Photomicrograph depicting expression of ChR2-eYFP expression in SCNNMS terminals in the DMH area (green) and optic fiber placement. Scale bar, 200μm. c, Location of the optic fiber tips within the DMH area of ChR2-eYFP-expressing (green) and control (blue) mice. d, Left: Typical example polygraphic recording from a mouse expressing ChR2-eYFP in the SCN following optogenetic stimulation of SCNNMS/DMH axon terminals during NREM sleep (red bars; 10 s, 20 Hz, 10-ms pulses). Right: higher magnification of the red boxed area in the left-hand panel is shown. Following optogenetic stimulation onset, the mouse awoke almost immediately. e,f,g, Latency to arousal (e), arousal probability during the optogenetic stimulation (f), and length of the wake episode following the stimulation (g) in WT and ChR2-eYFP mice over a range of stimulation frequencies delivered during NREM sleep. Bars represent mean ± SEM for the group (n = 5–6 mice per stimulation frequency per genotype), and individual data points represent the mean values for individual mice (calculated from 20 stimulations per stimulation frequency). h, Left: example sleep-wake recording from a mouse expressing ChR2-eYFP in the DMH following optogenetic stimulation of SCNNMS/DMH axon terminals during REM sleep (red bars; 10 s, 20 Hz, 10-ms pulses). Right: higher magnification of the red boxed area in the left-hand panel is shown. i,j,k, Latency to arousal (i), arousal probability during the optogenetic stimulation (j), and length of the wake episode following the stimulus (k) in WT and ChR2- eYFP mice over a range of stimulation frequencies delivered during REM sleep. Bars represent mean ± SEM for the group (n = 5 to 6 mice per stimulation frequency per genotype), and individual data points represent the mean values for individual mice (calculated from 20 stimulations per stimulation frequency). Two-way ANOVA followed by Sidak post hoc test is shown. *p < 0.05; **p < 0.01; ***p < 0.001; ****p < 0.0001.
Fig. 6.
Fig. 6.. SCNNMS → DMH → VLPO circuit.
A, Schematic of the experimental design used to map connectivity between SCNNMS neurons and DMH neurons (SCNNMS→DMH). AAV10-EF1a-DIO-hChR2(H134R)-eYFP was injected bilaterally into the SCN of NMS-IRES-Cre mice, and recordings were made from the DMH in brain slices while photostimulating the SCNNMS axon terminals. B, Image of a SCNNMS neurons expressing ChR2-eYFP (green). (Scale bar, 500 μm). C, Photo-evoked IPSCs from a DMH neuron recorded in whole-cell mode during photostimulation of SCNNMS→DMH axon terminals. 30 individual IPSCs (grey) and average IPSC (black). D, Mean photo-evoked IPSC amplitude (left) and latency (right) recorded from DMH neurons (n = 15; mean ±SEM in red). E, Percentages of the DMH neurons in which photostimulation of the SCNNMS input produced opto-evoked IPSC (connected). Total number of DMH recorded neurons (n = 27). F, Raster plot (50-ms bins) of IPSCs in a DMH neuron before, during, and after photostimulation of the SCNNMS→DMH input (bin duration: 50 ms). G, Expression of ChR2 (in red) in DMH VGat expressing neurons (scale bar: 250 μm). Photostimulation of DMH terminals in VLPO (DMHVgat→VLPO) produced photo-evoked IPSCs in VLPO neurons that are blocked by bicuculline (BIC 20 μM). 30 individual IPSCs (grey) and average IPSC (black). H, Labelling of ChR2 (in green) in SCN NMS expressing neurons (scale bar: 200 μm) and fluorescent CTB (F-CTB, in red) in VLPO.

References

    1. Saper C. B. The central circadian timing system. Curr Opin Neurobiol 23, 747–751, doi:10.1016/j.conb.2013.04.004 (2013). - DOI - PMC - PubMed
    1. Saper C. B., Fuller P. M., Pedersen N. P., Lu J. & Scammell T. E. Sleep state switching. Neuron 68, 1023–1042, doi:10.1016/j.neuron.2010.11.032 (2010). - DOI - PMC - PubMed
    1. Dijk D. J. & Czeisler C. A. Contribution of the circadian pacemaker and the sleep homeostat to sleep propensity, sleep structure, electroencephalographic slow waves, and sleep spindle activity in humans. J Neurosci 15, 3526–3538, doi:10.1523/JNEUROSCI.15-05-03526.1995 (1995). - DOI - PMC - PubMed
    1. Abrahamson E. E. & Moore R. Y. Suprachiasmatic nucleus in the mouse: retinal innervation, intrinsic organization and efferent projections. Brain Res 916, 172–191, doi:10.1016/s0006-8993(01)02890-6 (2001). - DOI - PubMed
    1. Morin L. P. Neuroanatomy of the extended circadian rhythm system. Exp Neurol 243, 4–20, doi:10.1016/j.expneurol.2012.06.026 (2013). - DOI - PMC - PubMed

Publication types

LinkOut - more resources