[Preprint]. 2025 Feb 19:2025.02.19.638515.
doi: 10.1101/2025.02.19.638515.

Cholesterol efflux protein, ABCA1, supports anti-cancer functions of myeloid immune cells

Affiliations

Cholesterol efflux protein, ABCA1, supports anti-cancer functions of myeloid immune cells

Shruti V Bendre et al. bioRxiv. .

Abstract

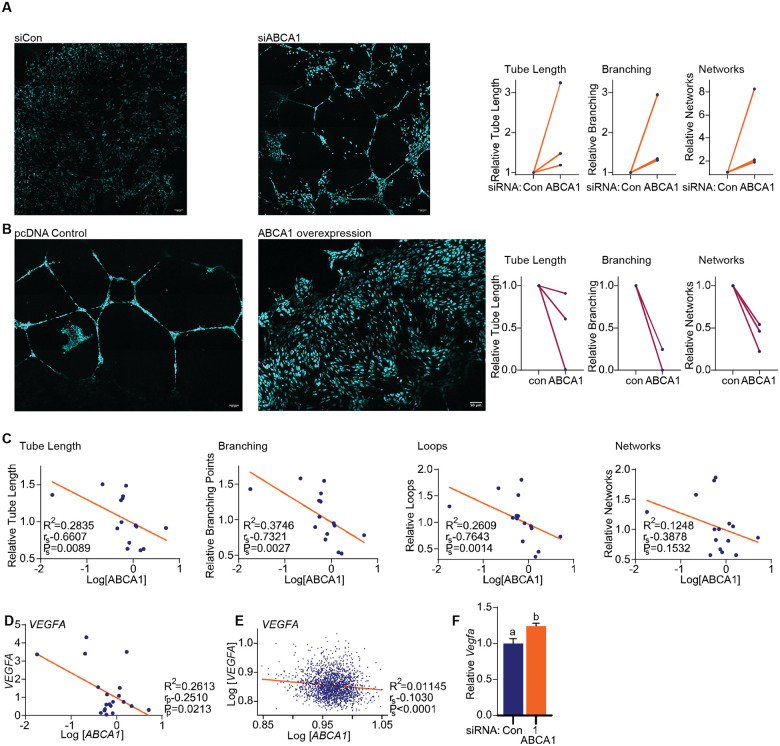
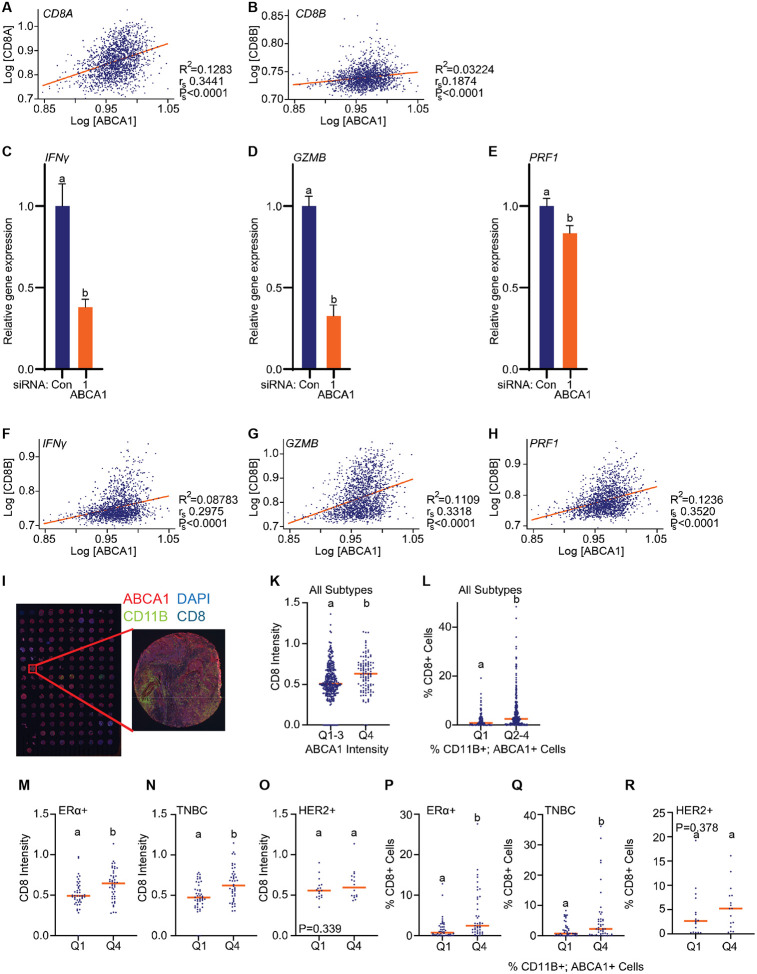
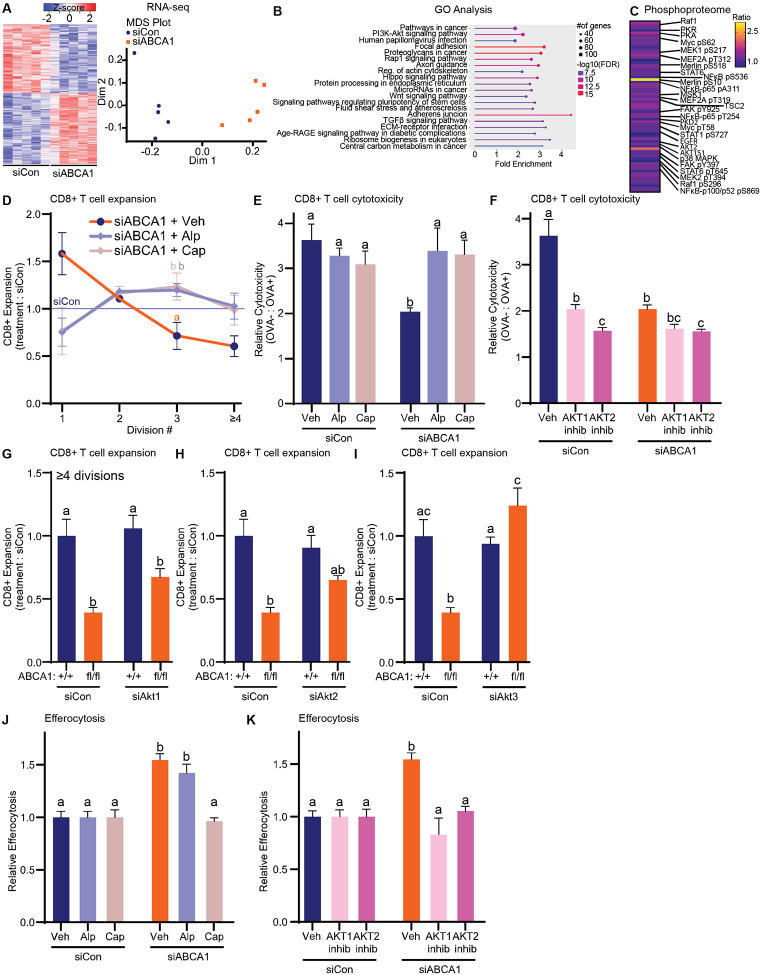
Although immune therapy has seen significant advances, the majority of breast and other solid tumors do not respond or quickly develop de novo resistance. One factor driving resistance is highly immune suppressive myeloid cells (MCs) such as macrophages. Previous work has established clinical links between cholesterol and cancer outcome, and that MC function can be regulated through disruption in cholesterol metabolism. Thus, we screened for proteins that were expressed in MCs, involved in cholesterol homeostasis and whose expression was associated with survival; we identify the cholesterol efflux protein ABCA1. Preclinical studies revealed that ABCA1 activity resulted in increased anti-cancer functions of macrophages: enhanced tumor infiltration, decreased angiogenic potential, reduced efferocytosis, and improved support of CD8+ T cell activity. Mechanistically, different AKT isoforms are involved, through both PI3K dependent and independent mechanisms. Assessment of human blood and breast tumors revealed correlations between ABCA1 in macrophages and angiogenic potential, VEGFA, and CD8 T cell abundance and activity, highlighting the clinical relevance of our findings. The culmination of the effects of ABCA1 on MC function were demonstrated through increased tumor growth and metastasis in mice with MC specific knockout of ABCA1. Therefore, modulating ABCA1 activity within MCs may represent a novel approach to immune therapy.


Conflict of interest statement

Conflict of interests: SVB and ERN have filed an invention disclosure describing the use of ABCA1 and other strategies to alter ABCA1 activity.

Figures

Figure 1:
Figure 1:. ABCA1 is expressed in breast tumor associated myeloid cells and is positively associated with increased survival.
(A) Breast tumor sections were stained for ABCA1 (red), the pan-myeloid cell marker CD11B (green), and the nuclear stain DAPI (blue). (B) Assessment of ABCA1 expression by single cell RNA-seq of healthy breast tissue indicates relatively high expression in cells annotated as macrophages (data from the Human Protein Atlas; corresponding cluster map in Supplementary Fig. 1; proteinatlas.org (29)). Red bars are of the myeloid cell lineage. (C) Single cell RNA-seq of breast/mammary tumors indicates relatively high expression of ABCA1 in myeloid cells compared to other cells. Red bars are of the myeloid cell lineage. Data was obtained from the indicated databases and accessed through TISCH2 (30). GSE176078: 26 tumors, 89,471 cells. GSE161529: 52 tumors, 332,168 cells. EMTAB8107: 14 tumors, 33,043 cells. GSE136206: 27,352 cells. (D) ABCA1 expression is associated with increased survival. The Kaplan-Meier plotter was used to probe associations between ABCA1 expression and recurrence-free survival when considering all subtypes, Luminal A only, Luminal B only, Basal only, or HER2+ only (from left to right) (P values were determined using the Log-rank (Mantel-Cox) method except for Luminal B where the Gehan-Breslow-Wilcoxin test was used). (E) Expression of ABCA1 in tumors from patients treated with immune checkpoint blockers (ICB) is associated with an increased progression free survival time. Tumor types included for this analysis were bladder, esophageal adenocarcinoma, glioblastoma, hepatocellular carcinoma, head and neck squamous cell carcinoma, melanoma, non-small cell lung cancer and urothelial cancer. P value was determined using the Log-rank (Mantel-Cox) method. The Kaplan-Meier Plotter webtool uses aggregated data from GEO, EGA, and TCGA (31).
Figure 2:
Figure 2:. ABCA1 activity in macrophages increases their capacity to infiltrate mammary cancer spheroids.
(A) BMDMs (MΦs) were transfected with control or siRNA against ABCA1 for 48h prior to being stained with Cell Trace Red and overlayed onto 4T1 tumor spheroids previously stained with HCS Nuclear Mask and Cell Mask Orange, in a ultra-low attachment dish. Confocal microscopy was performed on a Ziess LSM 900 using airyscan. Z stack images were obtained and analyzed using Image J. Maximum intensity z projections were created for representative confocal images. (B) A second siRNA targeting a different region of Abca1 in MΦs also resulted in decreased infiltration of 4T1 tumor spheroids. (C) A small molecule inhibitor of ABCA1, PSC833, decreased the ability of MΦs to infiltrate 4T1 tumor spheroids. BMDMs were treated with 1μM PSC833 for 24h. BMDMs were washed and stained prior to overlay onto 4T1 spheroids. (D) Overexpression of ABCA1 in MΦs increased their capacity to infiltrate 4T1 tumor spheroids compared to empty vector (pcDNA) control transfected MΦs. (E-H) Manipulating ABCA1 had similar effects on the ability of MΦs to infiltrate E0771 tumor spheroids.
Figure 3:
Figure 3:. ABCA1 activity in macrophages decreases their ability to promote neo-angiogenesis.
(A) siRNA against ABCA1 in MΦs results in increased tube formation by HUVEC cells. MΦs were transfected with control or siRNA against ABCA1 for 48h before being placed on top of HUVEC cells embedded in Geltrex. Macrophages and HUVECs were separated by a 0.4μm Boyden Chamber only allowing for exchange of soluble factors. 24h later, HUVECs were stained with Calcein AM to visualize Live Cells. Confocal microscopy was performed using Ziess LSM900, while performing tile scans and z stacks. Tube formation metrics were quantified by Wimasis. Representative images to the left of quantified data for 3 independent experiments normalized to control for batch effects. Total tube length, branching and networks were quantified (B) ABCA1 overexpression in MΦs results in decreased tube formation. Same experimental setup as (A), but MΦs were transfected with either control (pcDNA) or an ABCA1 overexpression plasmid. (C) Human PBMCs were sourced from the whole blood of females with no known cancer, and differentiated into macrophages. Media from 48h of conditioning was added to pre-seeded HUVECS and confocal microscopy was performed as described above. Linear regression was performed to evaluate potential correlations between ABCA1 expression and different aspects of tube formation (length, branching, loops and networks). Spearman’s rank correlation (rs) was determined and corresponding P (Ps) value reported. (D) Human PBMCs were probed for the expression of VEGFA, and linear regression performed comparing ABCA1 to VEGFA. The Pearson correlation coefficient (rp) and corresponding P (Pp) value reported. (E) Linear regression comparing expression of ABCA1 to VEGFA in human breast tumors. Data obtained from the TCGA (Breast Invasive Carcinoma). Spearman’s rank correlation (rs) was determined and corresponding P (Ps) value reported. (F) Vegfa mRNA expression is increased in murine MΦs transfected with siRNA against ABCA1. Different letters denote statistical significance (P<0.05).
Figure 4:
Figure 4:. ABCA1 overexpression in BMDMs results in decreased efferocytosis, while loss of ABCA1 increases efferocytosis.
(A-C) No difference in phagocytosis was observed between control BMDMs or those transfected with two different siRNAs against ABCA1, treated with the ABCA1 inhibitor PSC833 nor ABCA1 overexpression. (D-E) two independent siRNAs against ABCA1 resulted in increased efferocytosis of apoptotic neutrophils. (F) Likewise, treatment of BMDMs with PSC833 also increased efferocytosis. (G) Overexpression of ABCA1 decreased efferocytosis. (H-J) Same as for (D-G) but the efferocytosis ‘bait’ was apoptotic E0771 cells instead of neutrophils.
Figure 5:
Figure 5:. ABCA1 activity results in BMDMs that support T cell migration, expansion and anti-cancer cytotoxic function.
(A) BMDMs were transfected and cultured in the presence of OVA and LPS. Pan-OTI T cells were co-cultured with the BMDMs for 72hrs. The T cells were then labeled with CFSE and placed in the top well of a Boyden chamber and allowed to migrate towards E0771-OVA mammary cancer cells. Cartoon of experimental approach to the left of quantified data. (B) Human, female PBMCs were isolated from whole blood and bead-sorted for monocytes and T cells. Monocytes were differentiated into macrophages prior to assessment of ABCA1 expression by qPCR and culture with activated T cells from the same donor. T cell proliferation was determined by dilution of CFSE stain, by flow cytometry. Linear regression was performed comparing ABCA1 expression to the percentage of T cells that had undergone more than 2 divisions. Spearman’s rank correlation (rs) was determined and corresponding P (Ps) value reported. (C) CD8+ T cell expansion is decreased when activated T cells are co-cultured with BMDMs transfected with siRNA against ABCA1. A ratio between the proportion of T cells expanded under siABCA1 conditions to siControl conditions is shown, with the blue line being the siControl conditions. The percentage in each clonal generation shown in Supplementary Fig. 4A. A second siRNA against ABCA1 yielded similar results (Supplementary Fig. 4B) (D) CD8+ T cell expansion is decreased when activated T cells are co-cultured with BMDMs pretreated with the ABCA1 inhibitor, PSC833. BMDMs were pretreated with indicated doses of PSC833 for 24hr prior to co-culture with activated T cells. A ratio between the proportion of T cells expanded under treatment conditions to vehicle control conditions is shown, with the blue line being the vehicle conditions. The percentage in each clonal generation shown in Supplementary Fig. 4D. (E) CD8+ T cell expansion is increased when activated T cells are co-cultured with BMDMs transfected with an expression plasmid for ABCA1. A ratio between the proportion of T cells expanded under ABCA1 overexpression conditions to control vector conditions is shown, with the blue line being the control conditions. The percentage in each clonal generation shown in Supplementary Fig. 4E. (F) The robust effects of siABCA1 in BMDMs on CD8+ T cell expansion are not as apparent when the BMDMs are separated from T cells in a Boyden chamber. The percentage in each clonal generation shown in Supplementary Fig. 4I. (G) The robust effects of overexpressing ABCA1 in BMDMs on CD8 T cell expansion are lost when the BMDMs are separated from T cells in a Boyden chamber. The percentage in each clonal generation shown in Supplementary Fig. 4J). (H) Anti-cancer cytotoxicity of T cells is influenced after coculture with BMDMs with altered ABCA1. BMDMs were transfected with siControl or siRNA against ABCA1 for 48h. They were then treated with OVA prior to co-culture with OT-I T cells for 72h. T cells were counted and an equal number were co-cultured with E0771 and E0771-OVA cells at a starting ratio of 1:1, each stained with a different color. After 24hrs, remaining E0771 and E0771-OVA cells were quantified by flow cytometry. The experimental setup is illustrated to the left. Data is displayed as a ratio of OVA− to OVA+ E0771 cells, so decreases are a reflection of antigen-specific, T cell-mediated cytotoxicity. (I) Treatment of BMDMs with the ABCA1 inhibitor PSC833 results in T cells with decreased cytotoxic activity. Experimental setup and details as in H. (J) Overexpression of ABCA1 in BMDMs did not robustly influence T cell cytotoxic capacity against E0771-OVA cells. Experimental setup and details as in H. Asterisks (*) or different letters denote statistical significances (P<0.05). A, H, I & J: Student’s T Test. C-G: Student’s T Test for each division, comparing treated to control condition. Cartoons generated and adapted from BioRender.
Figure 6:
Figure 6:. ABCA1 is correlated with markers of CD8+ T cell number and function in human breast tumors.
(A-B) mRNA expressions for the markers for cytotoxic T cells, CD8A and CD8B, are positively correlated to ABCA1 expression in human breast tumors. Linear regression was used to fit the line. Data obtained from the METABRIC dataset accessed through cBioPortal. Spearman’s rank correlation (rp) was determined and corresponding P (Ps) value reported. (C-E) siRNA knockdown of ABCA1 in murine BMDMs followed by co-culture with activated T cells resulted in decreased expression genes associated with cytotoxic T cell activation or function: Ifnγ, Gzmb and Prf1. Different letters denote statistical significance (P<0.05, Student’s T Test). (F-H) mRNA expression of IFNγ, GZMB and PRF1, markers of cytotoxic T cell activation/activity, were positively correlated with ABCA1 expression. Data obtained from the METABRIC dataset accessed through cBioPortal. rp and Ps reported. (I-R) Human breast tumor tissue microarrays (TMAs) were co-stained for ABCA1, the pan-myeloid cell marker CD11B, the cytotoxic T cell marker CD8, and the nuclear stain DAPI, in a mIF assay. Staining intensity as well as % cells positive for each stain was quantified. (I) Representative TMA image shown. (K) There is a positive correlation between ABCA1 and CD8 staining intensity (rs =0.1853, Ps<0.0001, data shown in Supplementary Fig. 5B&D). Here, data is parsed based on ABCA1 expression into the lower three quartiles and higher quartile, indicating that the mean CD8 intensity was higher in the highest ABCA1 quartile (different letters indicate statistical significance; P<0.05, Student’s T Test). (L) There is a positive correlation between the percentage of CD11B+ cells also expressing ABCA1, and the percentage of CD8 positive cells (rs =0.2183, Ps<0.0001, data shown in Supplementary Fig. 5C&E). Here, data is parsed based on ABCA1 expression into the lowest quartile and highest three quartiles, indicating that the percentage of CD8 positive cells was higher in the highest ABCA1 quartiles (different letters indicate statistical significance; P<0.05, Mann Whitney test). (M-O) ABCA1 staining intensities were parsed into the lowest and highest quartile and compared to CD8 staining intensity, where different breast cancer subtypes were assessed independently: ERα+, TNBC or HER2+. Significant differences were found for ERα+ (r2=0.1843 Ps=0.0144) and TNBC cases (rs=0.2186, Ps=0.0034), while this analysis was underpowered for HER2+ cases (rp=0.1400, Pp=0.2586). different letters denote statistical significance when comparing these parsed groups (P<0.05, Student’s T Test). Corresponding correlational data can be found in Supplementary Fig. 5F–K. (P-R) The percentage of cells co-staining for CD11B and ABCA1 were parsed into the lowest and highest quartile and compared to the percentage of CD8+ cells, where different breast cancer subtypes were assessed independently: ERα+, TNBC or HER2+. Significant differences were found for ERα+ (r2=0.3187, Ps<0.0001) and TNBC cases (rs=0.2628, Ps=0.0003), while this analysis was underpowered for HER2+ cases (rs=0.1351, Ps=0.2831). Different letters denote statistical significance when comparing these parsed groups (P<0.05, Mann Whitney test except for R where a Students T test was used). Corresponding correlational data can be found in Supplementary Fig. 5L–Q.
Figure 7:
Figure 7:. Loss of ABCA1 in macrophages associated changes in gene expression and chromatin accessibility, and an altered phosphoproteome, implicating PI3K and AKT signaling.
(A) RNA-seq and ATAC-seq was performed on BMDMs that had been transfected with control or siRNA against ABCA1. A heatmap of differentially expressed genes (DEGs) is displayed to the left of an MDS plot indicating separation between the groups in two dimensions of transcriptional space. (B) Gene ontology (GO) analysis of pathways enriched after knockdown of ABCA1, indicating increased enrichment for genes associated with membrane initiated signaling such as the PI3K-AKT pathway. Further GO and KEGG pathway analyses are shown in Supplementary Figs. 6 & 7. ATAC-seq analyses are shown in Supplementary Figs. 8–10. (C) A phospho-protein array compared control versus siABCA1. Significantly different ratios between the phospho-protein and parental protein shown as a heatmap. (D) Treatment of BMDMs with alpelisib (PI3K inhibitor) or capivasertib (pan-AKT inhibitor) attenuated the subsequent inhibition of CD8+ T cell expansion when ABCA1 was knocked out. Different letters denote statistically significant differences for division 3. (E) Treatment of BMDMs with alpelisib or capivasertib attenuated the subsequent inhibition of anti-cancer cytotoxic T cell activity when ABCA1 was knocked out. Experimental setup outlined in Fig. 5H. Different letters denote statistical significance (P<0.05, 1-Way ANOVA followed by Šidák’s posthoc). (F) Neither treatment of BMDMs with an AKT1-selective inhibitor (A-674563) or and AKT2-selective inhibitor (CCT128930) were able to reverse the effects of siRNA-mediated loss of ABCA1 on anti-cancer cytotoxic T cell activity. Experimental setup outlined in Fig. 5H. Different letters denote statistical significance (P<0.05, 1-Way ANOVA followed by Šidák’s posthoc). (G-I) Anti-cancer cytotoxic T cell activity after co-culture with BMDMs from control ABCA1+/+;LysMCre+ mice or BMDMs lacking ABCA1 (from ABCA1fl/fl;LysMCre+ mice), transfected with control or siRNA against AKT1, AKT2 or AKT3. Experimental setup outlined in Fig. 5H. Different letters denote statistical significance (P<0.05, 1-Way ANOVA followed by Šidák’s posthoc). (J) Efferocytosis by BMDMs treated with alpelisib or capivasertib. Different letters denote statistical significance (P<0.05, 1-Way ANOVA followed by Šidák’s posthoc). (K) Efferocytosis by BMDMs treated with A-674563 or CCT128930 (AKT1 or 2 inhibitors respectively). Different letters denote statistical significance (P<0.05, 1-Way ANOVA followed by Šidák’s posthoc).
Figure 8:
Figure 8:. Myeloid cell loss of ABCA1 results in increased tumor and metastatic outgrowth in syngeneic murine models.
(A) “Cell therapy” with BMDMs transfected with either control or siRNA against ABCA1 were grafted into mice bearing 4T1 mammary tumors. Experimental design is shown (generated and adapted from BioRender). (B) Resulting tumor weights are shown (P<0.05, Student’s T Test). (C) CD8+ T cells were less abundant in tumors from mice grafted with siABCA1 BMDMs, as assessed by flow cytometry. (D) E0771 primary, orthotopic, mammary tumors grew at an increased rate in mice lacking MC-expression of ABCA1 compared to ABCA1-replete mice (ABCA1fl/fl;LysMCre+ vs. ABCA1+/+;LysMCre+ mice respectively). Tumor volumes as measured by calipers through time are presented to the left of final tumor weights at necropsy. (E) CD31+ cells were more abundant in tumors grown in ABCA1fl/fl;LysMCre+ mice, while decreases were observed in (F) CD8+ T cells and (G) cells positive for CD69, a marker of T cell activation CD69. (H) Metastatic burden in the lungs was increased in ABCA1fl/fl;LysMCre+ mice 14 days after intravenous graft of E0771 cells. Representative micrographs presented on the left. Scale bar is 800μm. Yellow arrows depict metastatic lesions. Mean total lesion volumes (metastatic burden) quantified and shown on the right. (I) CD31+ cells were not significantly increased in tumors lacking MC expression of ABCA1, but (J) CD8+ T cells and (K) CD69+ cells were decreased. (L) Time to detection of a tumor by palpation was significantly decreased and (M) subsequent tumors grew faster when B16-F10 melanoma cells were grafted in ABCA1fl/fl;LysMCre+ mice compared to control ABCA1+/+;LysMCre+ mice. Asterisks or different letters denote statistically significant differences.

References

    1. Schmid P, Cortes J, Dent R, Pusztai L, McArthur H, Kummel S, et al. Event-free Survival with Pembrolizumab in Early Triple-Negative Breast Cancer. The New England journal of medicine. 2022;386(6):556–67. - PubMed
    1. Polk A, Svane IM, Andersson M, and Nielsen D. Checkpoint inhibitors in breast cancer - Current status. Cancer Treat Rev. 2018;63:122–34. - PubMed
    1. Swoboda A, and Nanda R. Immune Checkpoint Blockade for Breast Cancer. Cancer Treat Res. 2018;173:155–65. - PMC - PubMed
    1. Wang Y, Bendre SV, Krauklis SA, Steelman AJ, and Nelson ER. Role of protein regulators of cholesterol homeostasis in immune modulation and cancer pathophysiology. Endocrinology. 2025;Accepted. - PMC - PubMed
    1. Shahoei SH, and Nelson ER. Nuclear receptors, cholesterol homeostasis and the immune system. J Steroid Biochem Mol Biol. 2019;191:105364. - PMC - PubMed

Publication types