[Preprint]. 2025 Feb 17:2025.02.12.637954.
doi: 10.1101/2025.02.12.637954.

Coordinated macrophage and T cell interactions mediate response to checkpoint blockade in colorectal cancer

Affiliations

Coordinated macrophage and T cell interactions mediate response to checkpoint blockade in colorectal cancer

Guillaume Mestrallet et al. bioRxiv. .

Abstract

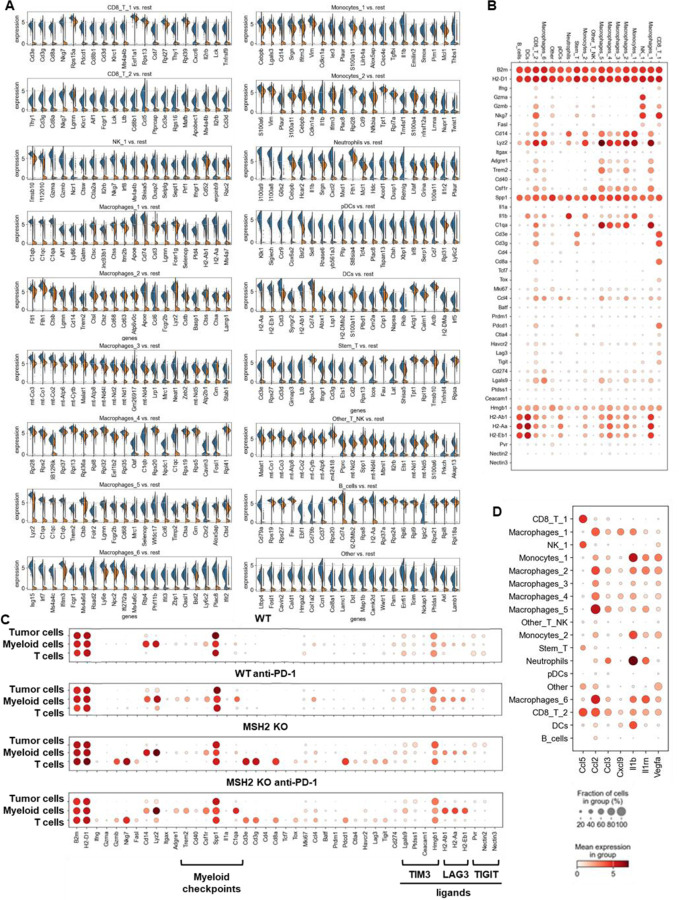
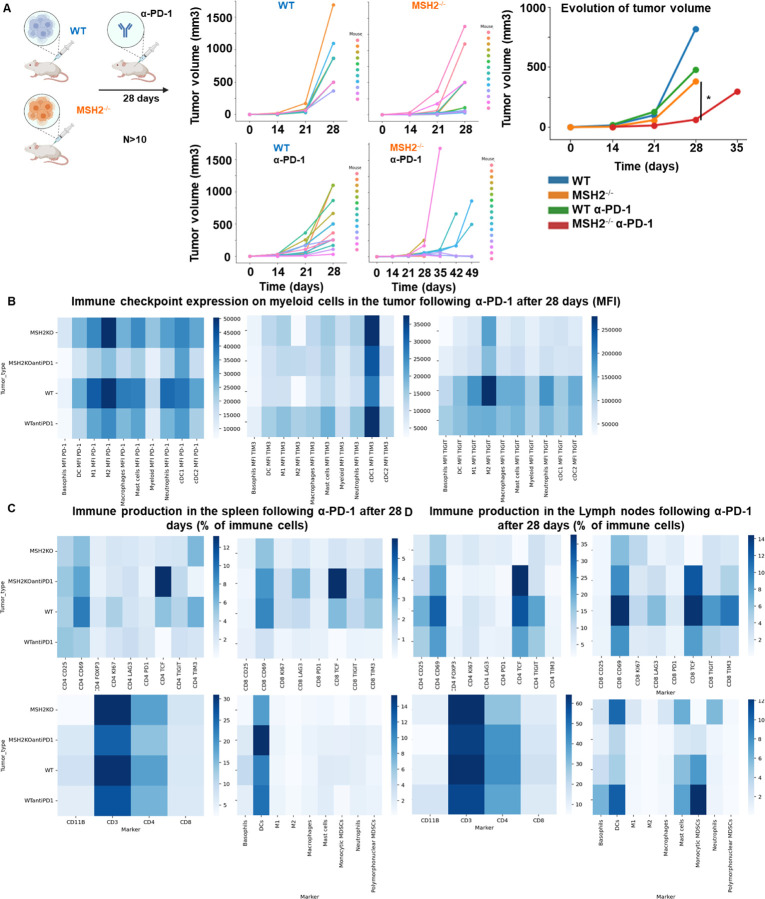
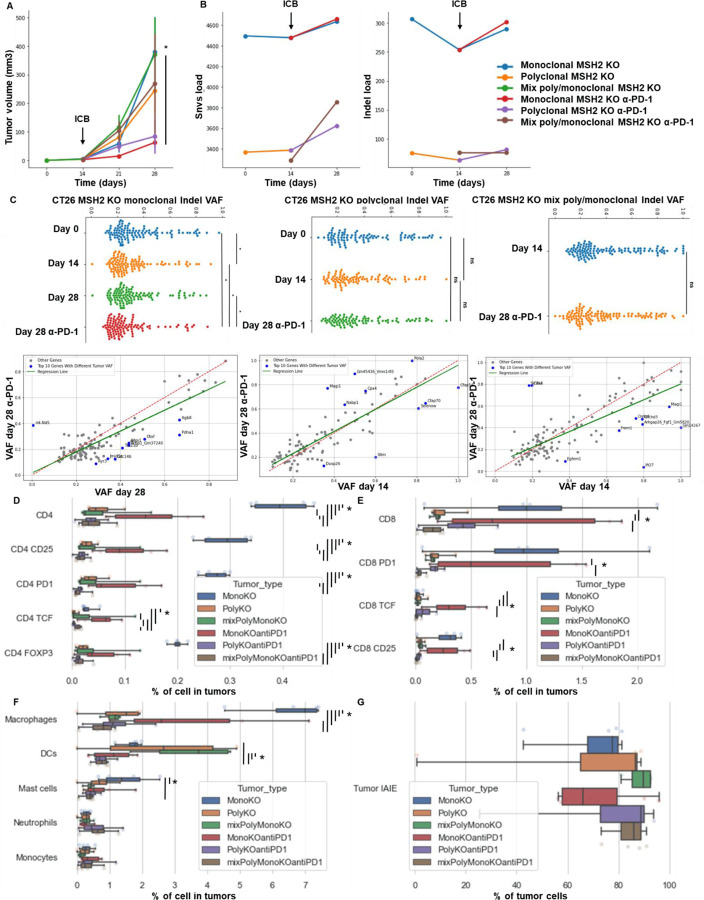
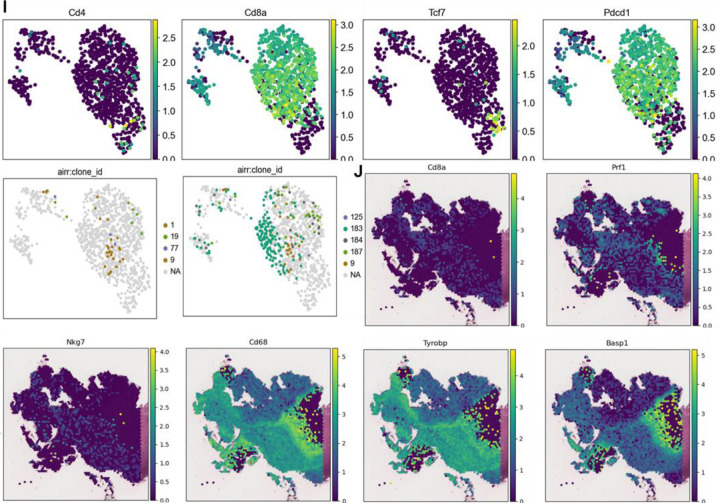
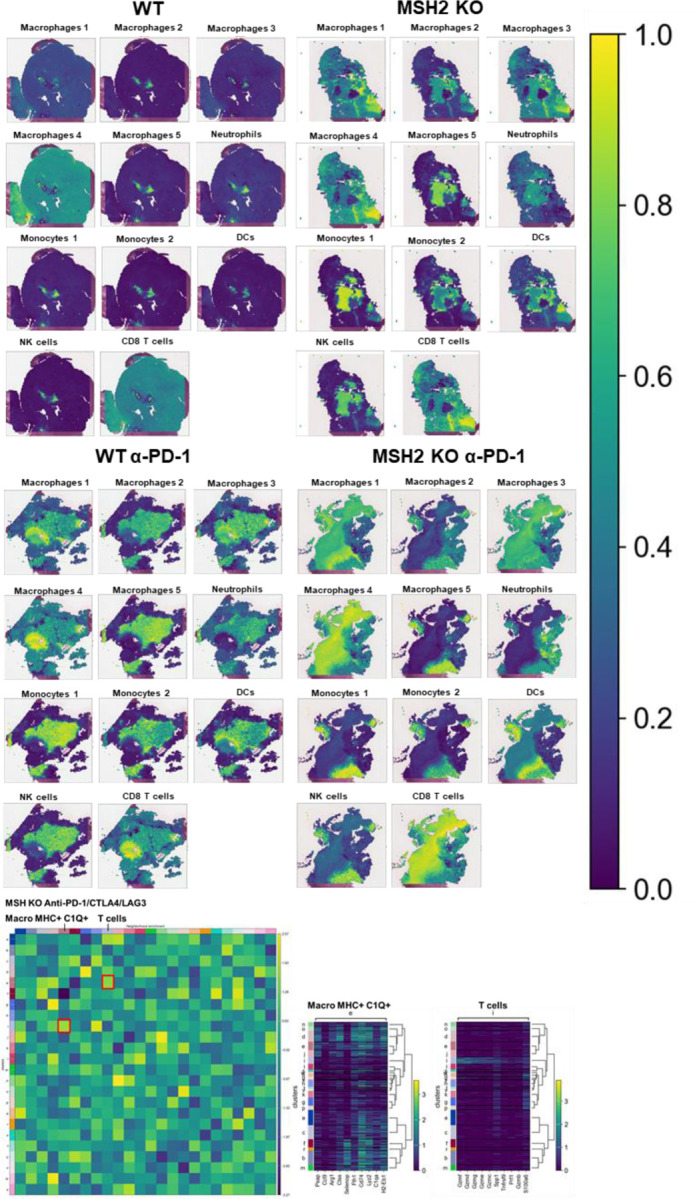
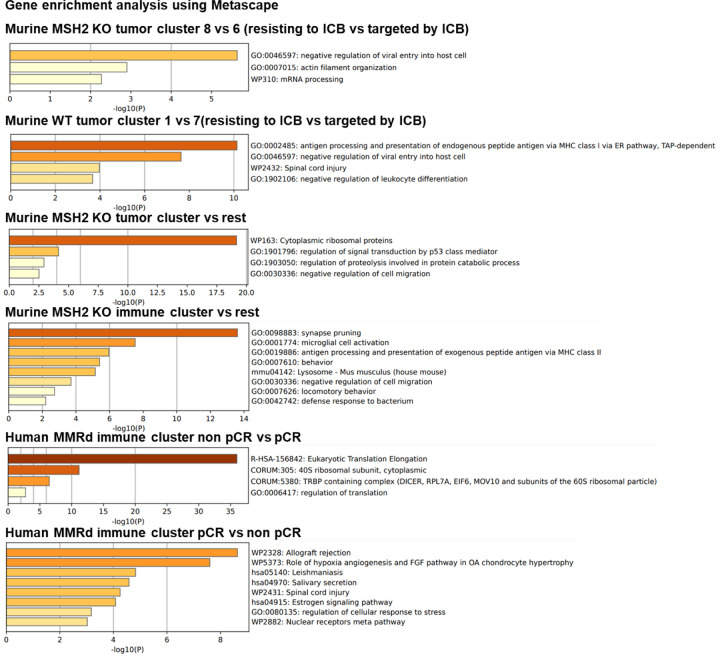
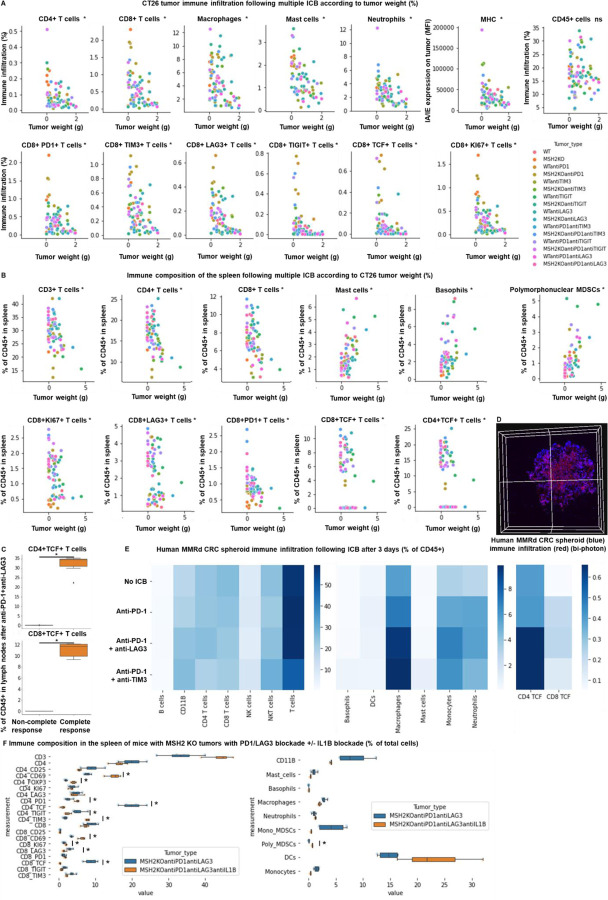
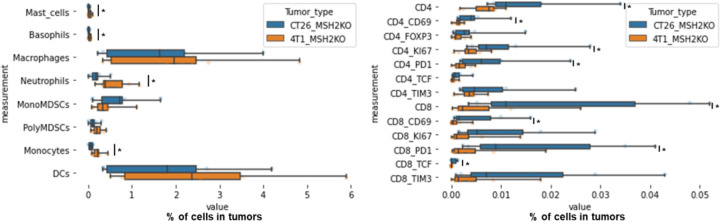
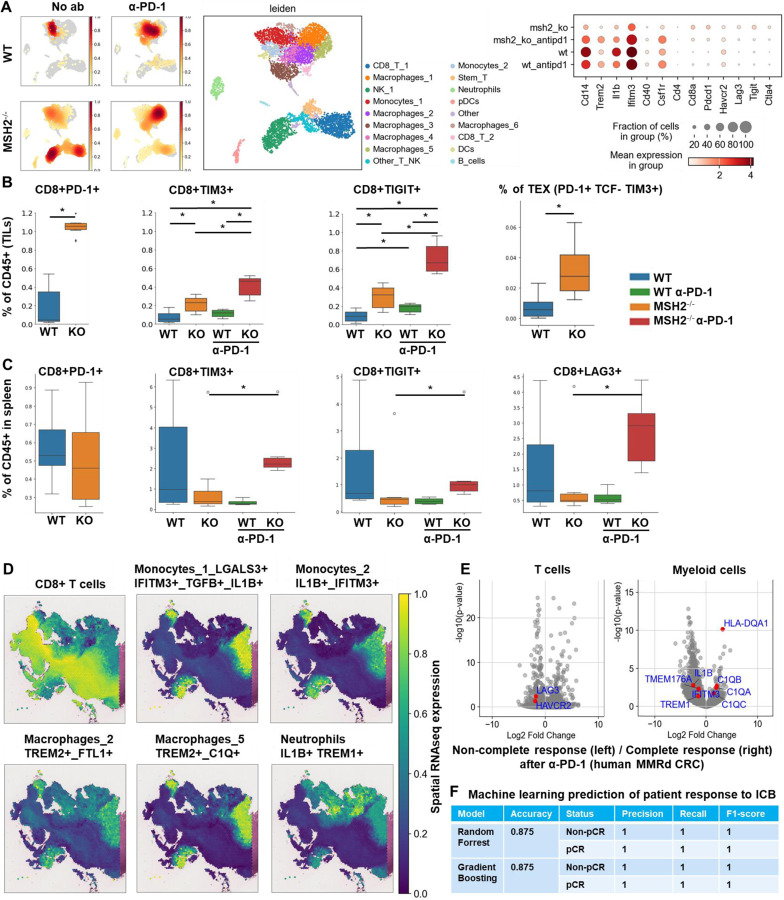
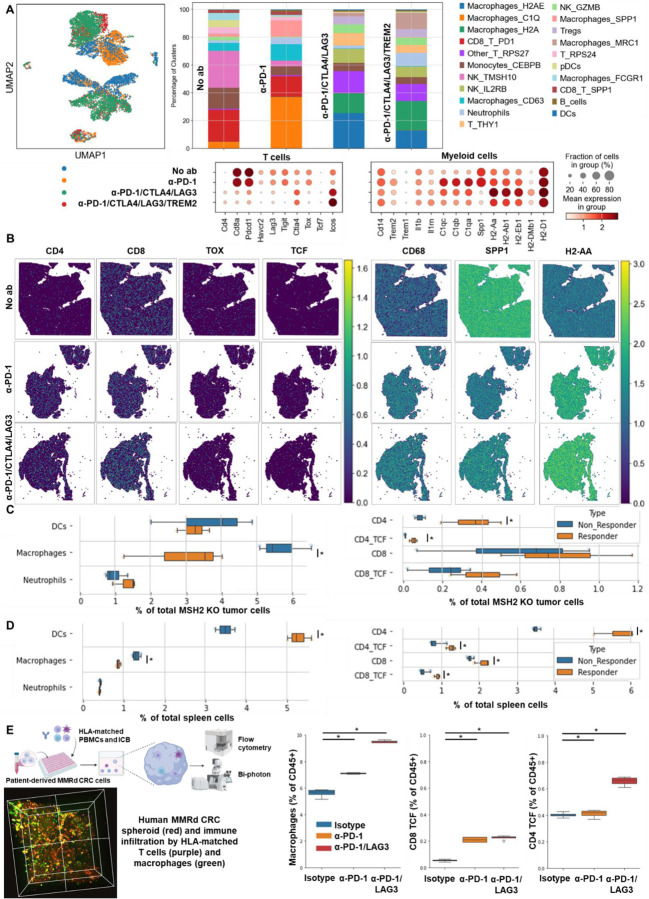
Mismatch repair deficiency (MMRd), either due to inherited or somatic mutation, is prevalent in colorectal cancer (CRC) and other cancers. While anti-PD-1 therapy is utilized in both local and advanced disease, up to 50% of MMRd CRC fail to respond. Using animal and human models of MMRd, we determined that interactions between MHC+ C1Q+ CXCL9+ macrophages and TCF+ BHLHE40+ PRF1+ T cell subsets are associated with control of MMRd tumor growth, during anti-PD-1 treatment. In contrast, resistance is associated with upregulation of TIM3, LAG3, TIGIT, and PD-1 expression on T cells, and infiltration of the tumor with immunosuppressive TREM2+ macrophages and monocytes. By combining anti-PD-1 with anti-LAG3/CTLA4/TREM2, up to 100% tumor eradication was achieved in MMRd CRC and remarkably, in >70% in MMRp CRC. This study identifies key T cell and macrophage subsets mediating the efficacy of immunotherapy in overcoming immune escape in both MMRd and MMRp CRC settings.

Keywords: CTLA-4; LAG3; Mismatch repair deficiency; PD-1; TREM2; immune resistance.


Conflict of interest statement

Declaration of Interests M.B. is a Parker Scholar with the Parker Institute for Cancer Immunotherapy. R.S. is a co-inventors on a patent (US11230599/EP4226944A3) filed by MSKCC for using TMB to predict immunotherapy response, licensed to Personal Genome Diagnostics (PGDx). N.B. is an extramural member of the Parker Institute for Cancer Immunotherapy. N.B. received research support from Harbour Biomed Sciences, stock option from BreakBio, serves as Advisor/Board Member at Curevac, serves as Advisor/Board Member and received stock option from Genotwin and DC Prime, serves as Advisor/Board Member and received equity from Cell BioEngines, received hold stocks from Barinthus, serves as consultant and grant recipient at Merck Research Laboratories, received a drug product from Oncovir and serves at scientific advisory board and received stock options from Aikium. The other authors have not declared any competing interests.

Figures

Extended Figure 1)
Extended Figure 1). Effect of the TME on MSH2 KO tumor development.
A 10,000 WT CT26 thawed cells were used per spheroid in a 96 well plate. B After 1,2,3,4 and 7 days, roundness, circularity and area of CT26 spheroids were measured using ImageJ software. N=6 replicates. C MSH2 was deleted in CT26 and B16F10 cells using Crispr and cell lines were subcloned. Western Blot to assess MSH2 deletion was performed using anti-Bactin antibody (Abcam, clone 8226), anti MSH2 antibody (Thermo Scientific, clone FE11) and anti-mouse secondary antibody (Thermo Scientific, clone A28177). N=3 D 10,000 WT or MSH2 KO CT26 cells were used per spheroid in a 96 well plate. E After 3 days, roundness, circularity and area were measured using ImageJ software. N=6 replicates. F 10,000 CT26 cells were used per spheroid in a 96 well plate. G After 28 days, the area was measured using ImageJ software. N=6 replicates. H 200,000 CT26 tumors, either deleted or not for MSH2, were allowed to grow for 28 days in BALB/C mice. Tumor volume during growth (in mm3). N= 7 to 27. I Tumor engraftment rate (in %). N= 26 to 48. Mann-Whitney U Test was used for all comparisons, and the difference was deemed significant if p value<0.05.
Extended Figure 2)
Extended Figure 2). Immune landscape of MSH2 KO and WT tumors and spheroids, spleen and lymph nodes.
CT26 tumors deleted or not for MSH2 are growing for 28 days in BALB/C mice. A Quantification of differential immune checkpoint expression and immune infiltration according to the MSI status after 14 days and 28 days. N=6 replicates, Mann-Whitney U Test, p value<0.05 B Immune checkpoint expression on tumor infiltrating myeloid cells after 28 days. C MHC and PD-L1 expression by tumor cells after 28 days. D/E Immune production in the spleen/lymph nodes of mice injected by WT and MSH2 KO tumors after 28 days. F CT26 spheroid deleted for MSH2 are growing for 28 co-cultured with immune cells for 3 days. Splenocytes immune cells are previously labeled by cell tracker (red). Spheroid cell nuclei are labeled with Nunc blue (blue). 3D Bi-photon imaging. G 10,000 CT26 cells deleted or not for MSH2 are growing for 3 days as spheroids and 100,000 PBMC from 3 spleens are activated with IL-15. Then, spheroids and PBMC are incubated for 3 days. Flow cytometry staining of spheroids after dissociation. Quantification of differential immune checkpoint expression and lymphocyte infiltration according to the MSH2 status. N=6. Mann-Whitney U Test, p value<0.05
Extended Figure 3)
Extended Figure 3). Single cell analysis of immune cells in CT26 WT and MSH2 KO tumor with or without anti-PD-1 therapy.
ScRNASeq of immune cells in CT26 WT and MSH2 KO tumor with or without anti-PD-1 therapy. A More significantly upregulated genes in each immune cluster (Wilcoxon test). B Immune checkpoint and myeloid immunosuppressive molecule expression in each immune cluster. C Single cell analysis of WT and MSH2 KO tumor and immune cells after 28 days, with or without anti-PD-1 therapy. D cytokine production by immune cells. N=3 tumors per condition.
Extended Figure 4)
Extended Figure 4). Immune infiltration in MMRd UCEC and COAD human tumors.
A CIBERSORT TCGA analysis of UCEC (N = 528 patients) and COAD (N = 442 patients) tumor infiltration by immune cells. Mann-Whitney U Test, p value<0.05 B Indel neoantigen load and Non-silent mutation rate in COAD and UCEC TCGA cohorts on CRI iAtlas. C Pearson correlations between immune cell proportion and DNA alteration parameters in CRI iAtlas TCGA UCEC (N = 543 patients) and COAD (N = 445 patients) cohort.
Extended Figure 5)
Extended Figure 5). Single cell RNAseq analysis of immune cells in MMRd CRC patients that responded or not to anti-PD-1 therapy.
We reanalyzed human MMRd CRC patient data previously published [Jianxia Li et al, Cancer cell 2023] with a focus on patients that completely responded or not to anti-PD-1 therapy and the underlying T cell and macrophage profiles. A More significantly upregulated genes in immune cells in patients that responded or not to anti-PD-1 therapy (Wilcoxon test). B ScRNAseq UMAP of immune cells in patients that responded or not to anti-PD-1 therapy. C Density UMAP of immune cells in patients that responded or not to anti-PD-1 therapy. D UMAP of immune clusters following leiden clustering by scanpy. E More significantly upregulated genes in each immune cluster. F/G Immune checkpoint and myeloid immunosuppressive molecule expression in each immune cluster. H/I Percentage/number of cells in each immune cluster.
Extended Figure 6)
Extended Figure 6). Immune landscape of MSH2 KO and WT tumors, spleen and lymph nodes after anti-PD-1 therapy.
A CT26 tumors deleted or not for MSH2 are growing for 28 days in BALB/C mice, with or without anti PD-1 twice a week after 14 days. B Immune checkpoint expression on tumor infiltrating myeloid cells after 28 days following anti-PD-1. C/D Immune production in the spleen/lymph nodes of mice injected by WT and MSH2 KO tumors after 28 days following anti-PD-1. N=6 replicates, Mann-Whitney U Test, p value<0.05
Extended Figure 7)
Extended Figure 7). High indel and snv loads and infiltration by TCF+ CD4+ and CD8+ T cells correlate with longitudinal response to ICB and immunoediting.
Monoclonal or polyclonal CT26 tumors deleted for MSH2 are growing for 28 days in BALB/C mice, with or without anti PD-1 twice a week after 14 days. A Tumor volume in vivo over 28 days in the absence or presence of anti-PD-1 (100 μg twice a week after 14 days ) therapy (in mm3). N= 6 to 27, Mann-Whitney U Test, pvalue<0.05. B Indel and snv count with effect on the coding sequence following whole exome sequencing (strelka, varcode). C Quantification of tumor mutational allele frequency changes following ICB. Mann-Whitney U Test, pvalue<0.05. Quantification of D CD4 + T cell, E CD8+ T cell and F myeloid infiltration according to the MSI status and ICB. G Quantification of MHCII expression on tumors. N=4 replicates, Mann-Whitney U Test, pvalue<0.05
Extended Figure 8)
Extended Figure 8). TCRseq analysis paired with scRNAseq analysis on MMRd tumor according to anti-PD-1 therapy.
A scRNAseq clustering on immune cells infiltrating tumors expressing TCRs. B The dataset contains only α/β T-cell receptors. Filtering to exclude all cells that don’t have at least one full pair of receptor sequences and multichain cells. C Clonal expansion, number of cells in each clonotype. D/E Clonotype abundance in each cluster and in each condition. F 10 most abundant V-genes and exact combinations of VDJ genes. G Length distribution of CDR3 regions. H Overexpressed genes in the more abundant clonotypes. I Gene expression in clones shared between different tumor types. J Spatial localization of main CD8 and macrophage clones in MSH2 KO tumors after ICB.
Extended Figure 9)
Extended Figure 9). Spatial RNAseq analysis of immune cells in CT26 WT and MSH2 KO tumor with or without ICB therapy.
Spatial localization of each scRNAseq immune cluster in CT26 WT and MSH2 KO tumor with or without ICB therapy. Neighborhood enrichment was performed using scanpy and squidpy.
Extended Figure 10)
Extended Figure 10). Single cell RNAseq analysis of tumor cells in CT26 WT and MSH2 KO tumor with or without anti-PD-1 therapy.
A ScRNAseq UMAP of tumor cells, after performing exclusion of immune cells, in CT26 WT and MSH2 KO tumor with or without anti-PD-1 therapy, following leiden clustering by scanpy. B More significantly upregulated genes in tumor cells in CT26 WT and MSH2 KO tumor with or without anti-PD-1 therapy (Wilcoxon test). C Density UMAP of tumor cells in CT26 WT and MSH2 KO tumor with or without anti-PD-1 therapy. D/E Percentage/number of cells in each tumor cluster. F More significantly upregulated genes in MSH2 KO tumor cluster resisting anti-PD-1 therapy compared to cluster responding to anti-PD-1 (Wilcoxon test). G More significantly upregulated genes in WT tumor cluster resisting anti-PD-1 therapy compared to cluster responding to anti-PD-1 (Wilcoxon test). H More significantly upregulated genes in WT and MSH2 KO tumor clusters targeted by anti-PD-1 therapy compared to cluster resisting anti-PD-1 (Wilcoxon test) and corresponding gene enrichment analysis with metascape.
Extended Figure 11)
Extended Figure 11). Gene enrichment analysis in immune and tumor scRNAseq clusters.
Gene enrichment analysis was performed using Metascape in immune and tumor scRNAseq clusters.
Extended Figure 12)
Extended Figure 12). Immune landscape of MSH2 KO and WT spheroids after anti-PD-1 therapy.
A CT26 spheroids deleted for MSH2 are growing for 3 days and then co-cultured with or without immune cells for 3 more days and ICB. Splenocytes immune cells are previously labeled by cell tracker (red). Spheroid cell nuclei are labeled with Nunc blue (blue). 3D bi-photon imaging of spheroid infiltration by immune cells. B 10,000 CT26 cells deleted or not for MSH2 are growing for 3 days as spheroids and 100,000 PBMC from 3 spleens are activated with IL-15. Then, spheroids and PBMC are incubated for 3 days. PBMC were incubated before with anti-PD-1 (10 μg/mL). Flow cytometry staining of spheroids after dissociation. Quantification of differential immune checkpoint expression and lymphocyte infiltration according to the MSH2 status and ICB. N=6. Mann-Whitney U Test, p value<0.05 C Cytokine production in spheroids measured by Luminex (pg/mL). N=4. Mann-Whitney U Test, p value<0.05. D 10,000 B16F10 cells deleted or not for MSH2 are growing for 3 days as spheroids and 100,000 PBMC from 3 spleens are activated with IL-15. Then, spheroids and PBMC are incubated for 3 days. PBMC were incubated before with anti-PD-1 or anti-CTLA4 (10 μg/mL). Flow cytometry staining of spheroids after dissociation. Quantification of differential immune checkpoint expression and lymphocyte infiltration according to the MSH2 status and ICB. N=6. Mann-Whitney U Test, p value<0.05
Extended Figure 13)
Extended Figure 13). Machine-learning to predict ICB outcomes in CRC patients.
Cell paper and KEYNOTE 177 Gastroenterology paper data : n = 29 patients ,. Responders n = 12. Non-responders n = 17. More A*03:01 in responders vs non-responders (Chi2 = 5.117844498910676, p-value = 0.023681014076523402). No statistical difference for other HLA. More MSIH Status in responders (Chi2 = 6.674496076839828, p-value = 0.00978021596680159). Based on MSI status and A*03:01 data, 5 machine-learning models managed to predict CRC patient response to ICB with an accuracy of 100%.
Extended Figure 14)
Extended Figure 14). Impact of targeted multiple checkpoint combinations on MMRd tumor growth.
Tumor volume in vivo over time of CT26 (A) and 4T1 (B) WT and MSH2 KO cells (200,000 cells/tumor) in the absence or presence of anti-PD-1, anti-TIM3, anti-LAG3, anti-TIGIT or anti CTLA4 (100 μg twice a week after 14 days ) therapy (in mm3). N= 5 to 20 per arm. Mann-Whitney U Test, p value<0.05.
Extended Figure 15)
Extended Figure 15). Myeloid and T cell targeting therapeutic combinations overcome resistance in both MMRd and MMRp tumors and elicit robust immune memory.
A/C/F/H Tumor volume (mean) in vivo over time of CT26, B16F10 and 4T1 WT and MSH2 KO cells (200,000 cells/tumor) in the absence or presence of anti-PD-1, anti-TIM3, anti-LAG3, anti-TIGIT, anti-IL1B, anti-TREM2, anti-IFITM or anti CTLA4 (100 μg twice a week after 14 days ) therapy (in mm3). N= 5 to 20 per arm. Mann-Whitney U Test, p value<0.05. B/D/G/I Complete response of CT26, B16F10 and 4T1 WT and MSH2 KO tumors after ICB combinations (%). E After CT26 MSH2 KO tumor elimination following anti-PD-1 + anti-LAG3 therapy, treatment was stopped and a second tumor was inoculated on the opposite flank and its growth was measured for 3 weeks. N= 5. J Percentage of memory T cells in spleens and lymph nodes of mice that rejected or not a CT26 MSH2 KO tumor following anti-PD-1 + anti-LAG3 after 49 days (flow cytometry).
Extended Figure 16)
Extended Figure 16). TCF+ T cells, neutrophils and macrophages orchestrate the response to targeted checkpoint/myeloid combinations.
WT and MSH2 KO CT26 tumors are growing 28 days in absence or presence of anti-PD-1, anti-TIM3, anti-LAG3 or anti-TIGIT (100 μg twice a week after 14 days ) therapy. A Linear regression, intratumoral immune infiltration and according to tumor weight, ICB and MSI status (flow cytometry). B/C Linear regression, immune composition in spleens and lymph nodes according to tumor weight, ICB and MSI status (flow cytometry). N= 79. Mann-Whitney U Test, p value<0.05. D/E 10,000 MMRd CRC patient-derived cells are growing for 3 days as spheroids and 100,000 PBMC from 3 donors are activated with IL-15. Then, spheroids and PBMC are incubated for 3 days. PBMC were incubated before with anti-PD-1, anti-TIM3 and anti-LAG3 (10 μg/mL). D Immune cells are previously labeled by cell tracker (red). Spheroid cell nuclei are labeled with Nunc blue (blue). 3D Bi-photon imaging. E Flow cytometry staining of spheroids after dissociation. Quantification of differential immune checkpoint expression and lymphocyte infiltration according to ICB. N=4. Mann-Whitney U Test, p value<0.05 F Immune composition in spleens of mice with MSH2 KO CT26 tumors according to the addition of PD1/LAG3 blockade +/− IL1B blockade (flow cytometry).
Extended Figure 17)
Extended Figure 17). Impact of targeted multiple checkpoint combinations on MMRd tumor infiltration and immune composition in spleens and lymph nodes.
CT26 and B16F10 WT and MSH2 KO tumors are growing 28 days in absence or presence of anti-PD-1, anti-TIM3, anti-LAG3 or anti-TIGIT (100 μg twice a week after 14 days ) therapy. A/B/E Quantification by flow cytometry of differential immune checkpoint and lymphocyte infiltration expression according to the MSI status and ICB. C/D/F Immune composition in spleens and lymph nodes according to complete response following multiple ICB therapy. Responders are defined as free-tumor mice. N= 4. Mann-Whitney U Test, p value<0.05.
Extended Figure 18)
Extended Figure 18). Immune infiltration of MSH2 KO CT26 and 4T1 tumors.
CT26 and 4T1 tumors deleted or not for MSH2 are growing for 21 days in BALB/C mice. Quantification of differential immune checkpoint and lymphocyte infiltration expression according to the MSI status and ICB. N=8 replicates, Mann-Whitney U Test, p value<0.05
Extended Figure 19)
Extended Figure 19). T cell and monocyte infiltration in human MMRd CRC spheroids
MMRd CRC human spheroids were amplified for 7 days, with n=10,000 CRC cells per spheroid and the Spherotribe kit (Idylle). In parallel, T cells and monocytes from blood were labeled with DeepRed/DeepGreen cell trackers for 30min respectively. Monocytes and T cells were added to spheroids (10,000 monocytes and 100,000 T cells per spheroid). A After 5 days, spheroid size and subsequent immune attraction was evaluated by microscopy and ImageJ. B Spheroid infiltration by monocytes and T cells and 3D aggregate formation were shown with BiPhoton. C Murine T cell phenotype and MMRd spheroid killing following coculture with MonoMacs from tumor or LN of mice bearing CT26 MSH2 KO tumors treated with anti-PD-1 or anti-PD-1/LAG3/CTLA4/TREM2. N= 4 replicates, Mann-Whitney U Test, p value<0.05
Figure 1)
Figure 1). MMRd tumors responding to anti-PD-1 are highly infiltrated by MHC+ C1Q+ macrophages.
A 200,000 CT26 tumors, either deleted or not for MSH2, were allowed to grow for 28 or 35 days in BALB/C mice, with or without anti-PD-1 administered twice a week after 14 days. B/C Quantification of differential lymphocyte infiltration expression according to the MSI status and ICB through spectral flow cytometry. (N = 6 replicates, Mann-Whitney U Test, p-value < 0.05). D ScRNAseq UMAP of immune cells in CT26 WT and MSH2 KO tumors with or without anti-PD-1 therapy. E UMAP of immune clusters subsequent to Leiden clustering by scanpy. Percentage of cells in each immune cluster. F Gene expression within each immune cluster. G/H/I/J We reanalyzed human MMRd CRC patient data previously published , focusing on patients who responded or did not respond to anti-PD-1 therapy alone, and the underlying T cell and macrophage profiles. G ScRNAseq UMAP of immune cells in patients who responded (pCR) or did not respond (non-pCR) to anti-PD-1 therapy. H UMAP of immune clusters subsequent to Leiden clustering by scanpy. I Percentage of cells in each immune cluster. J Gene expression within each immune cluster.
Figure 2)
Figure 2). A high diversity of CCL5+ PRF1+ T cell clones, DCs and MHC+ C1Q+ macrophages colocalize in MMRd tumors responding to anti-PD-1.
200,000 CT26 tumors, either deleted or not for MSH2, were allowed to grow for 28 or 35 days in BALB/C mice, with or without anti-PD-1 administered twice a week after 14 days. A ScTCRseq UMAP of immune cells in CT26 WT and MSH2 KO tumors with or without anti-PD-1 therapy. UMAP of immune clusters subsequent to Leiden clustering by scanpy and clonal expansion of T cell clones. B Identification of T cell clones, number of cells in each clonotype for each tumor type and gene expression within each main T cell clone (clone of interest : blue vs other clones : orange). C Number of T cell clones according to ICB status. D Overexpressed genes in T cell, macrophages and DCs scRNAseq data (cluster of interest : blue vs others clusters : orange). E Spatial localization of each single-cell immune cluster in MSH2 KO tumors with anti-PD-1 therapy.
Figure 3)
Figure 3). Immunosuppressive myeloid cells, along with the expression of multiple checkpoints, characterize tumor resistance.
A ScRNAseq UMAP of immune cells was generated, following the exclusion of tumor cells, in both CT26 WT and MSH2 KO tumors, with and without anti-PD-1 therapy. The distribution of cells and immune genes in each tumor cluster is depicted. B/C The quantification of differential immune checkpoint and lymphocyte infiltration expression in tumors (B) and spleens (C), contingent on the MSI status and ICB, is shown through flow cytometry after 28 days. N=6 replicates, Mann-Whitney U Test, p value < 0.05. Data are represented as mean ± SEM. D Spatial localization of each single-cell immune cluster in MSH2 KO tumors with anti-PD-1 therapy. The CD8 panel is the same as in Figure 2 E. E A reanalysis of previously published human MMRd CRC patient data has been conducted, focusing on patients with complete or incomplete responses to anti-PD-1 therapy alone, and scrutinizing the underlying T cell and macrophage profiles. Gene expression within each immune cluster. F RandomForestClassifier and GradientBoosting algorithms trained on a scRNAseq dataset , n=10 MMRd CRC patients. Accuracy = correct predictions / total number of predictions. Precision = correct predictions of a class / all positive true positive and false positive predictions. Recall (Sensitivity) = correct true positive predictions of a class / actual instances of the class. F1-score = harmonic mean of precision and recall.
Figure 4)
Figure 4). Combination of TREM2, LAG3, CTLA4 and PD1 blockade eliminates both MMRd and MMRp tumors and elicit robust immune memory.
A/C/F/H Tumor volume (mean) in vivo over time of CT26, B16F10 and 4T1 WT and MSH2 KO cells (200,000 cells/tumor) in the absence or presence of anti-PD-1, anti-LAG3, anti-TREM2 or anti CTLA4 (100 μg twice a week after 14 days ) therapy (in mm3). N= 5 to 20 per arm. Mann-Whitney U Test, p value<0.05. Data are represented as mean ± SEM. B/D/G/I Complete response of CT26, B16F10 and 4T1 WT and MSH2 KO tumors after ICB combinations (%). E After CT26 MSH2 KO tumor elimination following anti-PD-1 + anti-LAG3 +/− anti-TREM2 therapy, treatment was stopped and a second tumor was inoculated on the opposite flank and its growth was measured for 3 weeks. N= 5. Each curve is for an individual mouse. J Time and number of antibody doses needed to observe complete response and CT26 MSH2 KO tumor elimination.
Figure 5)
Figure 5). TCF+ T cells, CD4+ and CD8+ T cells, neutrophils and MHC+ macrophages orchestrate the response to targeted checkpoint/myeloid combinations.
CT26 tumors deleted for MSH2 are growing for 28 days in BALB/C mice. A ScRNAseq UMAP of immune cells in CT26 MSH2 KO tumors with or without anti-PD-1/CTLA4/LAG3/TREM2 therapy. UMAP of immune clusters subsequent to Leiden clustering by scanpy. Percentage of cells in each immune cluster and gene expression within each immune cluster. B Spatial RNAseq localization of each single-cell immune cluster in MSH2 KO tumors following ICB. C Quantification of differential immune checkpoint and lymphocyte infiltration expression according to response to PD1/LAG3/TREM2 blockade. N=8 replicates, t-Test, p value<0.05 Data are represented as mean ± SEM. Mice with a decrease in tumor volume following therapy are considered as responders. D Immune composition in spleens and lymph nodes was also measured (flow cytometry). N= 8. Mann-Whitney U Test, p value<0.05. Data are represented as mean ± SEM. E 10,000 MMRd CRC patient-derived cells are growing for 3 days as spheroids and 100,000 PBMC from 3 donors are activated with IL-15. Then, spheroids and PBMC are incubated for 3 days. PBMC were incubated before with anti-PD-1, anti-TIM3 and anti-LAG3 (10 μg/mL). Immune cells are previously labeled by cell tracker (red). Spheroid cell nuclei are labeled with Nunc blue (blue). 3D Bi-photon imaging and flow cytometry staining of spheroids after dissociation. Quantification of differential immune checkpoint expression and lymphocyte infiltration according to ICB. N=4. Mann-Whitney U Test, p value<0.05 Data are represented as mean ± SEM.

References

    1. Mestrallet G., Brown M., Bozkus C. C. & Bhardwaj N. Immune escape and resistance to immunotherapy in mismatch repair deficient tumors. Front. Immunol. 14, (2023). - PMC - PubMed
    1. Gryfe R. et al. Tumor microsatellite instability and clinical outcome in young patients with colorectal cancer. N. Engl. J. Med. 342, 69–77 (2000). - PubMed
    1. Yamamoto H. et al. Gastric cancers of the microsatellite mutator phenotype display characteristic genetic and clinical features. Gastroenterology 116, 1348–1357 (1999). - PubMed
    1. Cancer Genome Atlas Network. Comprehensive molecular characterization of human colon and rectal cancer. Nature 487, 330–337 (2012). - PMC - PubMed
    1. Cancer Genome Atlas Research Network et al. Integrated genomic characterization of endometrial carcinoma. Nature 497, 67–73 (2013). - PMC - PubMed

Publication types