[Preprint]. 2025 Feb 17:2025.02.16.638557.
doi: 10.1101/2025.02.16.638557.

Comparative molecular landscapes of immature neurons in the mammalian dentate gyrus across species reveal special features in humans

Affiliations

Comparative molecular landscapes of immature neurons in the mammalian dentate gyrus across species reveal special features in humans

Yi Zhou et al. bioRxiv. .

Update in

Abstract

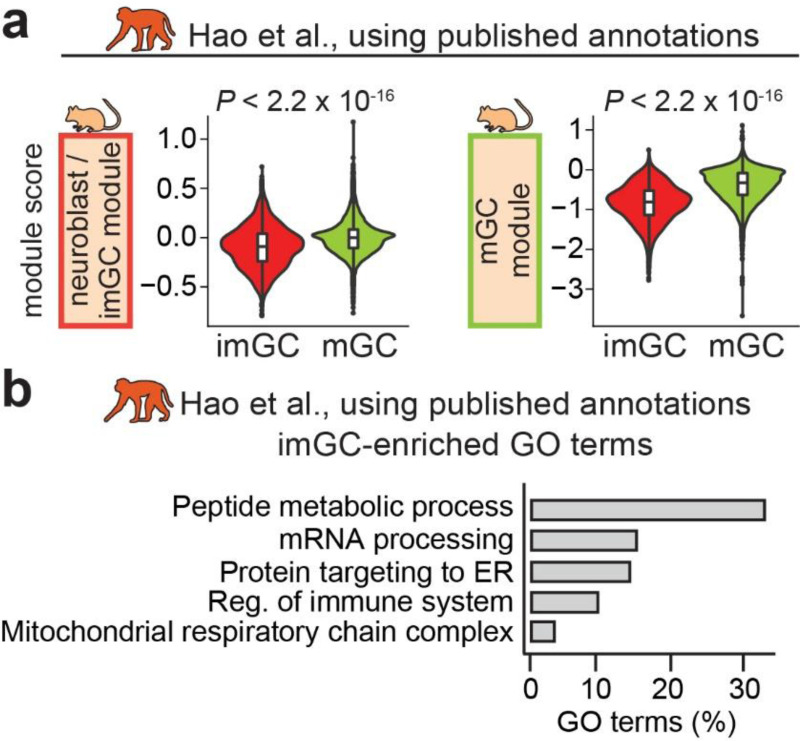
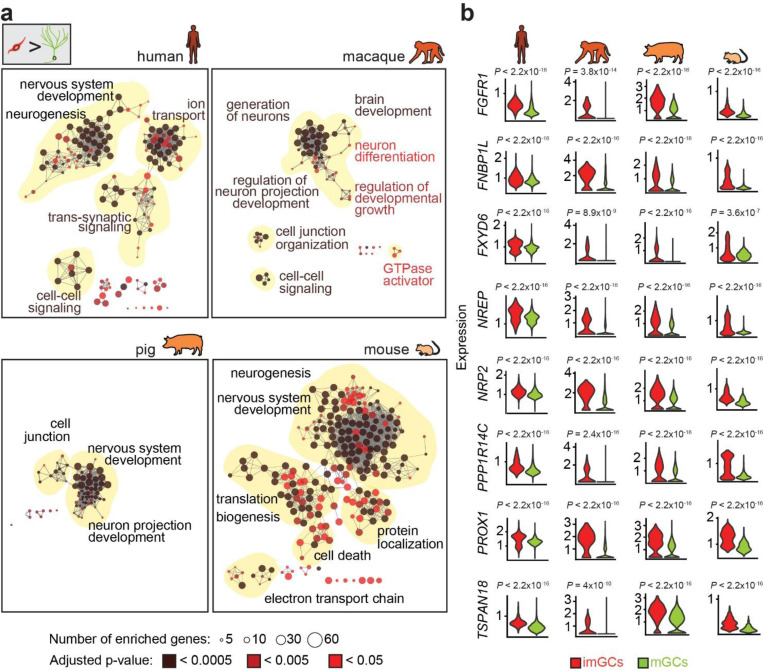
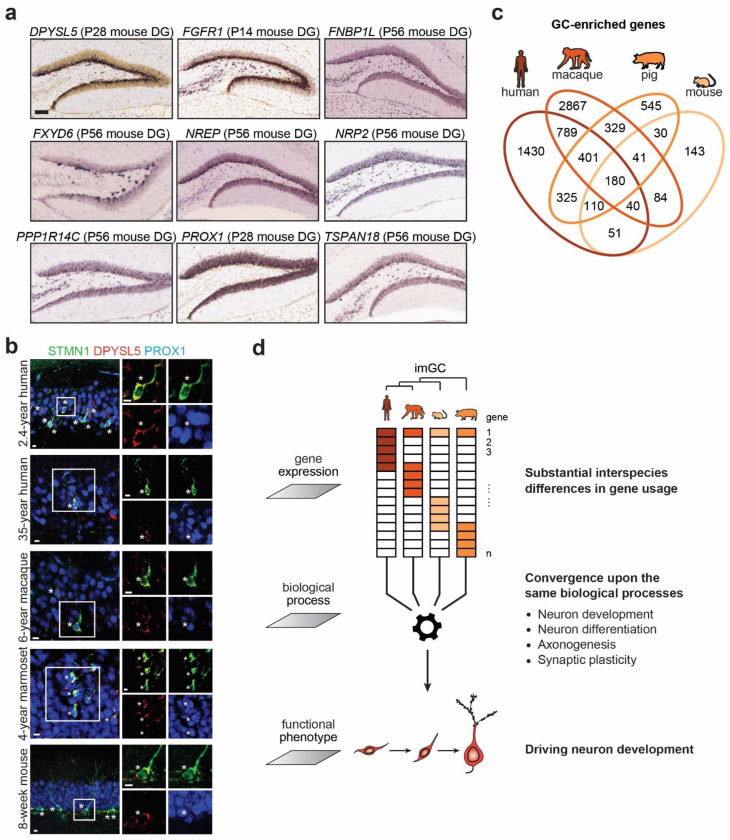
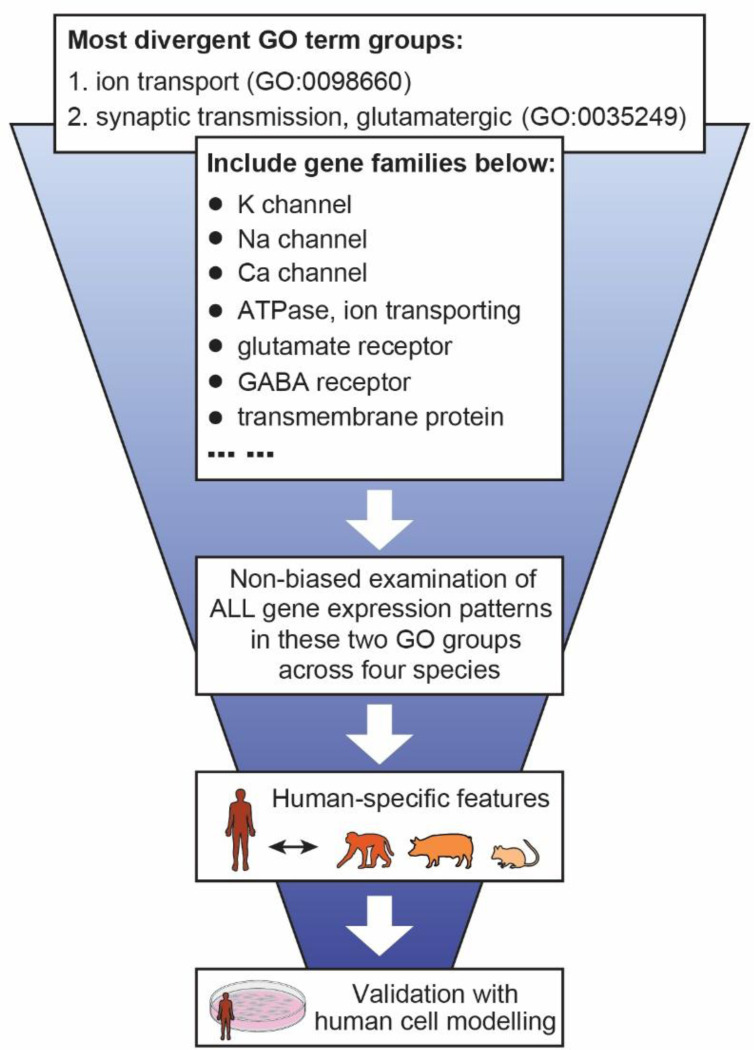
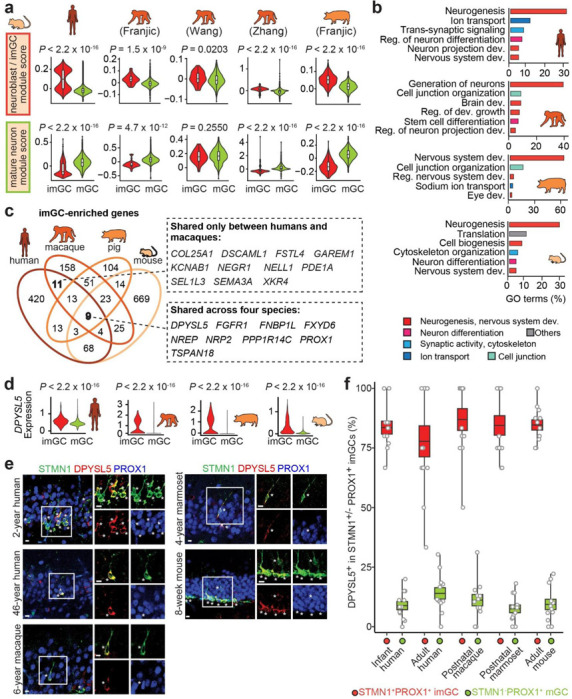
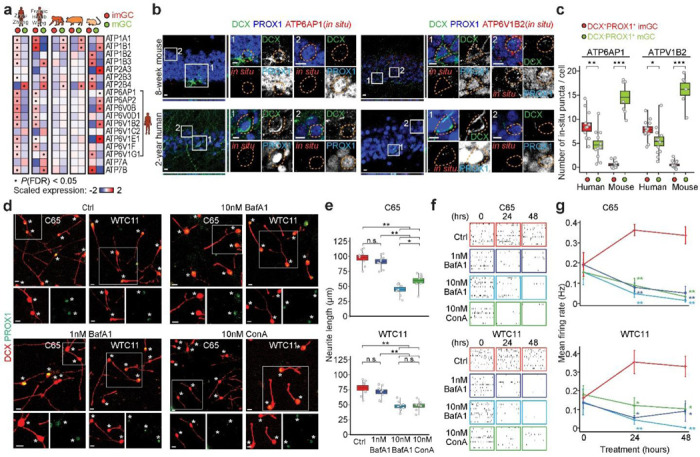
Immature dentate granule cells (imGCs) arising from adult hippocampal neurogenesis contribute to plasticity, learning and memory, but their evolutionary changes across species and specialized features in humans remain poorly understood. Here we performed machine learning-augmented analysis of published single-cell RNA-sequencing datasets and identified macaque imGCs with transcriptome-wide immature neuronal characteristics. Our cross-species comparisons among humans, monkeys, pigs, and mice showed few shared (such as DPYSL5), but mostly species-specific gene expression in imGCs that converged onto common biological processes regulating neuronal development. We further identified human-specific transcriptomic features of imGCs and demonstrated functional roles of human imGC-enriched expression of a family of proton-transporting vacuolar-type ATPase subtypes in development of imGCs derived from human pluripotent stem cells. Our study reveals divergent gene expression patterns but convergent biological processes in the molecular characteristics of imGCs across species, highlighting the importance of conducting independent molecular and functional analyses for adult neurogenesis in different species.

Keywords: adult neurogenesis; cross-species comparison; dentate gyrus; evolution; hippocampus; human-specific feature; immature neuron; machine learning; non-human primate; single-cell RNA sequencing.


Conflict of interest statement

Competing interests The authors declare no competing interests.

Figures

Extended Data Fig. 1 |
Extended Data Fig. 1 |. Identification and molecular characteristics of immature neurons in a published macaque hippocampal single-cell RNA sequencing dataset using traditional unsupervised clustering.
a, Gene module analysis of the previously annotated immature dentate granule cells (imGCs) and mature dentate granule cells (mGCs) in an adult macaque hippocampus single-nucleus RNA sequencing dataset using a well-recognized published list of mouse immature progeny (neuroblast and imGC)-enriched and mGC-enriched genes. b, Top Gene Ontology (GO) term groups for genes enriched in imGCs (using published annotations with traditional unsupervised clustering). Reg., regulation.
Extended Data Fig. 2 |
Extended Data Fig. 2 |. Performance of machine learning model for macaque imGCs and feature extraction and comparison of gene weights defining imGCs in different species.
a, Measuring performance of our machine learning model for macaque datasets. Line plot showing the accuracy score of the machine learning classifier varying with decreasing regularization strength as estimated by cross-validation. Red line shows 95% confidence interval on the estimation of the accuracy score. #Sum abs (coeffs): sum of the absolute value of regression coefficients. b, Heatmap showing expression of top gene weights in top-scoring cells of each prototype determined by our machine learning model for macaque datasets. Genes listed are the top 25 weights defining macaque imGCs. Astro: astrocyte; OPC: oligodendrocyte progenitor cell; mOli: mature oligodendrocyte. c, Venn diagram of the positive gene weights defining imGCs in humans, macaques, and mice that were generated by separate machine learning models (weights for human and mouse imGCs were generated in ref).
Extended Data Fig. 3 |
Extended Data Fig. 3 |. Specificity of our machine learning approach for identification of immature neurons in the macaque brain.
a, The fractions of cells with high similarity scores (p ≥ 0.85) among dentate granule cell (GC), non-GC excitatory neuron, GABAergic interneuron, and non-neuronal cell clusters in various single-cell or single-nucleus RNA sequencing (scRNA-seq) datasets of the macaque hippocampus. Each dot represents data from one specimen from each study (noted by first author’s last name). Note that all imGCs identified reside in the GC clusters. b, No immature neurons identified using our machine learning model in an scRNA-seq dataset of two 6-year macaque neocortex (one male and one female).
Extended Data Fig. 4 |
Extended Data Fig. 4 |. Shared molecular signatures of immature neurons in the hippocampus of different species.
a, GO network of biological processes associated with imGC-enriched genes in different species in comparison to mGCs, coloured by FDR-adjusted p-value. Only significantly enriched nodes are displayed (one-sided hypergeometric test, FDR-adjusted P < 0.05). The node size represents the term enrichment significance. Examples of the most significant terms per group are shown. b, Violin plots showing normalized expression of 8 imGC-enriched genes shared across four species in imGCs and GCs (one-way Wilcoxon rank-sum test). A total of 9 shared genes were identified and 8 are shown here (See Fig. 3d for the plot for the 9th gene, DPYSL5).
Extended Data Fig. 5 |
Extended Data Fig. 5 |. Enrichment of immature neuronal gene features in imGCs of different species.
a, Expression patterns of 9 shared imGC-enriched genes across species in the dentate gyrus (DG) of adult mice, 8 of which show enrichment in the neurogenic subgranular zone (except for PROX1). Images are from the Allen Brain in-situ hybridization database; https://mouse.brain-map.org/. P: postnatal day. b, A second set of sample confocal immunostaining images of DPYSL5 enrichment in imGCs in the hippocampi of infant and adult humans, postnatal macaques and marmosets, and adult mice. Scale bars: 10 μm. Asterisks indicate DPYSL5+ cells among STMN1+PROX1+ imGCs. See Fig. 3e. c, Venn diagram depicting the overlap of GC-enriched genes across different species when compared to other cell types within the same datasets. d, A schematic illustration of our working model. In contrast to the traditional concept that a single genetic variant can drive cross-species cellular innovations in immature neuron regulation, our study revealed substantial interspecies variance in highly expressed genes enriched in imGCs, which converged onto conserved biological processes, suggesting imGCs in different species may recruit and utilize species-unique molecular features to drive similar biological processes regulating neuronal development.
Extended Data Fig. 6 |
Extended Data Fig. 6 |. Features of imGC-enriched genes in different species.
A schematic illustration of the analysis design. To explore species-specific imGC molecular features in a non-biased manner, gene expression patterns of each individual gene associated with “ion transport” and “synaptic transmission”, the two major GO terms showing the most species-specific enrichment, were plotted. See Extended Data Fig. 7.
Extended Data Fig. 7 |
Extended Data Fig. 7 |. Unbiased examination of divergent imGC molecular features across four species.
Red-blue heatmaps depict expression patterns of each individual gene associated with “ion transport” and “synaptic transmission”, the two major GO terms showing the most species-specific enrichment. Exemplary genes in these two categories, such as those encoding various ion channels, glutamate receptors, GABA receptors, ATPases, transmembrane proteins, among others are highlighted with square boxes. The colour bar represents z-scores of gene expression, scaled to range from −2 to 2.
Extended Data Fig. 8 |
Extended Data Fig. 8 |. Role of lysosomal vacuolar-type H+-transporting ATPase in the in vitro human hippocampal immature neuron culture.
a, A schematic illustration of the experimental design. Human induced pluripotent stem cell (iPSC) lines (C65 and WTC11) were differentiated into DCX+PROX1+ hippocampal imGCs prior to treatment with Bafilomycin A1 (BafA1) and Concanamycin A (ConA), two specific blockers against lysosomal vacuolar-type H+-transporting ATPases to measure neurite growth and neuronal activities. b-e, Characterization of hippocampal imGC culture derived from two independent iPSC lines. Sample confocal images (b) and quantification of DCX and PROX1 enrichment in the hippocampal neuron in vitro culture (c, d) and its cell death level (e) with different treatments. Scale bar: 10 μm. Asterisks indicate cleaved Caspase 3 (cCasp3)+DCX+PROX1+ imGCs (b). Box colours match treatment conditions. Dots represent data from individual images; the centre line represents the mean, box edges show s.e.m. and whiskers extend to the maximum and minimum values (n = 3 cultures per condition) (c-e). None of the quantifications were statistically significant using ANOVA post-hoc test (c-e).
Figure 1 |
Figure 1 |. Machine learning-augmented identification and molecular characteristics of immature neurons in macaque hippocampal single-cell RNA sequencing datasets.
a, Schematic illustration of the experimental design. scRNA-seq, single-cell or single-nucleus RNA sequencing; NSC, neural stem cell; IPC, intermediate progenitor cell; NB, neuroblast; GC, dentate granule cell; imGC, immature GC; mGC, mature GC. b, c, Top Gene Ontology (GO) term groups (b) and GO networks (c) of biological processes of the positive gene weights defining macaque imGCs (using annotations based on our machine learning model), coloured by false discovery rate (FDR)-adjusted p-value (c). Only significantly enriched nodes are displayed (one-sided hypergeometric test, FDR-adjusted P < 0.05) (c). The node size represents the term enrichment significance. Examples of the most significant terms per group are shown (c). d, Comparison of positive gene weights defining imGCs in humans, macaques, and mice generated by independent machine learning models for each species, shown on the x-axis (left), y-axis, and x-axis (right), respectively. The machine learning model for macaque imGCs was generated in this study; models for human and mouse imGCs were previously generated. Dot size represents gene expression in macaque imGCs; dot colour shows gene expression in humans or mouse imGCs in the corresponding plots.
Figure 2 |
Figure 2 |. Identification of immature neurons in the postnatal macaque hippocampus across ages and studies.
a, UMAP plots showing all publicly available scRNA-seq datasets of the macaque hippocampus coloured by four broad cell classes (top rows) and by similarity score to prototypical imGCs (bottom rows). Datasets containing multiple specimens from each study (noted by first author’s last name) were integrated and are shown in aggregate. Note that imGCs are only present in the GC cluster. b, Quantification of percentages of imGCs (with similarity score p ≥ 0.85) among all GCs in each macaque hippocampal specimen across ages. Data point shapes match published macaque hippocampal datasets. Cyan points indicate young macaque group (4–6 years); hollow points indicate adult and aging groups (8–15 and 18–21 years, respectively). Data points are fitted with generalized linear model fitting (orange line) and 95% confidence intervals (light grey shaded areas).
Figure 3 |
Figure 3 |. Conserved immature neuronal biological processes with divergent gene expression features in imGCs of different species.
a, Gene module analysis of human, macaque,,, pig imGCs-enriched and mGCs-enriched genes using a published list of mouse immature progeny (neuroblast and imGC)-enriched and mGC-enriched genes (one-way Wilcoxon rank-sum test). b, Top GO term groups for imGC-enriched genes in different species coloured by biological processes. Dev., development; reg., regulation. c, Venn diagram of imGC-enriched genes in different species. Genes shared across the four species and genes shared only between humans and macaques are listed in the boxes. d, Violin plots of normalized expression of DPYSL5 in imGCs and mGCs of different species from published scRNA-seq datasets (one-way Wilcoxon rank-sum test). e, f, Sample confocal immunostaining images (e) and quantification (f) of DPYSL5 expression in STMN1+PROX1+ imGCs and STMN1PROX1+ mGCs in the hippocampi of infant and adult humans, postnatal macaques and marmosets, and adult mice. Scale bar: 10 μm. Asterisks indicate DPYSL5+ cells among STMN1+PROX1+ imGCs (e). Dots represent data from individual sections; the centre line represents the mean, box edges show s.e.m. and whiskers extend to the maximum and minimum values (n = 4, 4, 2, 1, 4 subjects for infant humans, adult humans, macaques, marmosets, and mice, respectively) (f).
Figure 4 |
Figure 4 |. Species-specific enrichment of imGC molecular features.
a, Schematic Venn diagram (top) and bar plots (bottom) of top GO term groups for imGC-enriched genes unique to each species coloured by biological processes. b, Enrichment patterns of brain disorder risk gene expression in imGCs and mGCs of different species (one-sided Fisher’s exact test, FDR-adjusted P < 0.05). AD, Alzheimer’s disease; ASD, autistic spectrum disorders; EPI, epilepsy; MDD, major depressive disorder; SCZ, schizophrenia. c, Red-blue heatmaps depict expression patterns of the risk genes of neurological or psychiatric disorders in imGCs and mGCs across four species. The colour bar represents z-scores of gene expression, scaled to range from −2 to 2.
Figure 5 |
Figure 5 |. Human-enriched hippocampal immature neuron features and functional roles of a family of genes encoding lysosomal vacuolar-type H+-transporting ATPases (v-ATPases) in their development.
a, Expression patterns of genes encoding ATPases in imGCs and mGCs in different species (black dots indicate significant difference with FDR-adjusted P < 0.05 using two-sided Wilcoxon rank sum test). Several previously published scRNA-seq datasets of the human hippocampus (left two columns) were used to ensure consistency across studies in gene expression enrichment patterns–,,. The colour bar represents z-scores of gene expression, scaled to range from −2 to 2. b, c, Sample confocal in-situ hybridization and immunostaining images (b) and quantification (c) of expression of ATP6AP1 and ATP6V1B2, two subunits of v-ATPases, in human and mouse GCs. Orange circles in image sets #1 indicate the presence and absence of ATP6AP1 and ATP6V1B2 in situ puncta signals in human and mouse imGCs (DCX+PROX1+), respectively (b). Orange circles in image sets #2 indicate the absence and presence of ATP6AP1 and ATP6V1B2 in situ puncta signals in human and mouse mGCs (DCXPROX1+), respectively (b). Dots represent data from individual fields of view; the centre line represents the mean, box edges show s.e.m. and whiskers extend to the maximum and minimum values (c) (n = 2 subjects each for humans and mice; Student’s t-test, * P < 0.05, ** P < 0.005, *** P < 0.0005). d, e, Sample confocal immunostaining images (d) and quantification (e) of neurite length of DCX+PROX1+ imGCs derived from two independent human iPSC lines. In vitro culture was treated with Bafilomycin A1 (BafA1) and Concanamycin A (ConA), two specific blockers against v-ATPases for 24 hours (hrs). See Extended Data Fig. 8a. Asterisks indicate DCX+PROX1+ imGCs (d). Scale bar, 10 μm (d). Box colours match treatment conditions. Dots represent data from individual images; the centre line represents the mean, box edges show s.e.m. and whiskers extend to the maximum and minimum values (n = 3 cultures per condition). One-way ANOVA with post-hoc Tukey HSD test, * P < 0.05, ** P < 0.005 (e). f, g, Sample raster plots (f) and quantification (g) of neuron firing rate of hippocampal imGCs using multi-electrode array assay with or without drug treatments. See Extended Data Fig. 8a. Values represent mean ± s.e.m. (n = 3 per condition; one-way ANOVA with post-hoc Tukey HSD test was used to compare among treatment conditions, * P < 0.05 or ** P < 0.005 when compared to the DMSO control group (Ctrl), and all other pair-wise comparisons were not significant).

References

    1. Gage F. H. Adult neurogenesis in mammals. Science 364, 827–828, doi: 10.1126/science.aav6885 (2019). - DOI - PubMed
    1. Ming G. L. & Song H. Adult neurogenesis in the mammalian brain: significant answers and significant questions. Neuron 70, 687–702, doi: 10.1016/j.neuron.2011.05.001 (2011). - DOI - PMC - PubMed
    1. Bergmann O., Spalding K. L. & Frisen J. Adult Neurogenesis in Humans. Cold Spring Harb Perspect Biol 7, a018994, doi: 10.1101/cshperspect.a018994 (2015). - DOI - PMC - PubMed
    1. Denoth-Lippuner A. & Jessberger S. Formation and integration of new neurons in the adult hippocampus. Nature reviews. Neuroscience 22, 223–236, doi: 10.1038/s41583-021-00433-z (2021). - DOI - PubMed
    1. Kempermann G., Song H. & Gage F. H. Adult neurogenesis in the hippocampus. Hippocampus 33, 269–270, doi: 10.1002/hipo.23525 (2023). - DOI - PMC - PubMed

Publication types

LinkOut - more resources