

Identification of potential diagnostic targets and therapeutic strategies for anoikis-related biomarkers in lung squamous cell carcinoma using machine learning and computational virtual screening
- PMID: 40028162
- PMCID: PMC11868076
- DOI: 10.3389/fphar.2025.1500968
Identification of potential diagnostic targets and therapeutic strategies for anoikis-related biomarkers in lung squamous cell carcinoma using machine learning and computational virtual screening
Abstract
Objective: Lung squamous cell carcinoma (LUSC) is a common subtype of non-small cell lung cancer (NSCLC) characterized by high invasiveness, high metastatic potential, and drug resistance, resulting in poor patient prognosis. Anoikis, a specific form of apoptosis triggered by cell detachment from the extracellular matrix (ECM), plays a crucial role in tumor metastasis. Resistance to anoikis is a key mechanism by which cancer cells acquire metastatic potential. Although several studies have identified biomarkers related to LUSC, the role of anoikis-related genes (ARGs) remains largely unexplored.
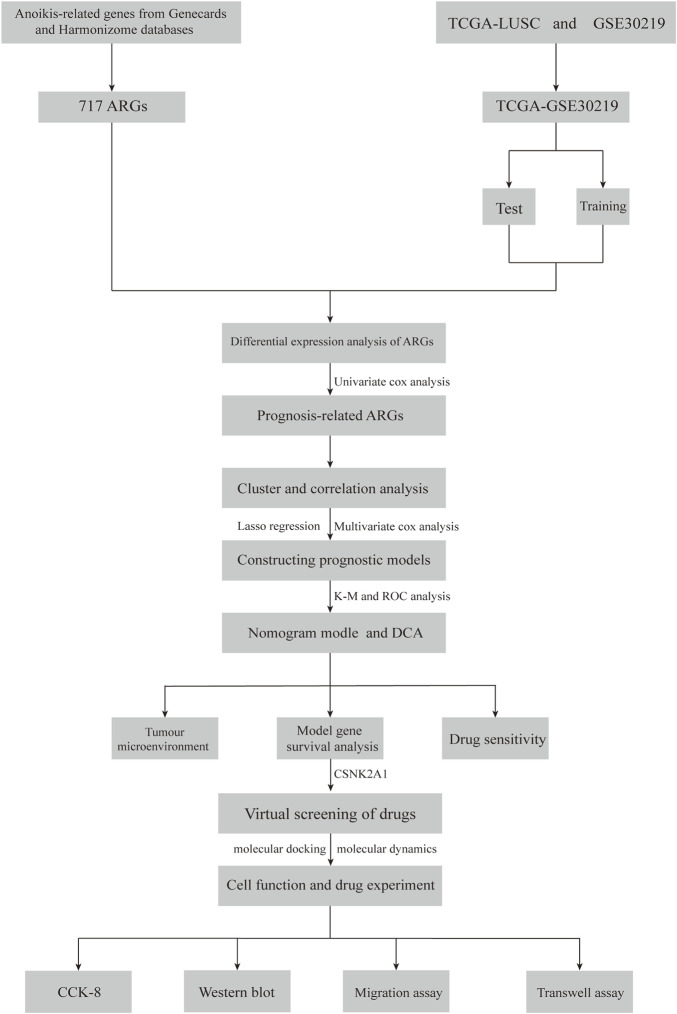
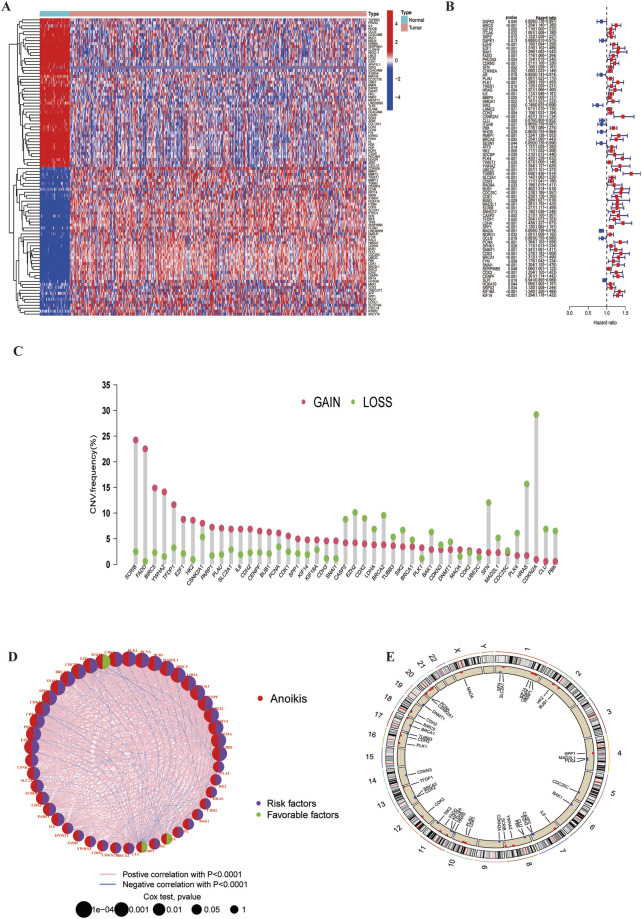
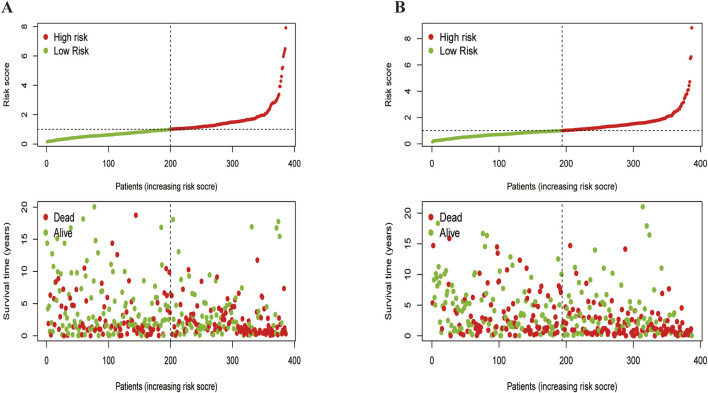
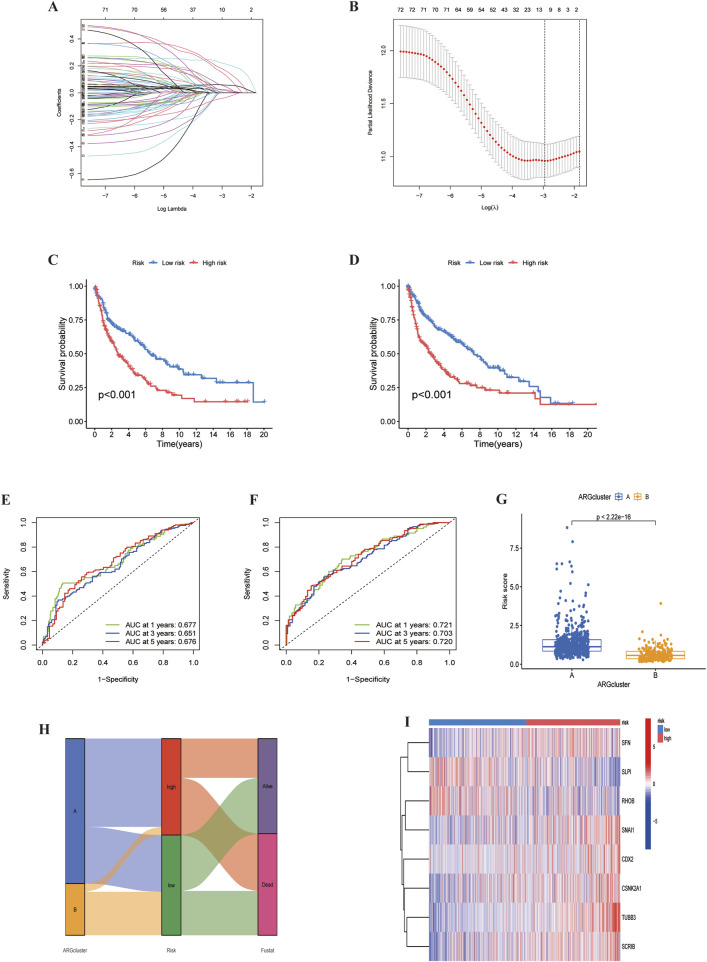
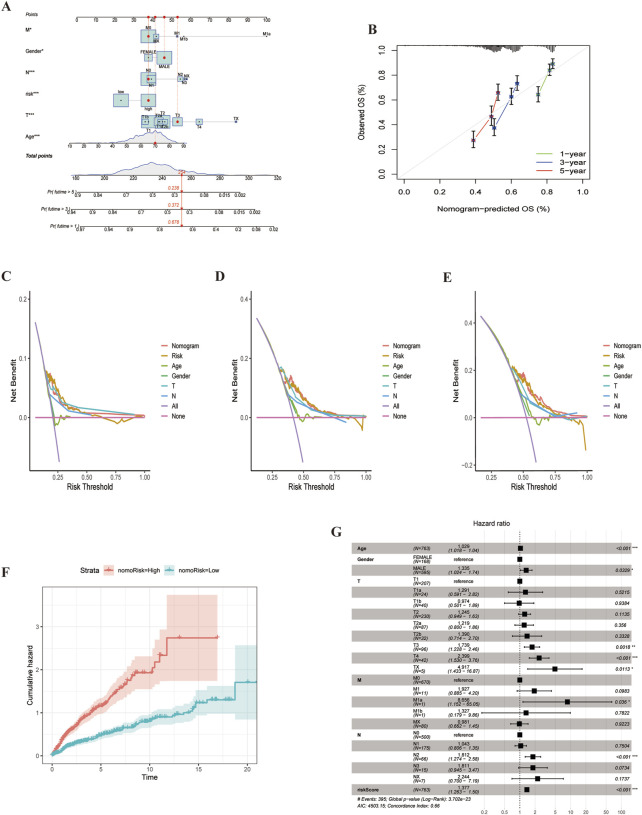
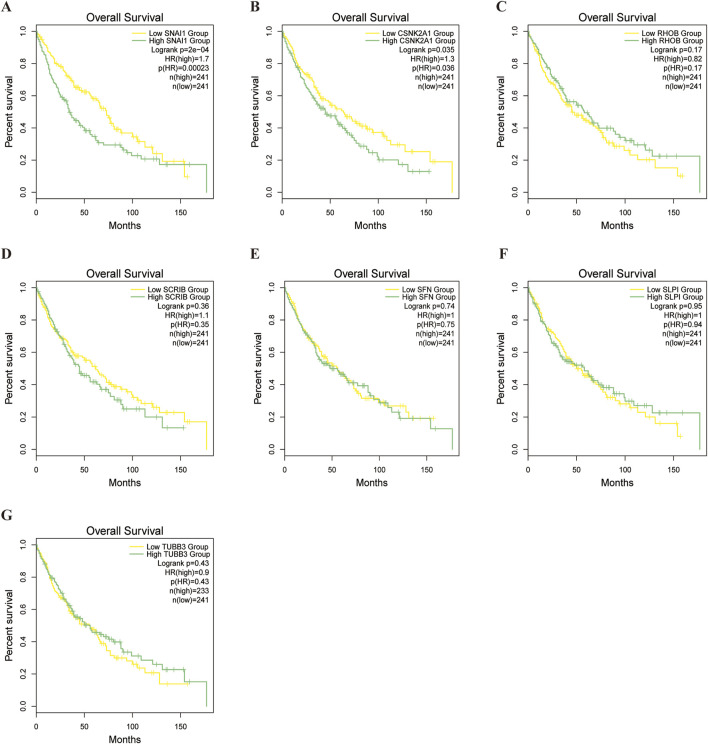
Methods: Anoikis-related genes were obtained from the Harmonizome and GeneCards databases, and 222 differentially expressed genes (DEGs) in LUSC were identified via differential expression analysis. Univariate Cox regression analysis identified 74 ARGs significantly associated with survival, and a prognostic model comprising 8 ARGs was developed using LASSO and multivariate Cox regression analyses. The model was internally validated using receiver operating characteristic (ROC) curves and Kaplan-Meier (K-M) survival curves. Differences in immune cell infiltration and gene expression between high- and low-risk groups were analyzed. Virtual drug screening and molecular dynamics simulations were performed to evaluate the therapeutic potential of CSNK2A1, a key gene in the model. Finally, in vitro experiments were conducted to validate the therapeutic effects of the identified drug on LUSC.
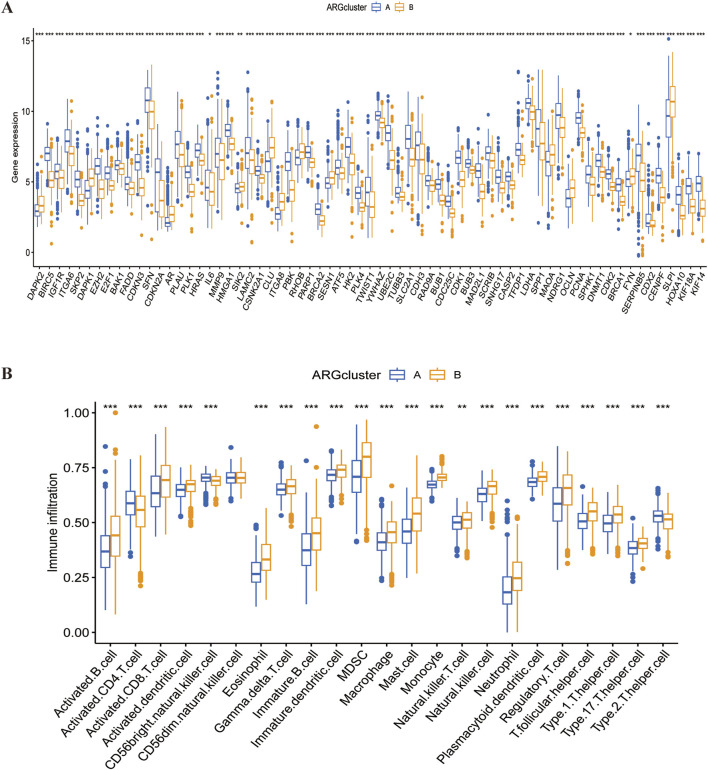
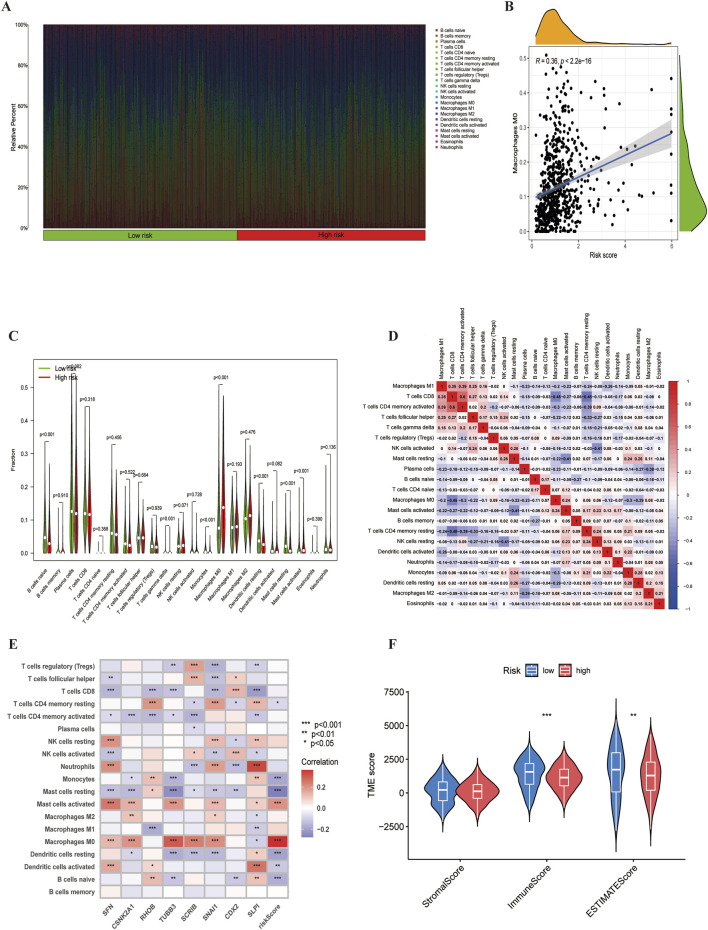
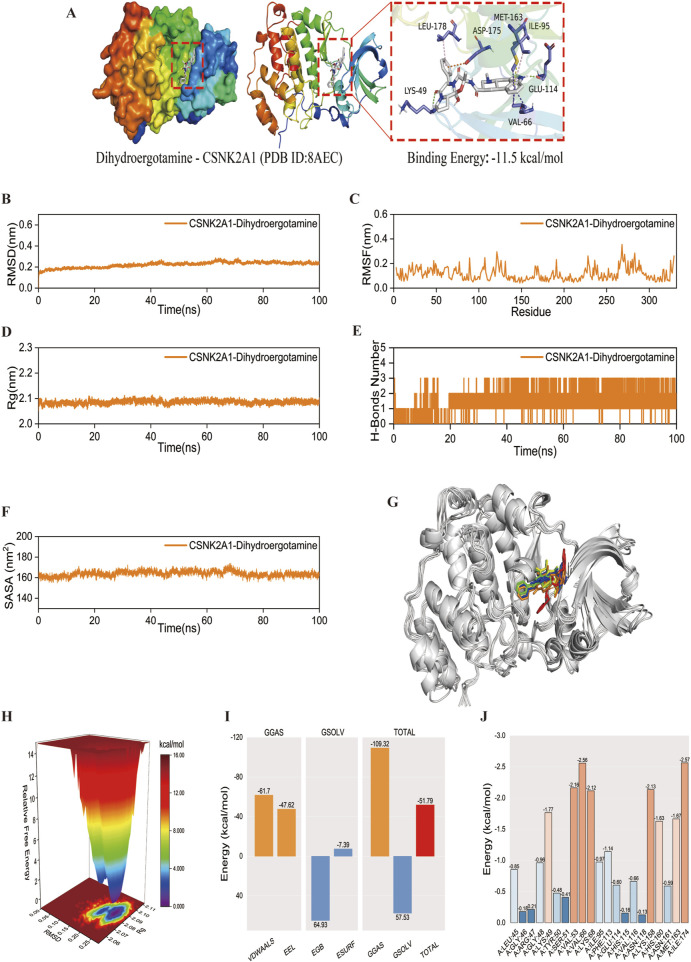
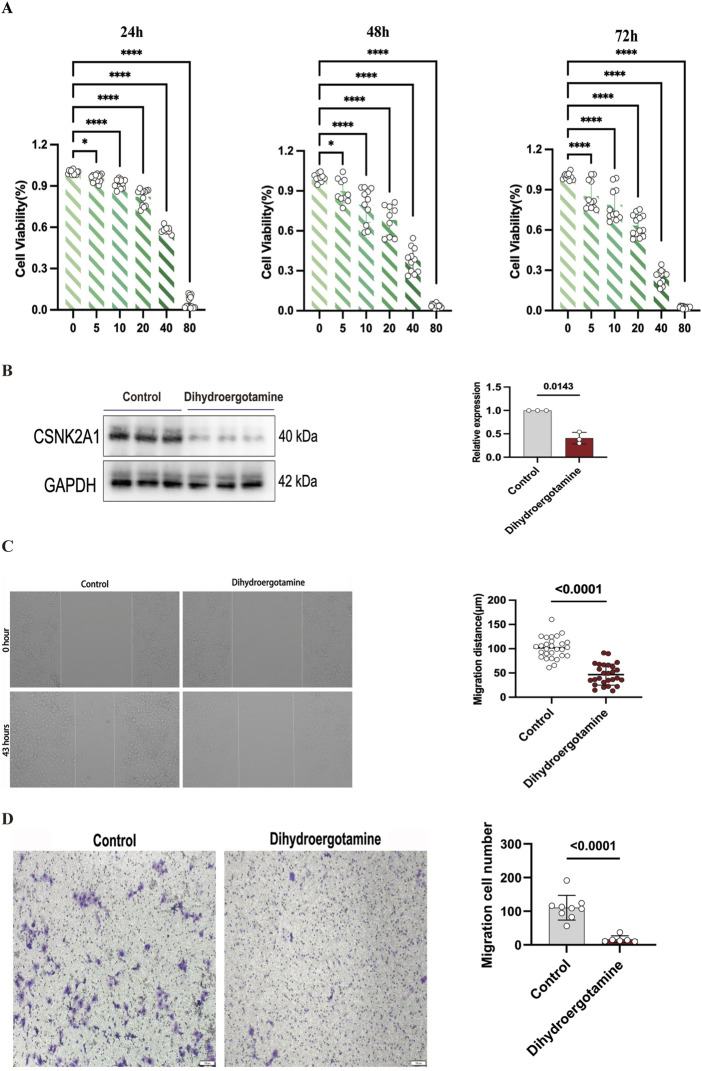
Results: The 8-gene prognostic model demonstrated excellent predictive performance and stability. Significant differences in immune cell infiltration and immune microenvironment characteristics were observed between the high- and low-risk groups, suggesting the critical role of ARGs in shaping the immune landscape of LUSC. Virtual drug screening identified Dihydroergotamine as having the highest binding affinity for CSNK2A1. Molecular dynamics simulations confirmed that the CSNK2A1-Dihydroergotamine complex exhibited strong binding stability. Further in vitro experiments demonstrated that Dihydroergotamine significantly inhibited LUSC cell viability, migration, and invasion, and downregulated CSNK2A1 expression.
Conclusion: This study is the first to construct an anoikis-related prognostic model for LUSC, highlighting its role in the tumor immune microenvironment and providing insights into personalized therapy. Dihydroergotamine exhibited significant anti-LUSC activity and holds promise as a potential therapeutic agent. CSNK2A1 emerged as a robust candidate for early diagnosis and a therapeutic target in LUSC.
Keywords: CSNK2A1; anoikis; lung squamous cell carcinoma; machine learning; virtual screening.
Copyright © 2025 Zhang, Zou, Ning, Zhao, Qu and Zhang.
Conflict of interest statement
The authors declare that the research was conducted in the absence of any commercial or financial relationships that could be construed as a potential conflict of interest.
Figures
Similar articles
-
Anoikis classification of lung squamous cell carcinoma reveals correlation with clinical prognosis and immune characteristics.Ann Med. 2025 Dec;57(1):2514944. doi: 10.1080/07853890.2025.2514944. Epub 2025 Jun 14. Ann Med. 2025. PMID: 40515636 Free PMC article.
-
Identification of specific prognostic markers for lung squamous cell carcinoma based on tumor progression, immune infiltration, and stem index.Front Immunol. 2023 Sep 29;14:1236444. doi: 10.3389/fimmu.2023.1236444. eCollection 2023. Front Immunol. 2023. PMID: 37841237 Free PMC article.
-
An anoikis-related signature predicts prognosis and immunotherapy response in gastrointestinal cancers.Front Immunol. 2025 Feb 6;16:1477913. doi: 10.3389/fimmu.2025.1477913. eCollection 2025. Front Immunol. 2025. PMID: 39981252 Free PMC article.
-
Systematic analysis of apoptosis-related genes in the prognosis of lung squamous cell carcinoma: a combined single-cell RNA sequencing study.J Thorac Dis. 2023 Dec 30;15(12):6946-6966. doi: 10.21037/jtd-23-1712. Epub 2023 Dec 26. J Thorac Dis. 2023. PMID: 38249925 Free PMC article.
-
Develop a Novel Signature to Predict the Survival and Affect the Immune Microenvironment of Osteosarcoma Patients: Anoikis-Related Genes.J Immunol Res. 2024 Mar 27;2024:6595252. doi: 10.1155/2024/6595252. eCollection 2024. J Immunol Res. 2024. PMID: 39431237 Free PMC article.
References
LinkOut - more resources
Full Text Sources