. 2025 Feb 26:13:e18940.
doi: 10.7717/peerj.18940. eCollection 2025.

Shoe configuration effects on equine forelimb gait kinetics at a walk

Affiliations

Shoe configuration effects on equine forelimb gait kinetics at a walk

Rita Aoun et al. PeerJ. .

Abstract

The shift in vertical forces on the equine hoof surface by heart-bar, egg-bar, and wooden clog shoes can significantly impact gait kinetics. Hypotheses tested in this study were that vertical, braking, and propulsion peak force (PF) and impulse (IMP) are different while shod with heart-bar, egg-bar, open-heel, and wooden clog shoes, or while unshod, and the resultant ground reaction force vector (GRF YZ ) has the longest duration of cranial angulation with open-heel shoes followed by unshod, then egg-bar and heart-bar shoes, and the shortest with wooden clog shoes. Forelimb GRFs were recorded as six non-lame, light-breed horses walked across a force platform (four trials/side) while unshod or with egg-bar, heart-bar, open-heel, or wooden clog shoes. Outcomes included vertical, braking, and propulsive peak forces (PFV, PFB, PFP) and impulses (IMPV, IMPB, IMPP), percent stance time to each PF, braking to vertical PF ratio (PFB/PFV), walking speed (m s-1), total stance time (ST) and percent of stance in braking and propulsion. The magnitude and direction of the resultant GRFYZ vectors were quantified at 5% stance increments. Kinetic measures were compared among shoeing conditions with a mixed effects model (p-value < 0.05). A random forest classifier algorithm was used to predict shoeing condition from kinetic outcome measures. All results are reported as mean ± SEM. Trial speed, 1.51 ± 0.02 m s-1, was not different among shoeing conditions. The PFV was lower with wooden clog (6.13 ± 0.1 N kg-1) versus egg-bar (6.35 ± 0.1 N kg-1) shoes or unshod (6.32 ± 0.1 N kg-1); the PFP was higher with wooden clog (0.81 ± 0.03 N kg-1) versus open-heel (0.71 ± 0.03 N kg-1) or egg-bar (0.75 ± 0.03 N kg-1) shoes or unshod (0.74 ± 0.03 N kg-1), and lower with open-heel compared to heart-bar shoes (0.77 ± 0.03 N kg-1). Both IMP B and IMPV were higher with open-heel shoes (-0.19 ± 0.008 N s kg-1, 3.28 ± 0.09 N s kg-1) versus unshod (-0.17 ± 0.008 N s kg-1, 3.16 ± 0.09 N s kg-1), and IMPV was higher with wooden clog shoes (3.26 ± 0.09 N s kg-1) versus unshod. With wooden clog shoes, PFB/PFV (0.12 ± 0.004) was higher than unshod (0.11 ± 0.004). Percent time to peak PFV, PFB, and PFP, and percent braking time were highest and percent propulsion time lowest with wooden clog shoes. The magnitude of the GRFYZ vector with the wooden clog shoe was the highest among shoeing conditions during the first stance half, lowest during the second stance half, highest during late propulsion, and had the most gradual braking to propulsion transition. Vectors were angled cranially with wooden clog shoes slightly longer than the others. Wooden clog shoes was the only shoeing condition accurately predicted from kinetic measures. Distinct, predictable changes in gait kinetics with wooden clog shoes may reduce stresses on hoof structures. Study results enhance knowledge about shoe effects on equine gait kinetics and cutting-edge measures to quantify them.

Keywords: Animal biomechanics; Bar shoes; Braking; Force platform; Forelimb; Ground reaction force; Hoof; Horse; Propulsion; Wooden clog.


Conflict of interest statement

The authors declare there are no competing interests.

Figures

Figure 1
Figure 1. Commercially available shoes used in the study.
Force platform data were collected while horses were unshod and then after (A) open-heel, (B) egg-bar, (C) heart-bar, or (D) wooden clog shoes were applied to the forelimbs by a certified farrier in random order. Horses were shod with each shoe type 22–24 h prior to kinetic gait collection. Iron shoes were affixed with two nails per side using the same nail holes for all shoes. A two-part, silicon-based impression material was used to fill the frog sulci (D; purple arrow) prior to application of wooden shoes which were stabilized by compressing hoof tissue under the heads of two screws on each side when the screws were advanced into the wood base (D and E; gray arrows) on each side of the wall. Fast setting resin (E; green arrow) was applied to the hoof wall before fiberglass cast material was added to enclose the dorsal hoof wall and periphery of the wood shoe (F; orange arrow). Linear low-density polyethylene was applied to facilitate curing of the casting material (F; white arrowhead).
Figure 2
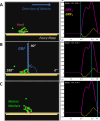
Figure 2. Y–Z resultant force vector data collection.
The resultant force vector in the Y (craniocaudal)-Z (vertical) plane, GRFYZ, magnitude and direction were quantified at 5% increments of the step cycle during each gait trial from heel down (A), through full stance (B), to toe off (C).
Figure 3
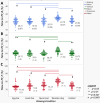
Figure 3. Peak ground reaction forces (PF) and impulses (IMP) across distinct shoeing conditions.
Braking (A-PFB, D-IMPB), vertical (B-PFV, E-IMPV), and propulsion (C-PFP, F-IMPP) peak forces (A–C) and impulses (D–F) normalized to body weight from horses (n = 6) shod with egg-bar, heart-bar, open-heel, or wooden clog shoes and while unshod. Points in the graph represent individual trials, and the horizontal line in the middle of each set indicates the mean; the numeric mean value along with the standard error of the mean (in parentheses) are shown to the right of each data set. Significant differences between data sets with a line between them are indicated by a symbol beneath the line.
Figure 4
Figure 4. Braking to vertical peak force ratio among shoeing conditions.
The PFB/PFV ratio from horses (n = 6) shod with egg-bar, heart-bar, open-heel, or wooden clog shoes and while unshod. Points in the graph represent individual trials, and the horizontal line in the middle of each set indicates the mean; the numeric mean value along with the standard error of the mean (in parentheses) are shown to the right of each data set. Significant differences between data sets with a line between them are indicated by a symbol beneath the line.
Figure 5
Figure 5. Forelimb (cyan) and hind limb (brown) ratio of the sum of total PFV among shoeing conditions.
Percent forelimb and hind limb vertical peak force distribution from horses (n = 6) shod with egg-bar, heart-bar, open-heel, or wooden clog shoes and when unshod. Mean and standard error of the mean (in parentheses) values are shown above each column.
Figure 6
Figure 6. Time to peak force as a percent of stance time among distinct shoeing conditions.
Time to (A) braking (PFB), (B) vertical (PFV), or (C) propulsion (PFP) peak force from horses (n = 6) shod with egg-bar, heart-bar, open- heel, or wooden clog shoes and while unshod. Points in the graph represent individual trials, and the horizontal line in the middle of each set indicates the mean; the numeric value along with the standard error of the mean (in parentheses) are shown to the right of each data set. Significant differences between data sets with a line between them are indicated by a symbol beneath the line.
Figure 7
Figure 7. Braking time as a percent of total stance time among shoeing conditions.
Percent (mean ± SEM) of stance time in braking from horses (n = 6) shod with egg-bar, heart-bar, open-heel, or wooden clog shoes and while unshod. Significant differences between data sets with a line between them are indicated by a symbol beneath the line. Mean and standard error of the mean (in parentheses) values are shown above each column.
Figure 8
Figure 8. Stance time among shoeing conditions.
Box plots showing the stance time from horses (n = 6) shod with egg-bar, heart-bar, open-heel, or wooden clog shoes and while unshod. The values below each data set are the interquartile range (IQR), minimum value (Min), maximum value (Max), mean (Mean) and standard error of the mean (SEM).
Figure 9
Figure 9. Y–Z resultant ground reaction force vector diagrams and magnitude.
Force vectors (upper panel) and vector magnitude (mean ± SEM, lower panel) from forelimbs of horses (n = 6) walking over a force platform embedded in a 40-m concrete runway in 5% increments of the complete step cycle while shod with egg-bar (A, red), heart-bar (B, brown), open-heel (C, lavender), or wooden clog shoes (D, green) or while unshod (E, black). In the upper panel each line is the mean value of all horses for the indicated increment and shoeing condition. Specific ranges of the step cycle are shown in shades of grey (0–15%), green (20–35%), orange (40–55%), blue (60–75%), and purple (80–100%), respectively.
Figure 10
Figure 10. Random forest model outcomes.
(A) Confusion matrix for the RF model to predict shoeing condition from kinetic variables with each cell across the matrix diagonal showing the percent of true predictions and all other cells showing false predictions. (B) Training (blue) and test (red) error curves against different maximum tree depths in the RF model used to predict shoeing condition. (C) Feature importance (mean ± SEM) of each variable in the random forest algorithm classification model to predict shoeing condition from kinetic variables.

Similar articles

References

    1. Aflatoony L. Flex, breathe, fit, and walk: exploring technologies accessible in academia for design and production of a custom fit shoes. International textile and apparel association annual conference proceedings.2019.
    1. Amitrano FN, Gutierrez-Nibeyro SD, Schaeffer DJ. Effect of hoof boots and toe-extension shoes on the forelimb kinetics of horses during walking. American Journal of Veterinary Research. 2016;77(5):527–533. doi: 10.2460/ajvr.77.5.527. - DOI - PubMed
    1. Aoun R, Charles I, De Rouen A, Takawira C, Lopez MJ. Shoe configuration effects on third phalanx and capsule motion of unaffected and laminitic equine hooves in-situ. PLOS ONE. 2023;18(5):e0285475. doi: 10.1371/journal.pone.0285475. - DOI - PMC - PubMed
    1. Aoun R, Takawira C, Lopez MJ. Horseshoe effects on equine gait—a systematic scoping review. Veterinary Surgery. 2024;54(1):31–51. doi: 10.1111/vsu.14162. - DOI - PMC - PubMed
    1. Back W, Pille F. The role of the hoof and shoeing. In: Back W, Clayton H, editors. Equine locomotion. Elsevier; Cambridge: 2013. pp. 147–174.

LinkOut - more resources