. 2025 Feb 11;11(2):302-321.
doi: 10.1021/acscentsci.4c01617. eCollection 2025 Feb 26.

Chemically Informed Coarse-Graining of Electrostatic Forces in Charge-Rich Biomolecular Condensates

Affiliations

Chemically Informed Coarse-Graining of Electrostatic Forces in Charge-Rich Biomolecular Condensates

Andrés R Tejedor et al. ACS Cent Sci. .

Abstract

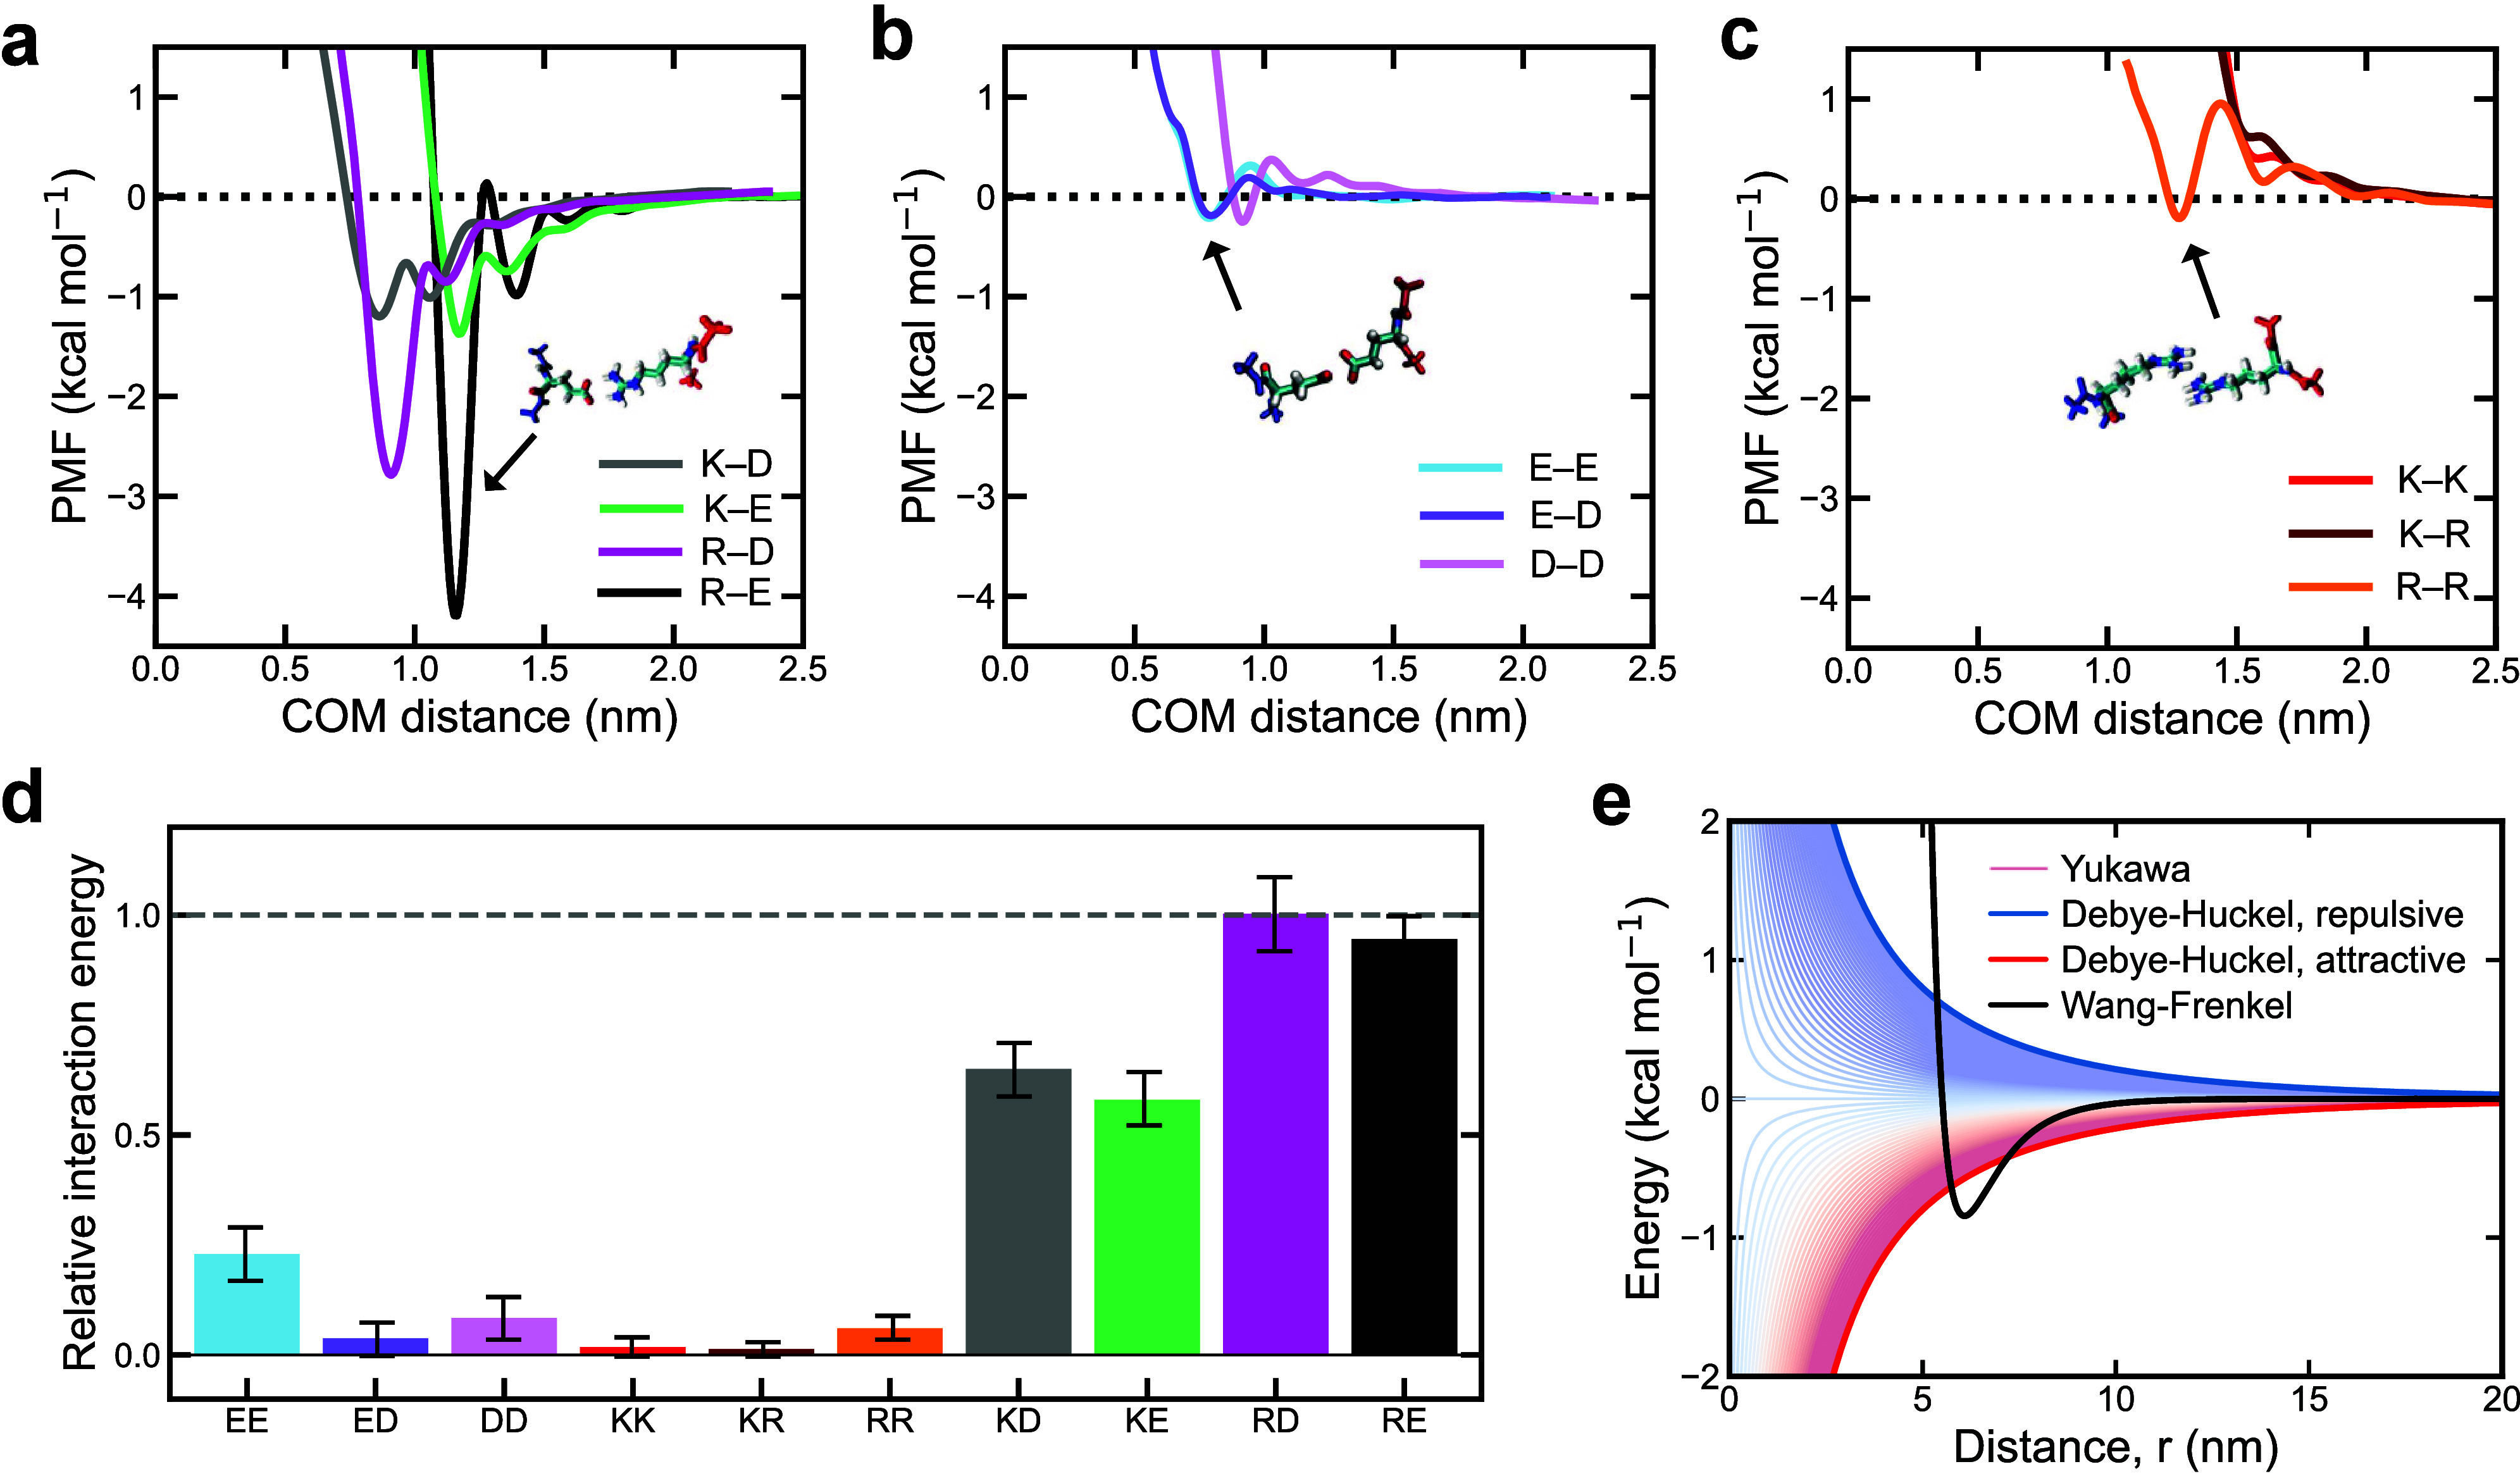
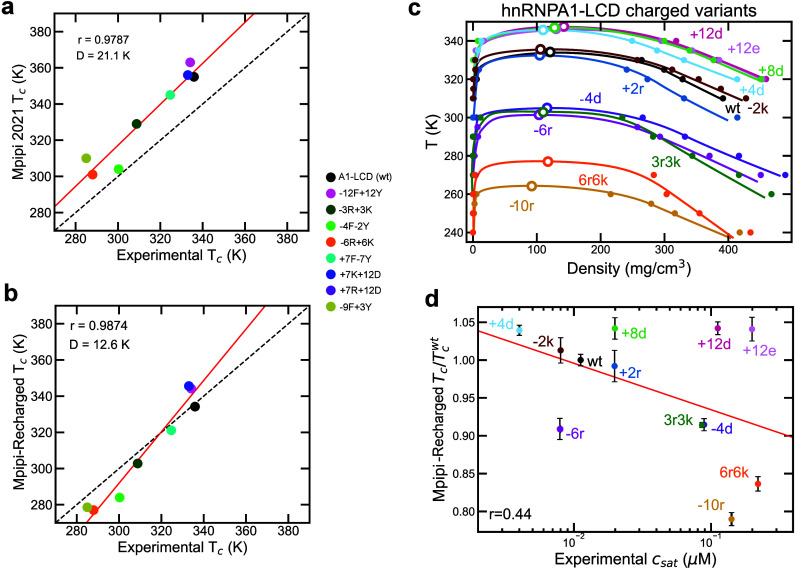
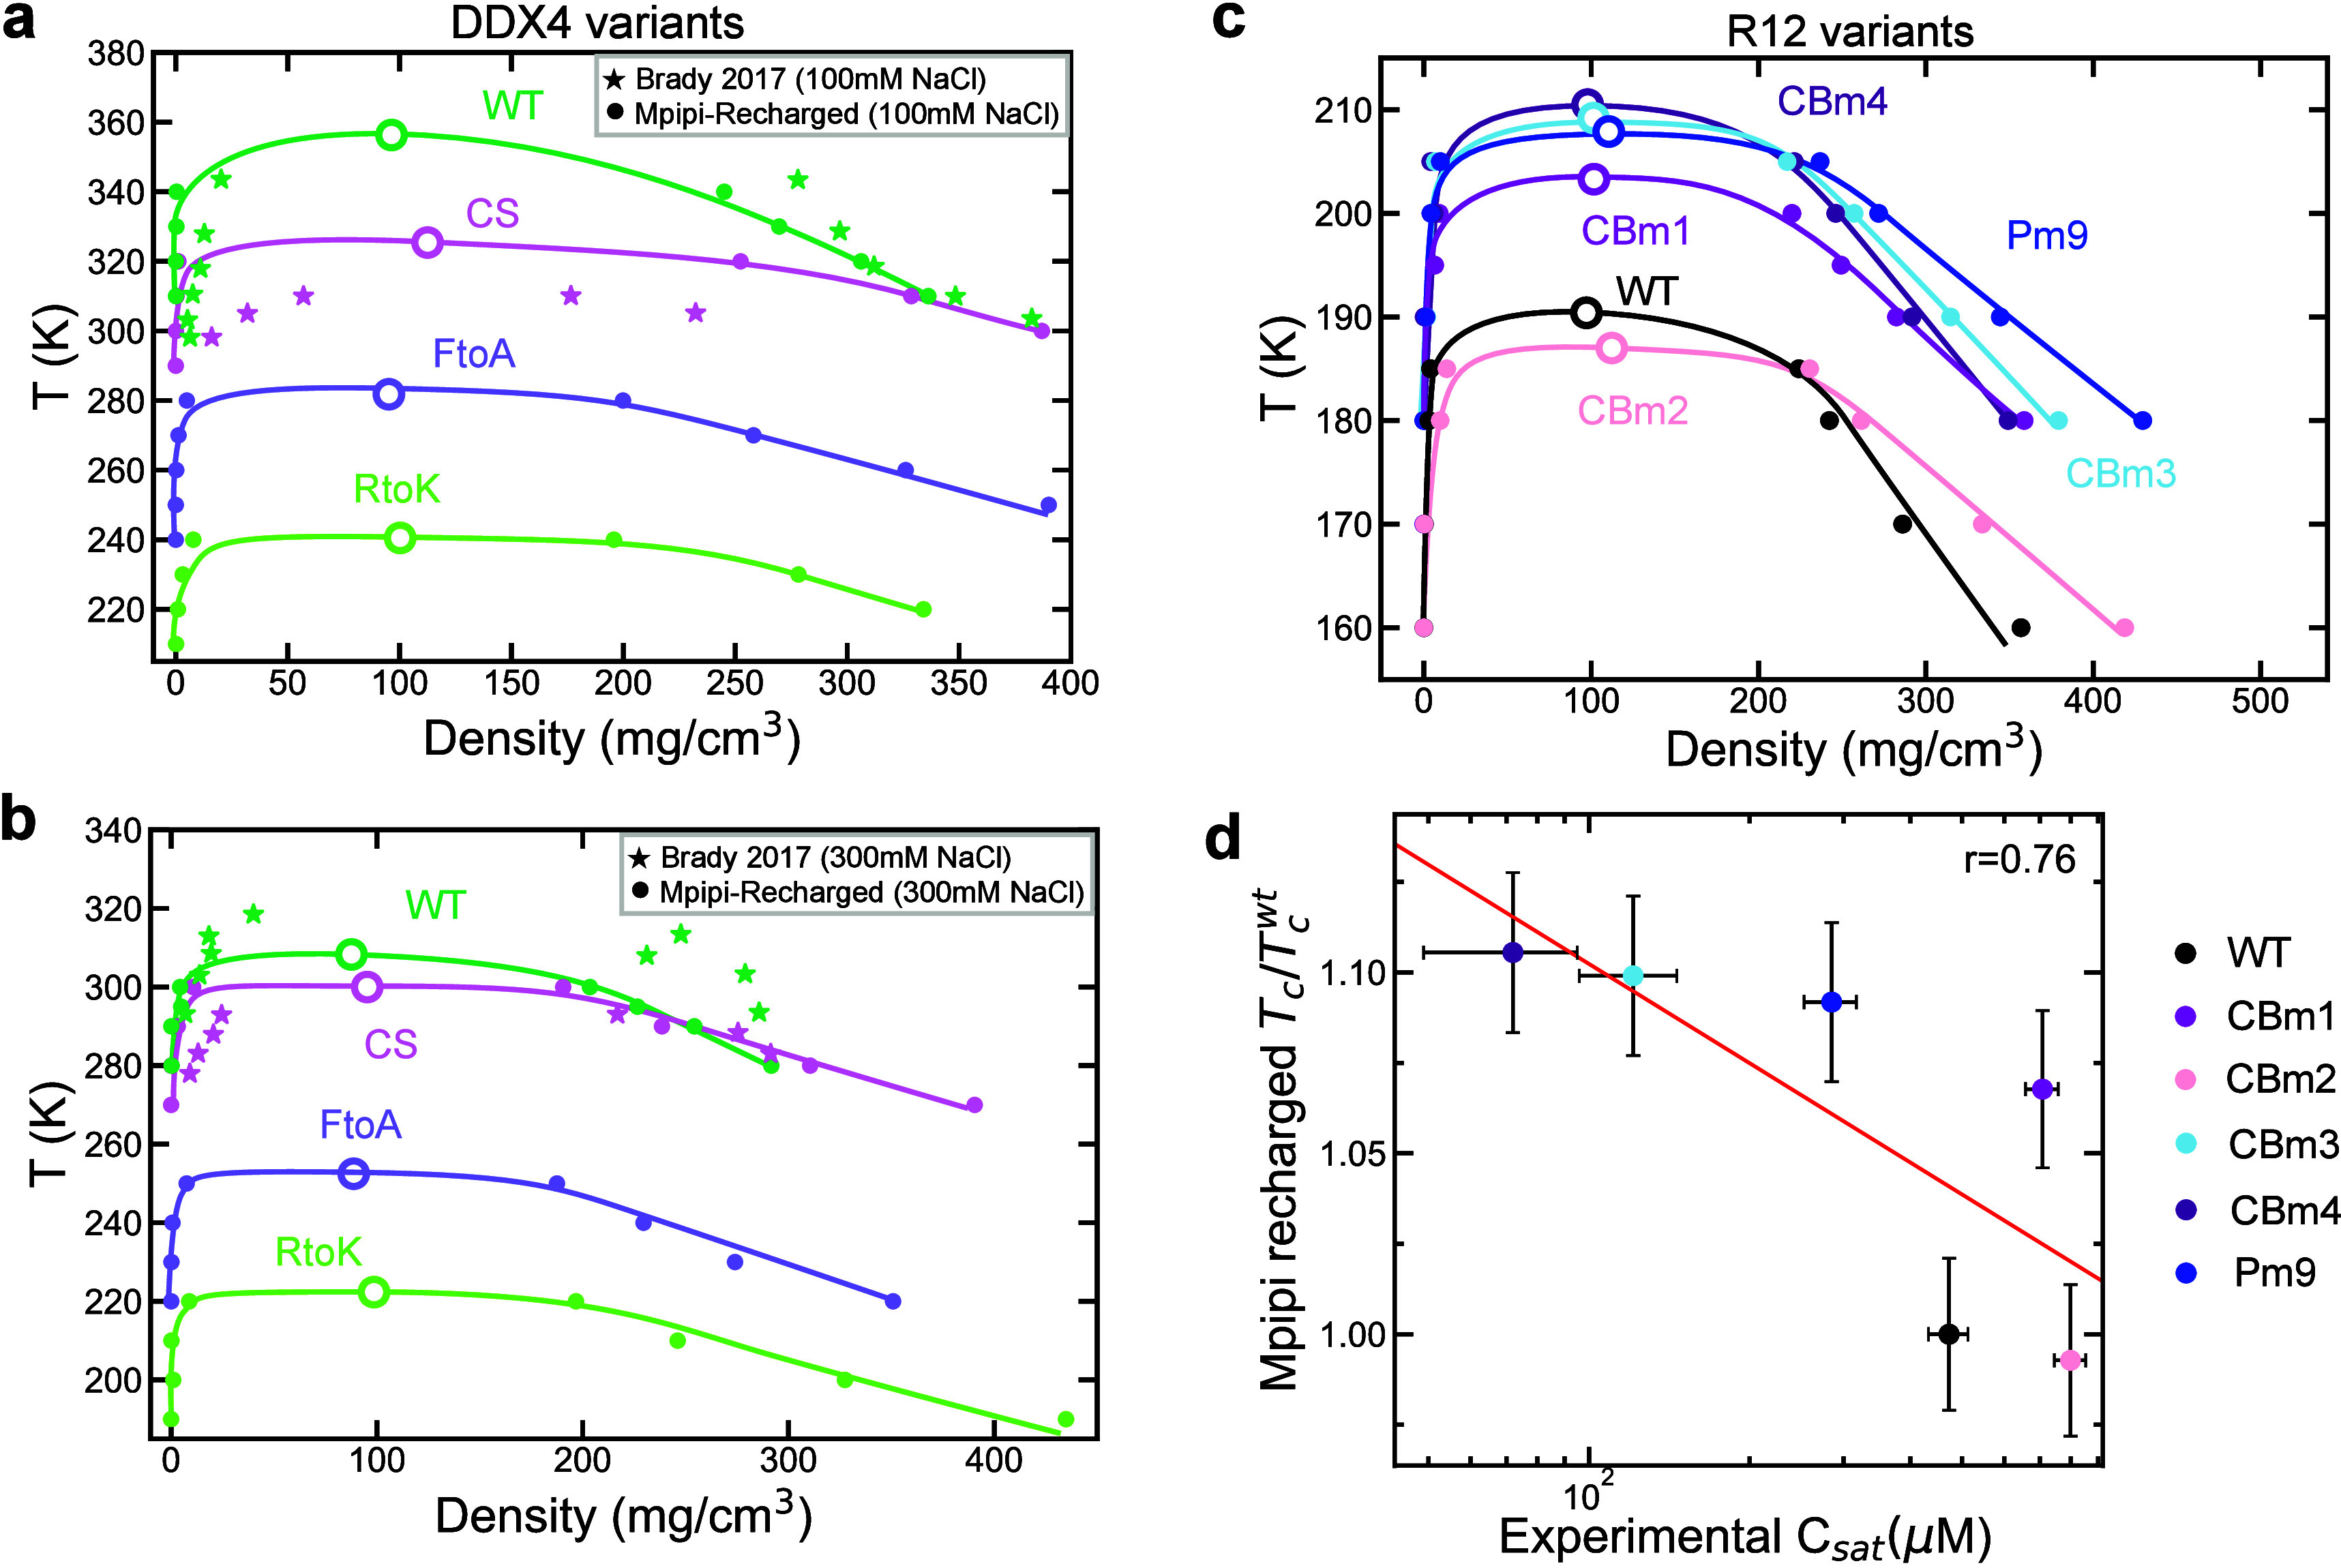
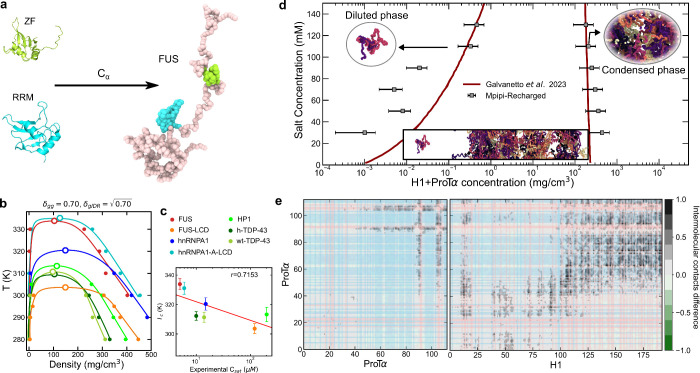
Biomolecular condensates composed of highly charged biomolecules, such as DNA, RNA, chromatin, and nucleic-acid binding proteins, are ubiquitous in the cell nucleus. The biophysical properties of these charge-rich condensates are largely regulated by electrostatic interactions. Residue-resolution coarse-grained models that describe solvent and ions implicitly are widely used to gain mechanistic insights into the biophysical properties of condensates, offering transferability, computational efficiency, and accurate predictions for multiple systems. However, their predictive accuracy diminishes for charge-rich condensates due to the implicit treatment of solvent and ions. Here, we present Mpipi-Recharged, a residue-resolution coarse-grained model that improves the description of charge effects in biomolecular condensates containing disordered proteins, multidomain proteins, and/or disordered single-stranded RNAs. Mpipi-Recharged introduces a pair-specific asymmetric Yukawa electrostatic potential, informed by atomistic simulations. We show that this asymmetric coarse-graining of electrostatic forces captures intricate effects, such as charge blockiness, stoichiometry variations in complex coacervates, and modulation of salt concentration, without requiring explicit solvation. Mpipi-Recharged provides excellent agreement with experiments in predicting the phase behavior of highly charged condensates. Overall, Mpipi-Recharged improves the computational tools available to investigate the physicochemical mechanisms regulating biomolecular condensates, enhancing the scope of computer simulations in this field.


Conflict of interest statement

The authors declare no competing financial interest.

Figures

Figure 1
Figure 1
Free energies of binding between pairs of ±1 charged amino acids reveal a stronger role of associative versus repulsive electrostatic forces. (a–c) PMF computed from US atomistic MD simulations of charged amino acid pairs. The COM distance between the amino acids in the pair was used as the reaction coordinate. The simulations were performed with the a99SB-disp all-atom force field at T = 298 K and 150 mM NaCl salt concentration. The PMF plots shown are for: (a) positive–negative (Black: glutamic acid–arginine, E–R, Green: glutamic acid–lysine, E–K, Gray: lysine–aspartic acid, K–D, and Magenta: arginine–aspartic acid, R–D), (b) negative–negative (pink: aspartic acid–aspartic acid, D–D, Purple: glutamic acid–aspartic acid, E–D, and blue: glutamic acid–glutamic acid, E–E), and (c) positive–positive (Red: lysine–lysine, K–K, Maroon: lysine–arginine, K–R, and Orange: arginine–arginine, R–R) pairs of charged residues. (d) Integral of the attractive part of the PMF deepest attractive well as a function of the COM distance for the different curves presented in panels (a–c) normalized by the largest value of the set (R–D interaction). Error bars indicate the accumulated error of the integral extracted from the standard error of the PMF curves. (e) Schematic depiction of the potentials used in the Mpipi-Recharged model for hydrophobic/dispersive interactions (Wang–Frenkel potential; black thick curve) and electrostatic interactions (Yukawa potential; thin curves ranging from blue to red). Thick blue and red curves represent the standard profile of a Coulombic-like electrostatic screened potential (among species with charges equal to ±1) for repulsive and attractive interactions, respectively.
Figure 2
Figure 2
Predicted critical solution temperature Tc by the Mpipi (a) and Mpipi-Recharged (b) models against values estimated by us from experimental coexistence densities for hnRNPA1-LCD charged variants from ref (9). The Pearson correlation coefficient (r) and the root-mean-square deviation from the experimental values (D) are displayed for each set of modeling data. (c) Temperature-vs-density phase diagram for hnRNPA1-LCD charged variants. Solid symbols represent the obtained coexistence densities from DC simulations, and open symbols the estimated critical temperature through the law of rectilinear diameters and critical exponents. Continuous lines are included as a guide for the eye. (d) Predicted critical solution temperatures by the Mpipi-Recharged model against the experimental saturation concentration reported in ref (9) for the hnRNPA1-LCD charged variants. The simulated critical temperature has been normalized by the value Tcwt corresponding to wt-hnRNPA1-LCD.
Figure 3
Figure 3
Predicted phase-separation behavior of DDX4 and R12 variants by the Mpipi-Recharged model. Phase diagram in the temperature-vs-density plane, at 100 mM NaCl in panel (a) and at 300 mM NaCl in panel (b), for DDX4 variants as studied in ref (103), obtained using direct coexistence simulations and the Mpipi-Recharged model. Solid circles indicate the equilibrium coexistence densities of each phase, empty symbols show the critical solution temperature predicted from simulations, and solid stars represent experimental data from Brady et al. for the WT and CS variants as indicated by the color code. (c) Phase diagram in the temperature-vs-density plane for R12 variants with different charged blockiness obtained using direct coexistence simulations and the Mpipi-Recharged model. Solid symbols indicate the equilibrium coexistence densities of each phase and empty symbols represent the critical solution temperature. (d) Critical solution temperature from simulations vs experimental saturation concentration Csat for the same R12 variants. The critical solution temperature is normalized by the value Tcwt corresponding to the wild-type R12 sequence.
Figure 4
Figure 4
(a) Schematic representation of the globular domains of FUS from the PDB structures to the coarse-grained representation of the Mpipi-Recharged model. Globular domain (as those depicted by cyan and light green beads for FUS) interactions have been gradually scaled down to optimize the correlation between the model critical temperature and the experimental saturation concentration. (b) Phase diagram from direct coexistence simulations for multidomain proteins FUS (red), hnRNPA1 (blue), HP1 (lime green), h-TDP-43 (dark green), and wt-TDP-43 (olive green) and intrinsically disordered proteins FUS-LCD (orange) and hnRNPA1-LCD (light blue). Solid symbols indicate the equilibrium coexistence densities of the two phases, and empty symbols display the critical temperature for each system. δgg refers to factor by which Wang–Frenkel interaction strength for globular–globular interactions are rescaled, while δgIDR scales down interactions between a globular domain bead and an IDR bead. (c) Critical temperature from simulations using the parameters indicated in panel (b) vs the experimental saturation concentration Csat for FUS,,, FUS-LCD, hnRNPA1, hnRNPA1-LCD,, HP1, and TDP-43., (d) Phase diagram of a 1:1.2 H1–ProTα mixture in the salt concentration (KCl)-vs-concentration plane at T = 273 K as predicted by the Mpipi-Recharged model (gray squares). In vitro results for the same system reported by Galvanetto et al. are depicted by a red line. Representative snapshots are provided for the simulation slab (bottom), the condensed phase (right), and the dilute phase (left). (e) Intermolecular contact frequency difference (in number of contacts per residue) between ProTα–ProTα (left) and H1–ProTα (right) between the system at 30 mM and 130 mM KCl concentration. The thick lines across the panels indicate the positively charged (red) and negatively charged (blue) blocks in ProTα and H1 sequences.
Figure 5
Figure 5
Predictions of the RNA-driven re-entrant phase behavior of protein condensates by the Mpipi-Recharged model. Comparison of simulated critical solution temperature (blue symbols) with in vitro solution turbidity experiments (yellow symbols) as a function of the polyU/peptides mass ratio for RP3 (a) and SR8 synthetic peptides (b). Both simulation critical temperatures (Tc) and fluorescence intensities (I) are normalized by the maximum value of the set. The phase regimes indicated by C1, C0, and C2 are extracted from the work of Banerjee et al. as explained in the text. (c) Bulk density of polyU–FUS condensates at 300 K from NpT simulations (at 0 bar and 300 K) as a function of the polyU/protein mass ratio. Red symbols represent the in vitro protein partition coefficient for different polyU–FUS mixtures normalized by that of a pure FUS solution as reported by Maharana et al. The computed density from simulations with different concentrations of polyU was renormalized by that of pure FUS condensates at the same conditions. (d) Right: RNA re-entrant behavior for different multidomain RBPs (as indicated in the legend) showing the variation in the critical temperature (normalized by that of pure protein condensates, Tcx) as a function of the polyU concentration. Dashed line sets the separation between promoting and hindering phase separation. Left: Representative snapshots of direct coexistence simulations of FUS with different polyU concentrations (as indicated in the left panel) and at a temperature of T = 0.98TcFUS (depicted by the horizontal dotted line in the right panel).

Similar articles

Cited by

References

    1. Hyman A. A.; Weber C. A.; Jülicher F. Liquid-liquid phase separation in biology. Annual review of cell and developmental biology 2014, 30, 39–58. 10.1146/annurev-cellbio-100913-013325. - DOI - PubMed
    1. Banani S. F.; Rice A. M.; Peeples W. B.; Lin Y.; Jain S.; Parker R.; Rosen M. K. Compositional Control of Phase-Separated Cellular Bodies. Cell 2016, 166, 651–663. 10.1016/j.cell.2016.06.010. - DOI - PMC - PubMed
    1. Shin Y.; Brangwynne C. P. Liquid phase condensation in cell physiology and disease. Science 2017, 357, 1.10.1126/science.aaf4382. - DOI - PubMed
    1. Alberti S.; Gladfelter A.; Mittag T. Considerations and challenges in studying liquid-liquid phase separation and biomolecular condensates. Cell 2019, 176, 419–434. 10.1016/j.cell.2018.12.035. - DOI - PMC - PubMed
    1. Espinosa J. R.; Joseph J. A.; Sanchez-Burgos I.; Garaizar A.; Frenkel D.; Collepardo-Guevara R. Liquid network connectivity regulates the stability and composition of biomolecular condensates with many components. Proc. Natl. Acad. Sci. U. S. A. 2020, 117, 13238–13247. 10.1073/pnas.1917569117. - DOI - PMC - PubMed

LinkOut - more resources