. 2024 Nov 23;11(2):193-207.
doi: 10.1021/acscentsci.4c01061. eCollection 2025 Feb 26.

Bio-orthogonal Glycan Imaging of Cultured Cells and Whole Animal C. elegans with Expansion Microscopy

Affiliations

Bio-orthogonal Glycan Imaging of Cultured Cells and Whole Animal C. elegans with Expansion Microscopy

Joe Chin-Hun Kuo et al. ACS Cent Sci. .

Abstract

Complex carbohydrates called glycans play crucial roles in regulating cell and tissue physiology, but how they map to nanoscale anatomical features must still be resolved. Here, we present the first nanoscale map of mucin-type O-glycans throughout the entirety of the Caenorhabditis elegans model organism. We constructed a library of multifunctional linkers to probe and anchor metabolically labeled glycans in expansion microscopy (ExM). A flexible strategy was demonstrated for the chemical synthesis of linkers with a broad inventory of bio-orthogonal functional groups, fluorophores, anchorage chemistries, and linker arms. Employing C. elegans as a test bed, metabolically labeled O-glycans were resolved on the gut microvilli and other nanoscale anatomical features. Transmission electron microscopy images of C. elegans nanoanatomy validated the fidelity and isotropy of gel expansion. Whole organism maps of C. elegans O-glycosylation in the first larval stage revealed O-glycan "hotspots" in unexpected anatomical locations, including the body wall furrows. Beyond C. elegans, we validated ExM protocols for nanoscale imaging of metabolically labeled glycans on cultured mammalian cells. Together, our results suggest the broad applicability of the multifunctional reagents for imaging glycans and other metabolically labeled biomolecules at enhanced resolutions with ExM.


Conflict of interest statement

The authors declare no competing financial interest.

Figures

Figure 1
Figure 1
Multifunctional linkers for imaging metabolically tagged molecules with expansion microscopy (ExM). (A) Cartoon representing an oligothioetheramide (oligoTEA) trifunctional linker. “Click handles” probe metabolically labeled glycans, while the “tether” copolymerizes with the expansion gel matrix to be visualized by the “reporters”. Box shows the inventory of functional groups that have been successfully incorporated into the linker library. (B) Chemical structures of the oligoTEA linker core and an example trifunctional linker with a methacrylamide group (tether), rhodamine fluorophore (reporter), and alkyne group (click handle). The extended PEG spacer arms were used to improve solubility and molecular flexibility, while the disulfide cleavage site was included for reductive release of a probed epitope prior to sample expansion.
Figure 2
Figure 2
Validation of trifunctional linkers on mammalian cells for retention and visualization of the extracellular glycocalyx. Tetra-acylated azidoacetylmannosamine (ManNAz) metabolically labeled MDA-MB-231 cells were probed through copper-catalyzed azide–alkyne cycloaddition with a trifunctional linker composed of a linear alkyne, rhodamine, and methacrylamide (Alk-Rho-MeAcr, ARM); cells were subsequently fixed for validation. (A) Disulfide bond reduction releases the fluorescent rhodamine reporter and gel tether from cultured cells, depicted by the cartoon on the far-right. (B) Quantification of (A) indicated a near complete loss of cell surface fluorescence was achieved post-DTT reduction, demonstrating the specificity of the azide–alkyne (n > 50 cells analyzed per condition, statistics from unpaired two-tail Student’s t test). (C) ARM derivatized MDA-MB-231 cells embedded into the expansion gel before and after digestion with Proteinase K in the presence or absence of DTT reduction. Representative image for “Digest” was acquired at a similar gel position to the “Pre-digest” image, with the former rotated to a similar orientation of the corresponding cells shown in the latter. (D) DTT reduction in (C) did not lead to additional loss of fluorescence, indicating stable integration of linker in the gel matrix (n > 15 cells analyzed per condition, statistics from one-way ANOVA and post hoc nonparametric tests). Error bars represent standard deviation in (B) and (D). Scale bars in (A) 100 μm; (C) 50 μm for “Pre-digest” and 30 μm for “Digest” and “Digest + DTT” after adjusting for a slight ∼1.65× expansion in digestion buffers.
Figure 3
Figure 3
Super-resolution imaging of glycans and proteins on mammalian cells, (A) expansion microscopy (ExM) workflow for probing metabolically labeled glycans with the multifunctional linkers. (B) Tetra-acylated azidoacetylmannosamine (ManNAz) fed MDA-MB-231 breast cancer cells were labeled with the linker Alkyne-Rhodamine-Methacrylamide (ARM) via copper-catalyzed azide–alkyne cycloaddition (CuAAC). When fully expanded, ARM enabled the ExM imaging of subdiffraction limited membrane structures decorated with azido-sialic acids. (C–E) MCF10A cells expressing the sialomucin Muc1ΔCT-mOxGFP fusion protein were metabolically tagged with ManNAz. To enable ExM imaging of glycans, cell surface sialic acids bearing the unnatural azide were labeled with the ARM linker via CuAAC. To enable proExM, cell samples were stained with an anti-GFP nanobody conjugated to Atto647N for labeling extracellular Muc1-mOxGFP proteins prior to fixation and treatment with methacrylic acid N-hydroxysuccinimidyl ester to broadly anchor proteins into the expansion gel matrix. (C) Maximum intensity projection and orthogonal sections showing the high microvilli density associated with Muc1 overexpression. (D) 3D reconstruction of metabolically labeled cell surface sialic acids imaged with ExM. The two planes in gray correspond to the XY slices in (E). (E) Horizontal slices through the cell center (above) and apical surface (below). Far Right: Detailed view of the region boxed in red to the lower left. Blue, mOxGFP. Green, rhodamine. Magenta, Atto647n. Scale bars in (B) 500 nm, and inset, 200 nm, adjusted for ∼4.45× expansion; (C) 5 μm; (E) left panels 5 μm and right panel 1 μm.
Figure 4
Figure 4
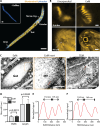
Metabolic labeling of newly hatched C. elegans larvae for expansion microscopy (ExM). (A) Unfed larval stage 1 (L1) C. elegans hatched in tetra-acylated azidoacetylgalactosamine (GalNAz) showed enrichment of labeling by the DBCO-Rhodamine-Methacrylamide (DRM) linker, compared to larvae hatched in equal volume of the vehicle (DMSO, inset, - GalNAz). (B) DRM linker enabled the super-resolution ExM imaging of GalNAz-enriched structures including the grinder teeth and those around the mouth region. (C–F) Benchmarking microvilli from ExM against transmission electron microscopy (TEM). For A and B, yellow represents rhodamine, and blue represents nuclear stain Hoeschst. (C) Representative microvilli (MV) visualized on ExM and TEM. (D) Quantification showed that GalNAz-labeled gut microvilli dimensions observed by ExM (100 microvilli in 7 larvae) were comparable to those observed by transmission electron microscopy (TEM, 300 microvilli in 8 larvae). Statistics from one-way ANOVA with Turkey’s multiple comparison test. Error bars represent standard deviation. (E) and (F) Line profiles indicated in (C) for ExM and TEM, respectively. Scale bars in (A) and its inset, 20 μm, and after adjusting for expansion factor 3.7×, are in (B) Top row, 250 nm, bottom row, 1 μm; (C) “ExM” 2 μm; “ExM inset”, 1 μm; “TEM”, 1 μm.
Figure 5
Figure 5
O-Glycosylation mapping of newly hatched C. elegans larvae. (A) Grayscale expansion microscopy (ExM) images of a larval head highlighting tetra-acylated azidoacetylgalactosamine (GalNAz) enrichment. Transverse view of the same head close to the external surface (Top) and midbody section (Bottom) of an L1 larva. Cartoon depicts structures on the body wall cuticle. (B) Fine features in the buccal cavity were embellished with GalNAz. Cartoons depict the buccal cavity highlighting different features shown by three serial grayscale ExM images below. Orange arrow indicates anterior direction. Top right column, transmission electron microscopy (TEM) image showing a cross-sectional view of the anterior buccal cavity; TEM image reproduced with permission from ref (127). Copyright 2014 www.WormImage.org. Bottom right column, GalNAz-enriched features observed over a similar cross-sectional view from ExM corresponded with those on the TEM such as neuronal endings. (C) Furrows (F) on body wall cuticle visualized by scanning electron microscopy (SEM) were comparable to ExM and showed GalNAz accumulation. Furrows were absent on cuticles lining inner cavities such as the pharynx and rectum. Yellow, Rhodamine. Blue, nuclear stain Hoeschst. Scale bars, after adjusting for expansion factor 3.72×, in (A) 1 μm; (B) red and white bars, 250 nm; (C) 1 μm.

Update of

References

    1. Reily C.; Stewart T. J.; Renfrow M. B.; Novak J. Glycosylation in Health and Disease. Nat. Rev. Nephrol 2019, 15 (6), 346–366. 10.1038/s41581-019-0129-4. - DOI - PMC - PubMed
    1. Varki A. Biological Roles of Glycans. Glycobiology 2017, 27 (1), 3–49. 10.1093/glycob/cww086. - DOI - PMC - PubMed
    1. Griffin M. E.; Hsieh-Wilson L. C. Tools for Mammalian Glycoscience Research. Cell 2022, 185 (15), 2657–2677. 10.1016/j.cell.2022.06.016. - DOI - PMC - PubMed
    1. Bagdonaite I.; Malaker S. A.; Polasky D. A.; Riley N. M.; Schjoldager K.; Vakhrushev S. Y.; Halim A.; Aoki-Kinoshita K. F.; Nesvizhskii A. I.; Bertozzi C. R.; Wandall H. H.; Parker B. L.; Thaysen-Andersen M.; Scott N. E. Glycoproteomics. Nat. Rev. Methods Primers 2022, 2 (1), 1–29. 10.1038/s43586-022-00128-4. - DOI
    1. Chen X.; Varki A. User-Friendly Bioorthogonal Reactions Click to Explore Glycan Functions in Complex Biological Systems. J. Clin Invest 2023, 133 (6), e16940810.1172/JCI169408. - DOI - PMC - PubMed

LinkOut - more resources