. 2025 Mar 3:13:RP102002.
doi: 10.7554/eLife.102002.

A conformational fingerprint for amyloidogenic light chains

Affiliations

A conformational fingerprint for amyloidogenic light chains

Cristina Paissoni et al. Elife. .

Abstract

Both immunoglobulin light-chain (LC) amyloidosis (AL) and multiple myeloma (MM) share the overproduction of a clonal LC. However, while LCs in MM remain soluble in circulation, AL LCs misfold into toxic-soluble species and amyloid fibrils that accumulate in organs, leading to distinct clinical manifestations. The significant sequence variability of LCs has hindered the understanding of the mechanisms driving LC aggregation. Nevertheless, emerging biochemical properties, including dimer stability, conformational dynamics, and proteolysis susceptibility, distinguish AL LCs from those in MM under native conditions. This study aimed to identify a2 conformational fingerprint distinguishing AL from MM LCs. Using small-angle X-ray scattering (SAXS) under native conditions, we analyzed four AL and two MM LCs. We observed that AL LCs exhibited a slightly larger radius of gyration and greater deviations from X-ray crystallography-determined or predicted structures, reflecting enhanced conformational dynamics. SAXS data, integrated with molecular dynamics simulations, revealed a conformational ensemble where LCs adopt multiple states, with variable and constant domains either bent or straight. AL LCs displayed a distinct, low-populated, straight conformation (termed H state), which maximized solvent accessibility at the interface between constant and variable domains. Hydrogen-deuterium exchange mass spectrometry experimentally validated this H state. These findings reconcile diverse experimental observations and provide a precise structural target for future drug design efforts.

Keywords: amyloidogenic light chain; biochemistry; chemical biology; conformational dynamics; hydrogen deuterium exchange; molecular biophysics; molecular dynamics; none; small-angle X-ray scattering; structural biology.


Conflict of interest statement

CP, SP, LB, MS, MM, RR, VS, FB, MN, GM, GP, SH, SR, CC No competing interests declared

Figures

Figure 1.
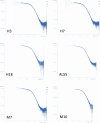
Figure 1.. Comparison of small-angle X-ray scattering (SAXS) data and single light-chain (LC) structures.
Kratky plots of for amyloidosis (AL) and multiple myeloma (MM) LCs. The experimental (orange) and theoretical (black) curves (top panels) and the associated residuals (bottom panels) indicate that AL-LC solution behavior deviates from reference structures more than MM-LC. SAXS was measured as follows: H3 measured in bulk (Hamburg), 3.4 mg/ml; H7 measured in bulk (Hamburg), 3.4 mg/ml; H18 measured by size-exclusion chromatography (SEC)-SAXS (ESRF [European Synchrotron radiation facility]) with the injection concentration of at 2.8 mg/ml; AL55 measured in bulk (ESRF), 2.6 mg/ml; M7 measured in bulk (Hamburg), 3.6 mg/ml; and M10 measured by SEC-SAXS with the injection concentration of 6.7 mg/ml (ESRF). Theoretical SAXS curves were calculated using crysol (Manalastas-Cantos et al., 2021). Log-log plots are shown in Figure 1—figure supplement 1.
Figure 1—figure supplement 1.
Figure 1—figure supplement 1.. Log-log plots representing the small-angle X-ray scattering experimental curves for the six proteins.
Figure 1—figure supplement 2.
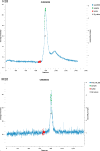
Figure 1—figure supplement 2.. Size exclusion coupled multiangle light scattering analysis of purified light chains (AL55, H3, H7, H18, M7, and M10).
The name of each protein is labeled above their corresponding profile. The obtained molecular weight (MW) is highlighted in red.
Figure 1—figure supplement 3.
Figure 1—figure supplement 3.. Small-angle X-ray scattering–size-exclusion chromatography average intensity for H18 and M10.
Selected frames for buffer and sample are reported together with the analysis of the estimated Rg values, indicating that the selection corresponds to homogeneous conformations.
Figure 2.
Figure 2.. Light-chain small-angle X-ray scattering (SAXS)-driven molecular dynamics simulations.
(A) Kratky plots and associated residuals (bottom panels) comparing experimental (orange), and theoretical (black) curves obtained by averaging over the metainference ensemble for H3, H7, H18, AL55, M7, and M10, respectively. Theoretical SAXS curves were calculated using crysol (Manalastas-Cantos et al., 2021). (B) Residue-wise root mean square fluctuations (RMSFs) obtained by averaging the two metainference replicates and the two equivalent domains for the six systems studied. The top panel shows data for the variable domains, while the bottom panel shows data for the constant domain. Residues are reported using Chothia and Lesk numbering (Al-Lazikani et al., 1997). (C) Schematic representation of two global collective variables used to compare the conformational dynamics of the different systems, namely the distance between the center of mass of the variable domain (VL) and constant domain (CL) dimers and the angle describing the bending of the two domain dimers.
Figure 3.
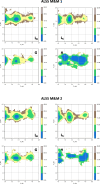
Figure 3.. Free energy surfaces (FESs) for the six light-chain systems under study by metadynamics metainference molecular dynamics simulations.
For each system, the simulations are performed in duplicate. The x-axis represents the elbow angle, indicating the relative bending of the constant and variable domains (in radians), while the y-axis represents the distance in nm between the center of mass of the constant domain (CL) and variable domain (VL) dimers. The free energy is shown with color and isolines every 2kBT corresponding to 5.16 kJ/mol. On each FES are represented four regions (green, LB state; red, LS state; blue, H state; and black, G state), highlighting the main conformational states. For each region, a representative structure is reported in a rectangle of the same color.
Figure 4.
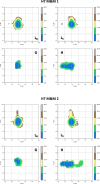
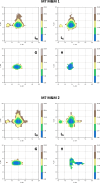
Figure 4.. Free energy surfaces for the four substates identified in Figure 3 in the case of the first H3 metainference simulation.
The x-axis shows the distance between the centers of mass of the constant domains, while the y-axis shows the distance between the centers of mass of the variable domains. The free energy is shown with color and isolines every 2kBT corresponding to 5.16 kJ/mol. See also Figure 4—figure supplements 1–6 for the same analysis on the other simulations.
Figure 4—figure supplement 1.
Figure 4—figure supplement 1.. Free energy surfaces for the four substates identified in Figure 3 in the case of the second H3 metainference simulation.
The x-axis shows the distance between the centers of mass of the constant domains, while the y-axis shows the distance between the centers of mass of the variable domains. The free energy is shown with color and isolines every 2kBT corresponding to 5.16 kJ/mol.
Figure 4—figure supplement 2.
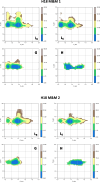
Figure 4—figure supplement 2.. Free energy surfaces for the four substates identified in Figure 3 in the case of the first (top) and second (bottom) H7 metainference simulation.
The x-axis shows the distance between the centers of mass of the constant domains, while the y-axis shows the distance between the centers of mass of the variable domains. The free energy is shown with color and isolines every 2kBT corresponding to 5.16 kJ/mol.
Figure 4—figure supplement 3.
Figure 4—figure supplement 3.. Free energy surfaces for the four substates identified in Figure 3 in the case of the first (top) and second (bottom) H18 metainference simulation.
The x-axis shows the distance between the centers of mass of the constant domains, while the y-axis shows the distance between the centers of mass of the variable domains. The free energy is shown with color and isolines every 2kBT corresponding to 5.16 kJ/mol.
Figure 4—figure supplement 4.
Figure 4—figure supplement 4.. Free energy surfaces for the four substates identified in Figure 3 in the case of the first (top) and second (bottom) AL55 metainference simulation.
The x-axis shows the distance between the centers of mass of the constant domains, while the y-axis shows the distance between the centers of mass of the variable domains. The free energy is shown with color and isolines every 2kBT corresponding to 5.16 kJ/mol.
Figure 4—figure supplement 5.
Figure 4—figure supplement 5.. Free energy surfaces for the four substates identified in Figure 3 in the case of the first (top) and second (bottom) M7 metainference simulation.
The x-axis shows the distance between the centers of mass of the constant domains, while the y-axis shows the distance between the centers of mass of the variable domains. The free energy is shown with color and isolines every 2kBT corresponding to 5.16 kJ/mol.
Figure 4—figure supplement 6.
Figure 4—figure supplement 6.. Free energy surfaces for the four substates identified in Figure 3 in the case of the first (top) and second (bottom) M10 metainference simulation.
The x-axis shows the distance between the centers of mass of the constant domains, while the y-axis shows the distance between the centers of mass of the variable domains. The free energy is shown with color and isolines every 2kBT corresponding to 5.16 kJ/mol.
Figure 5.
Figure 5.. Hydrogen-deuterium exchange mass spectrometry analysis.
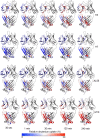
(A) The top panel represents the simplified presentation of the primary structure of a light chain, including variable domain (VL) and constant domain (CL). The location of β-strands according to Chothia and Lesk (Al-Lazikani et al., 1997). (B) The structural mapping and butterfly plot of relative deuterium uptake (Da) of H3. Chain A of H3 structure is colored in a gradient of blue–white–red for an uptake of 0–30% at an exchange time of 30 min. Chain B is shown in gray (right-hand panel). The butterfly plot showing relative deuterium uptake at all time points from 0.5 to 240 min on a gradient of light to dark blue (left-hand panel). (C–E) are the figures corresponding to H7, AL55, and M10, respectively, with the same color coding as in (B). The overall sequence coverage for all proteins was >90%, with a redundancy of >4.0. The VL-VL domains interface peptides covering amino acid residues 34–50 are labeled in orange, while the CL-CL interface region containing 152–180 amino acids is labeled in magenta. Collectively, they form VL-CL interface, which is important to define the H state.
Figure 5—figure supplement 1.
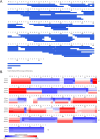
Figure 5—figure supplement 1.. H3 HDX coverage and uptake.
(A) Peptide coverage map of protein H3. The total number of peptides is 61, with a coverage of 98.6% and a redundancy of 4.16. (B) As shown on the left, heat map as a function of hydrogen-deuterium exchange-time at different time points. The relative deuterium uptake is color-coded from blue-to-white-to-red for 0–30% as indicated by the scale bar below.
Figure 5—figure supplement 2.
Figure 5—figure supplement 2.. H7 HDX coverage and uptake.
(A) Peptide coverage map of protein H7. The total number of peptides is 50, with a coverage of 92.5% and a redundancy of 4.01. (B) Heat map as a function of hydrogen-deuterium exchange-time at different time points as shown on the left. The relative deuterium uptake is color-coded from blue-to-white-to-red for 0–30% as shown by the scale bar below.
Figure 5—figure supplement 3.
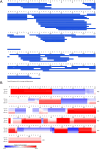
Figure 5—figure supplement 3.. AL55 HDX coverage and uptake.
(A) Peptide coverage map of protein AL55. The total number of peptides is 57, with a coverage of 98.6% and a redundancy of 4.06. (B) Heat map as a function of hydrogen-deuterium exchange-time at different time points as shown on the left. The relative deuterium uptake is color-coded from blue-to-white-to-red for 0–30% as shown by the scale bar below.
Figure 5—figure supplement 4.
Figure 5—figure supplement 4.. M10 HDX coverage and uptake.
(A) Peptide coverage map of protein M10. The total number of peptides is 62, with a coverage of 99.1% and a redundancy of 4.69. (B) As shown on the left, heat map as a function of hydrogen-deuterium exchange-time at different time points. The relative deuterium uptake is color-coded from blue-to-white-to-red for 0–30% as indicated by the scale bar below.
Figure 5—figure supplement 5.
Figure 5—figure supplement 5.. Hydrogen-deuterium exchange kinetics of deuterium uptake at each time points from 0 to 240 min for the selected peptides.
The colors corresponding to each protein H3 (blue), H7 (green), AL55 (light green), and M10 (orange) are shown in the first panel. The residue numbers corresponding to the individual peptides are shown in the upper-left corner of the individual panels. The panels for peptides containing residues 34–50 and 152–180 highlighted in bold are of our interest in this study.
Figure 5—figure supplement 6.
Figure 5—figure supplement 6.. Structural mapping of relative deuterium uptake on chain A of each dimeric light chain: relative deuterium uptake of H3, H7, AL55, and M10 at different time points of 0.5–240 min on a scale of 0–30% uptake.
The color gradient is from blue–white–red. Blue means no exchange, and red means an exchange of 30%. The protein name is written on the right-hand side of each panel. Chain B is colored in gray.
Figure 6.
Figure 6.. Schematic representation summarizing our findings in the context of previous work on the biophysical properties of amyloidogenic light chains (LCs).
We propose that the H state is the conformational fingerprint distinguishing amyloidosis (AL) LCs from other LCs, which, together with other features, contributes to the amyloidogenicity of AL LCs.
Figure 6—figure supplement 1.
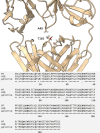
Figure 6—figure supplement 1.. Zoom-in on the crystal structure of M7 to show the hydrophobic contact between A40 in the variable domain (VL) and T165 in the constant domain (CL).
The multiple sequence alignment for M7, H18, and their germline sequence (IGLV3-19*01 for the VL and IGLC2*02 for the CL) is reported below.
Figure 6—figure supplement 2.
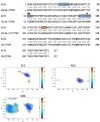
Figure 6—figure supplement 2.. Pairwise sequence alignment between H3 and its corresponding germline as identified by igBLAST using the IGMT databases.
The three complementarity-determining regions and the linker region are highlighted in light blue and orange, respectively. The red circles indicate residues for which the left alpha is the most populated region in the Ramachandran plot. Free energy surfaces (in kJ/mol) representing the Ramachandran plot for the indicated residues are reported in the bottom panels.
Figure 6—figure supplement 3.
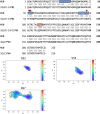
Figure 6—figure supplement 3.. Pairwise sequence alignment between H7 and its corresponding germline as identified by igBLAST using the IGMT databases.
The three complementarity-determining regions and the linker region are highlighted in light blue and orange, respectively. The red circles indicate residues for which the left alpha is the most populated region in the Ramachandran plot. Free energy surfaces (in kJ/mol) representing the Ramachandran plot for the indicated residues are reported in the bottom panels.
Figure 6—figure supplement 4.
Figure 6—figure supplement 4.. Pairwise sequence alignment between H18 and its corresponding germline as identified by igBLAST using the IGMT databases.
The three complementarity-determining regions and the linker region are highlighted in light blue and orange, respectively. The red circles indicate residues for which the left alpha is the most populated region in the Ramachandran plot. Free energy surfaces (in kJ/mol) representing the Ramachandran plot for the indicated residues are reported in the bottom panels.
Figure 6—figure supplement 5.
Figure 6—figure supplement 5.. Pairwise sequence alignment between AL55 and its corresponding germline as identified by igBLAST using the IGMT databases.
The three complementarity-determining regions and the linker region are highlighted in light blue and orange, respectively. The red circles indicate residues for which the left alpha is the most populated region in the Ramachandran plot. Free energy surfaces (in kJ/mol) representing the Ramachandran plot for the indicated residues are reported in the bottom panels.
Figure 6—figure supplement 6.
Figure 6—figure supplement 6.. Pairwise sequence alignment between M7 and its corresponding germline as identified by igBLAST using the IGMT databases.
The three complementarity-determining regions and the linker region are highlighted in light blue and orange, respectively. The red circles indicate residues for which the left alpha is the most populated region in the Ramachandran plot. Free energy surfaces (in kJ/mol) representing the Ramachandran plot for the indicated residues are reported in the bottom panels.
Figure 6—figure supplement 7.
Figure 6—figure supplement 7.. Pairwise sequence alignment between M10 and its corresponding germline as identified by igBLAST using the IGMT databases.
The three complementarity-determining regions and the linker region are highlighted in light blue and orange, respectively. The red circles indicate residues for which the left alpha is the most populated region in the Ramachandran plot. Free energy surfaces (in kJ/mol) representing the Ramachandran plot for the indicated residues are reported in the bottom panels.

Update of

  • doi: 10.1101/2024.07.12.603200
  • doi: 10.7554/eLife.102002.1
  • doi: 10.7554/eLife.102002.2

References

    1. Abraham MJ, Murtola T, Schulz R, Páll S, Smith JC, Hess B, Lindahl E. GROMACS: High performance molecular simulations through multi-level parallelism from laptops to supercomputers. SoftwareX. 2015;1–2:19–25. doi: 10.1016/j.softx.2015.06.001. - DOI
    1. Absmeier RM, Rottenaicher GJ, Svilenov HL, Kazman P, Buchner J. Antibodies gone bad - the molecular mechanism of light chain amyloidosis. The FEBS Journal. 2023;290:1398–1419. doi: 10.1111/febs.16390. - DOI - PubMed
    1. Achour A, Broggini L, Han X, Sun R, Santambrogio C, Buratto J, Visentin C, Barbiroli A, De Luca CMG, Sormanni P, Moda F, De Simone A, Sandalova T, Grandori R, Camilloni C, Ricagno S. Biochemical and biophysical comparison of human and mouse beta-2 microglobulin reveals the molecular determinants of low amyloid propensity. The FEBS Journal. 2020;287:546–560. doi: 10.1111/febs.15046. - DOI - PubMed
    1. Ahmed MC, Skaanning LK, Jussupow A, Newcombe EA, Kragelund BB, Camilloni C, Langkilde AE, Lindorff-Larsen K. Refinement of α-synuclein ensembles against SAXS data: comparison of force fields and methods. Frontiers in Molecular Biosciences. 2021;8:654333. doi: 10.3389/fmolb.2021.654333. - DOI - PMC - PubMed
    1. Al-Lazikani B, Lesk AM, Chothia C. Standard conformations for the canonical structures of immunoglobulins. Journal of Molecular Biology. 1997;273:927–948. doi: 10.1006/jmbi.1997.1354. - DOI - PubMed