. 2025 Oct;292(19):5086-5104.
doi: 10.1111/febs.70050. Epub 2025 Mar 3.

Inflammation and epithelial-mesenchymal transition in a CFTR-depleted human bronchial epithelial cell line revealed by proteomics and human organ-on-a-chip

Affiliations

Inflammation and epithelial-mesenchymal transition in a CFTR-depleted human bronchial epithelial cell line revealed by proteomics and human organ-on-a-chip

Domenico Mattoscio et al. FEBS J. 2025 Oct.

Abstract

Cystic fibrosis (CF) is a genetic disease caused by mutations in the CF transmembrane conductance regulator (CFTR) gene, leading to chronic, unresolved inflammation of the airways due to uncontrolled recruitment of polymorphonuclear leukocytes (PMNs). Evidence indicates that CFTR loss-of-function, in addition to promoting a pro-inflammatory phenotype, is associated with an increased risk of developing cancer, suggesting that CFTR can exert tumor-suppressor functions. Three-dimensional (3D) in vitro culture models, such as the CF lung airway-on-a-chip, can be suitable for studying PMN recruitment, as well as events of cancerogenesis, that is epithelial cell invasion and migration, in CF. To gather insight into the pathobiology of CFTR loss-of-function, we generated CFTR-knockout (KO) clones of the 16HBE14o- human bronchial cell line by CRISPR/Cas9 gene editing, and performed a comparative proteomic analysis of these clones with their wild-type (WT) counterparts. Systematic signaling pathway analysis of CFTR-KO clones revealed modulation of inflammation, PMN recruitment, epithelial cell migration, and epithelial-mesenchymal transition. Using a latest-generation organ-on-a-chip microfluidic platform, we confirmed that CFTR-KO enhanced PMN recruitment and epithelial cell invasion of the endothelial layer. Thus, a dysfunctional CFTR affects multiple pathways in the airway epithelium that ultimately contribute to sustained inflammation and cancerogenesis in CF.

Keywords: CRISPR/Cas9; cystic fibrosis; epithelial–mesenchymal transition; organ‐on‐a‐chip; proteomics.


Conflict of interest statement

H.B. and Y.C.Y. are employees of Xellar Inc., which specializes in combining human organ chip models with imaging for disease modeling and drug testing. It should be noted that the devices employed in the research presented in this manuscript are not sourced from Xellar Inc.

Figures

Fig. 1
Fig. 1
Cystic fibrosis transmembrane conductance regulator (CFTR) ablation by CRISPR/Cas9 mutagenesis. (A) DNA sequencing of single guide RNA (sgRNA) targeting region in one wild‐type (WT) (upper image) and three CFTR‐knockout (KO) 16HBE14o‐cells (lower image). The electropherograms refer to the region of exon 1 targeted by the CRISPR/Cas9 system. The red box in the control clone (top) refers to the ‘G’ corresponding to the ATG of the first codon, whereas in the KO clones (bottom) is referred to the changes in the WT sequence. (B) Western blot analysis of CFTR expression using 596 mouse anti‐human CFTR antibody (UNC, see Methods for details) diluted 1:1000 with 3% milk in TBS‐T (Top). The lower part of the membrane was incubated with the anti β‐Actin antibody (#A5441; Sigma‐Aldrich™) diluted 1:5000 with 3% milk in TBS‐T (Bottom). The white box refers to the portion of the membrane corresponding to the C band of CFTR protein, which was not detected in KO clones. The western blot shown is representative of n = 2 experiments. (C) CFTR activity assay by yellow fluorescent protein (YFP) (see Methods for details) in WT and KO‐1 clones. 90‐s videos were recorded to assess the fluorescence decay after the addition of sodium iodide (NaI). Data points are mean ± SEM from six replicates of one experiment, each containing the fluorescence intensity of 10 cells. ****P < 0.0001 from 25 to 90 s (two‐way ANOVA and Sidak's multiple‐comparison test).
Fig. 2
Fig. 2
Comparative proteomic analysis between cystic fibrosis transmembrane conductance regulator (CFTR) wild‐type (WT) and knockout (KO) clones. (A) Venn diagram representing the overlap of expressed proteins in WT (n = 521) and CFTR‐KO (n = 437) cells. (B) Heat map of significant differentially expressed proteins (DEPs) in CFTR‐KO vs. WT cells (P‐value <0.05; Student t‐test). (C) Volcano plot of common DEPs in CFTR‐KO vs. WT cells. The color intensity indicates the level of protein expression: red, upregulated, and blue, downregulated. FC = fold change. P‐value was calculated using the Student's t‐test. (D) MSigDB‐overlap analysis of DEPs as in (B) with the Hallmark (H) gene sets (N = 50). The bubble plot shows the top five overlapping protein sets among CFTR‐KO‐regulated proteins (these sets include the EMT transition—arrow). Bubble size represents the statistical significance of overlap expressed as −log10(q‐value), where the larger the size, the greater the significance. In the x‐axis, H‐gene set name; in y‐axes, the ratio of overlap (k/K) is shown, where ‘k’ represents the number of CFTR‐KO regulated proteins while ‘K’ is the number of genes in the specific H‐protein set. Bubble color reflects the number of CFTR‐KO DEPs (k). The complete results are provided in Tables S3 and S4. (E) Analysis of Biological Processes activated in CFTR‐KO vs. WT cells (540 DEPs; P‐value < 0.05) using UniprotKB Keywords (UP KW) in DAVID. Each bar represents a distinct biological process, with the length of the bar indicating the number of proteins associated with that process. The analysis shown in this figure was created using the values in the protein list in Table S1 (triplicates of n = 3 for both WT and KO clones).
Fig. 3
Fig. 3
Ingenuity Pathway Analysis (IPA) of proteomic data. Cystic fibrosis transmembrane conductance regulator (CFTR)‐knockout (KO) epithelial clones showed a proteomic profile indicative of increased immune cell recruitment and spreading. The analysis was performed using the values in the protein list in Table S1 (n = 3 for both WT and KO clones). (A) Bubble plot of top canonical pathways predicted by IPA with z‐score value, which represents a measure of the predicted direction of the pathway activity. Each bubble represents a canonical pathway, and the bubble size is directly proportional to the number of proteins that overlap the pathway. Bubble color represents z‐scores as per the legend. (B) IPA representation of proteins involved in epithelial junctions. (C) IPA representation of proteins involved in integrin receptor signaling. (D) Left: Graphical summary of the major biological themes in KO clones as determined by IPA core analysis of DEPs. Right: legend relative to panels B–D. Red proteins: upregulated in KO clones; green proteins: downregulated in KO clones, with the intensity of colored infill indicating the level of up or downregulation, respectively. The purple outline indicates differentially expressed molecules in our dataset. Predicted modulated proteins and functions in KO clones are represented in blue (downregulated) or orange (upregulated). Yellow lines indicate nonconsistent relationships. Lines indicate relationships leading to activation (orange) or inhibition (blue). Gray lines point to nonpredicted effects. Solid lines represent direct interactions, whereas dashed lines represent indirect interactions.
Fig. 4
Fig. 4
Cystic fibrosis transmembrane conductance regulator (CFTR)‐knockout (KO) related inflammatory profile. (A) Cytokine and chemokine released by resting wild‐type (WT) and CFTR‐KO 16HBE14o‐ in 24 h. Bars represent mean ± SD of n = 3. P‐values were adjusted with the Bonferroni‐Dunn multiplicity test: *P < 0.05, **P < 0.01; ***P < 0.001, ****P < 0.0001. (B) Representative immunofluorescence images (one out of 20 for CFTR‐WT and one out of 30 for CFTR‐KO) of CFSE‐live‐stained polymorphonuclear PMN in the lower membrane side of WT‐(left) and CFTR‐KO (right) chips. Scale bars: 100 μm. (C) PMN cell number quantification in WT and KO chips. Dots represent the PMN count within 10 random images per each chip acquired along the entire path of the channel (20 dots from n = 2 WT chips and 30 dots from n = 3 KO chips from one experiment). Mean ± SEM is also shown. Nonparametric data distribution was assessed using the Mann–Whitney T‐test ****P < 0.0001.
Fig. 5
Fig. 5
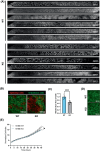
Invasive phenotype of cystic fibrosis transmembrane conductance regulator (CFTR)‐knockout (KO) cells. (A) Tile imaging of endothelial cell (EC) distribution in the lower surface of the membrane that divides the two channels of n = 6 WT + 6 KO chips. Processed images after noise reduction are shown. Scale bars: 1000 μm. (B) Confocal images showing EPCAM‐stained epithelial cells (red) infiltrating CD31‐stained EC (green) in the lower surface of the membrane. Scale bars: 100 μm. Representative images of n = 6 WT and 6 KO chips. (C) Quantification of the relative sum area occupied by ECs in the lower side of the membrane of n = 6 WT and 6 KO chips shown in panel A. Bars represent mean ± SD of a total number of n = 6 for WT and n = 6 for KO chips derived from two experiments. Data were analyzed using an unpaired T‐test. ***P < 0.001. (D) Integrity of the endothelial layer in the lower side of the bottom channel. Scale bars: 100 μm. (E) Relative growth of WT or KO 16HBE14o‐analyzed with impedance‐based real‐time cell analysis (ACEA). Data are expressed as relative cell growth normalized at the time of cell seeding on the plate. Data points are mean ± SEM from 2 technical replicates. *P < 0.05 at 45 h (two‐way ANOVA and Sidak's multiple‐comparison test).
Fig. 6
Fig. 6
Low cystic fibrosis transmembrane conductance regulator (CFTR) expression drives cancer hallmarks in lung adenocarcinoma (LUAD). (A) Diagram of the experimental strategy and analyses. (B) Kaplan–Meier curve survival analysis (overall and disease‐free survival) of LUAD patients stratified for high (n = 127) or low (n = 127) CFTR expression score. Log‐rank test P‐value is reported. (C) Gene Ontology (GO) of enriched molecular functions, cellular components, and biological processes in high vs. low CFTR tumors as identified by SRplot. GO terms, gene count, enrichment score, and P‐values.

References

    1. Riordan JR, Rommens JM, Kerem B, Alon N, Rozmahel R, Grzelczak Z, Zielenski J, Lok S, Plavsic N, Chou JL et al. (1989) Identification of the cystic fibrosis gene: cloning and characterization of complementary DNA. Science 245, 1066–1073. - PubMed
    1. Saint‐Criq V & Gray MA (2017) Role of CFTR in epithelial physiology. Cell Mol Life Sci 74, 93–115. - PMC - PubMed
    1. Stoltz DA, Meyerholz DK & Welsh MJ (2015) Origins of cystic fibrosis lung disease. N Engl J Med 372, 351–362. - PMC - PubMed
    1. Cantin AM, Hartl D, Konstan MW & Chmiel JF (2015) Inflammation in cystic fibrosis lung disease: pathogenesis and therapy. J Cyst Fibros 14, 419–430. - PubMed
    1. Balázs A & Mall MA (2019) Mucus obstruction and inflammation in early cystic fibrosis lung disease: emerging role of the IL‐1 signaling pathway. Pediatr Pulmonol 54(Suppl 3), S5–S12. - PubMed

MeSH terms

Substances