Comparative Study
. 2025 Mar 3;66(3):1.
doi: 10.1167/iovs.66.3.1.

Morphological Comparison of Astrocytes in the Lamina Cribrosa and Glial Lamina

Affiliations
Comparative Study

Morphological Comparison of Astrocytes in the Lamina Cribrosa and Glial Lamina

Susannah Waxman et al. Invest Ophthalmol Vis Sci. .

Abstract

Purpose: Although the mechanisms underlying glaucomatous neurodegeneration are not yet well understood, cellular and small animal models suggest that lamina cribrosa (LC) astrocytes undergo early morphologic and functional changes, indicating their role as early responders to glaucomatous stress. These models, however, lack the LC found in larger animals and humans, leaving the in situ morphology of LC astrocytes and their role in glaucoma initiation underexplored. In this work, we aimed to characterize the morphology of LC astrocytes in situ and determine differences and similarities with astrocytes in the mouse glial lamina (GL), the analogous structure in a prominent glaucoma model.

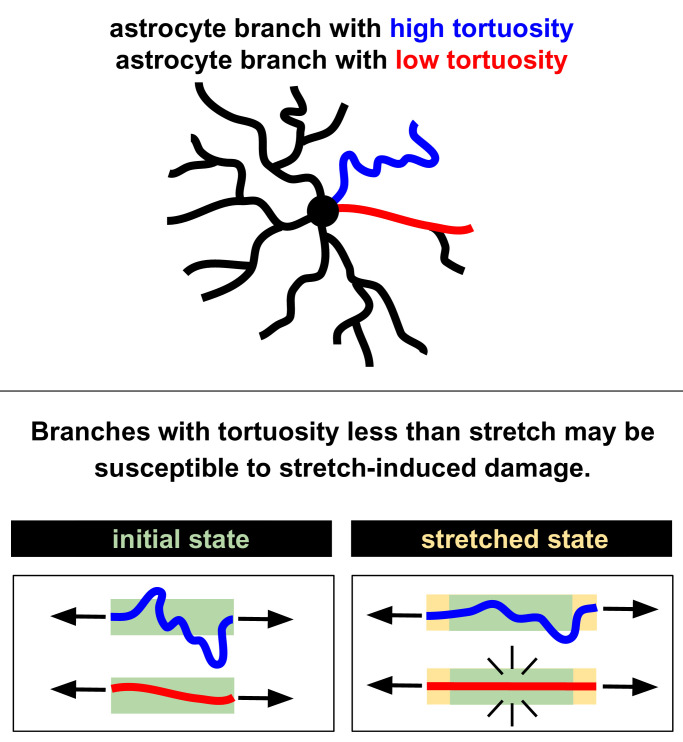
Methods: Astrocytes in the LCs of 22 eyes from goats, sheep, and pigs were stochastically labeled via Multicolor DiOlistics and imaged in situ using confocal microscopy. The 3D models of DiOlistically labeled LC astrocytes and hGFAPpr-GFP mouse GL astrocytes were constructed to quantify morphological features related to astrocyte functions. LC and GL astrocyte cross-pore contacts, branching complexity, branch tortuosity, and cell and branch span were compared.

Results: LC astrocytes displayed distinct spatial relationships with collagen, greater branching complexity, and higher branch tortuosity compared to GL astrocytes. Despite substantial differences in their anatomic environments, LC and GL astrocytes had similar cell and branch spans.

Conclusions: Astrocyte morphology in the LC was characterized through multicolor DiOlistic labeling. LC and GL astrocytes have both distinct and shared morphological features. Further research is needed to understand the potentially unique roles of LC astrocytes in glaucoma initiation and progression.


Conflict of interest statement

Disclosure: S. Waxman, None; H. Schilpp, None; A. Linton, None; T.C. Jakobs, None; I.A. Sigal, None

Figures

Figure 1.
Figure 1.
The LC and GL are structurally distinct. Collagen organization and canal size differ substantially among the LC and GL. Example images of the goat LC (left) and the mouse GL (right). Neural tissues (dark regions) in the LC are divided into pores by a network of robust collagenous beams (grayscale). Neural tissues of the GL are not divided into pores by collagen beams. The LC is notably larger than the GL. The GL occupies the space of approximately two to five LC neural tissue pores. The inset in the left panel shows the GL at the same scale as the LC. Scale bars = 250 µm.
Figure 2.
Figure 2.
Astrocytes in the LC and GL had distinct and shared morphological features. LC astrocytes had greater branching complexity, branch tortuosity, and cross-pore contacts. LC and GL astrocytes had similar cell and branch spans.
Figure 3.
Figure 3.
LC astrocyte morphologies are diverse. Forty image-derived 3D segmentations of goat LC astrocytes were created for morphometric analysis. Soma center points are indicated in blue and astrocyte branches are indicated in gray. (Left) Coronal view and (right) sagittal view.
Figure 4.
Figure 4.
The arrangement of individual LC astrocytes within the network of LC collagenous beams. Astrocytes can be (A) confined to a single neural tissue pore or (B) span multiple pores. Top rows in A and B show neural tissue pore boundaries delineated in yellow. Bottom rows show astrocyte images without pore delineations. Astrocytes are shown in color. DAPI and collagenous beams are shown in grayscale. Sample with *, second from the right in panel A, was not DAPI-labeled. Dark regions indicate neural tissue pore areas without labeled astrocytes. Scale bars = 20 µm.
Figure 5.
Figure 5.
Sholl analysis reveals higher branching complexity in LC astrocytes than in GL astrocytes. Branching complexity was measured via 3D Sholl analysis. Area under the Sholl curve was compared between LC and GL astrocytes. (A) Bold lines represent the mean crossings at each Sholl sphere radius, and the shaded areas represent the standard deviation. Thin lines show traces from example individual cells, shown below in (B). Scale bars = 20 µm. * Denotes a significant difference in area under the curve for LC and GL astrocyte Sholl analysis.
Figure 6.
Figure 6.
LC astrocytes have more branches than GL astrocytes. (A) Distribution of a number of branches per astrocyte shown in a violin plot, * connotes a significant difference between the LC and GL, P < 0.05. (B) Number of branches per astrocyte, sorted from low to high. (C) Example LC (blue) and GL (red) astrocytes with the lowest (left) and highest (right) number of branches. Scale bars = 20 µm.
Figure 7.
Figure 7.
Branch hierarchy is deeper in LC astrocytes than GL astrocytes. (A) Branch hierarchy was significantly deeper in LC astrocytes than GL astrocytes (P < 0.001). (B) Branch hierarchy of LC astrocytes by cell. Each box plot represents an individual astrocyte, blue points each represent a branch, and orange points represent the mean branch hierarchy per astrocyte. Note that measurements of hierarchy are integers, which results in clusters of points in the box plots. The points in these clusters do not look identical because the plotting technique uses horizontal jitter and partial transparency to help more clearly display multiple points corresponding with branches of the same hierarchy. Example astrocytes with low, near-middle, and high mean branch hierarchy are shown below. Their respective box plots are highlighted in yellow. Scale bar = 20 µm.
Figure 8.
Figure 8.
Branch tortuosity is higher in LC astrocytes than GL astrocytes. (A) Branch tortuosity was significantly higher in LC astrocytes than GL astrocytes (P < 0.001). (B) Branch tortuosity of LC astrocytes by cell. Each box plot represents an individual astrocyte, blue points each represent a branch, and orange points represent mean branch hierarchy per astrocyte. Example astrocytes with low, near-middle, and high mean branch tortuosity shown below and their respective box plots are highlighted in yellow. Scale bar = 20 µm.
Figure 9.
Figure 9.
Branch length was not significantly different between LC and GL astrocytes. (A) Branch length of LC astrocytes was not significantly different between LC and GL astrocytes (P = 0.10). (B) Branch length of LC astrocytes by cell. Each box plot represents an individual astrocyte, blue points each represent a branch, and orange points represent mean branch hierarchy per astrocyte. Example astrocytes with low, near-middle, and high mean branch length shown below and their respective box plots are highlighted in yellow. Scale bar = 20 µm.
Figure 10.
Figure 10.
Branch thickness of LC astrocytes was not significantly different between LC and GL astrocytes. (A) Branch length of LC astrocytes was not significantly different between LC and GL astrocytes. (P > 0.05). (B) Branch thickness of LC astrocytes by cell. Each box plot represents an individual astrocyte, blue points each represent a branch, and orange points represent mean branch hierarchy per astrocyte. Example astrocytes with low, near-middle, and high mean branch thickness shown below and their respective box plots are highlighted in yellow. Scale bar = 20 µm.
Figure 11.
Figure 11.
Astrocytes in the LC and GL occupy similar degrees of spatial territory. Astrocyte spatial territories were quantified as convex hull area and volume. Convex hull (A) area and (B) volume were not significantly different between the LC and GL (P = 0.98 and 0.21, respectively). Violin plots show aggregate data distribution and bar charts show cell-by-cell distribution. Bars bolded in (A) indicate representative LC and GL astrocyte convex hulls shown in C. LC = blue; GL = red. Scale bar =20 µm.
Figure 12.
Figure 12.
LC astrocytes demonstrate shared spatial territories. In contrast with other central nervous system tissues, astrocytes in the LC do not demonstrate distinct spatial domains or tiling. Overlapping astrocyte spatial territories has been demonstrated previously in the mouse GL. Example LC astrocytes with overlapping spatial territories are shown in (A), (B), and (C). Detail of regions where astrocytes overlap is shown in (A’), (B’), and (C’). Scale bars = 20 µm.
Figure 13.
Figure 13.
Longitudinal processes of LC astrocytes. Example LC astrocytes with processes oriented primarily along the anterior-posterior direction. Color scale denotes astrocyte branch location along the anterior-posterior axis. Scale bars = 20 µm.
Figure 14.
Figure 14.
Differences and similarities between the GL and LC branch features appear consistent across species. Branch features of all astrocytes quantified from species with an LC (blue) and from the GL (red) demonstrate similar relationships of goat versus mouse with a more general pattern of LC versus GL. Mean number of branches per astrocyte, branch hierarchy, and branch tortuosity were higher in all species with an LC compared to mouse. Mean branch thickness and length were relatively similar among species with an LC and with mouse.
Figure 15.
Figure 15.
Astrocyte branch tortuosity as a mechanism to withstand IOP-induced insult. Astrocyte branches with slack to withstand IOP-induced stretch may be mechanically protected in comparison to astrocyte branches that do not have the degree of slack to withstand IOP-induced stretch. Example astrocyte branches with high and low tortuosity are shown in blue and red, respectively.

Update of

References

    1. Stowell C, Burgoyne CF, Tamm ER, Ethier CR, Lasker/IRRF initiative on astrocytes and glaucomatous neurodegeneration participants. Biomechanical aspects of axonal damage in glaucoma: a brief review. Exp Eye Res. 2017; 157: 13–19. - PMC - PubMed
    1. Tamm ER, Ethier CR, Lasker/IRRF initiative on astrocytes and glaucomatous neurodegeneration participants. Biological aspects of axonal damage in glaucoma: a brief review. Exp Eye Res. 2017; 157: 5–12. - PMC - PubMed
    1. Verisokin AY, Verveyko DV, Postnov DE, Brazhe AR.. Modeling of astrocyte networks: toward realistic topology and dynamics. Front Cell Neurosci. 2021; 15: 645068. - PMC - PubMed
    1. Boal AM, Risner ML, Cooper ML, Wareham LK, Calkins DJ.. Astrocyte networks as therapeutic targets in glaucomatous neurodegeneration. Cells. 2021; 10(6): 161. - PMC - PubMed
    1. Fields RD, Woo DH, Basser PJ.. Glial regulation of the neuronal connectome through local and long-distant communication. Neuron. 2015; 86(2): 374–386. - PMC - PubMed

Publication types