. 2025 May 15;85(10):1857-1873.
doi: 10.1158/0008-5472.CAN-24-1393.

De Novo Serine Synthesis Is a Metabolic Vulnerability That Can Be Exploited to Overcome Sunitinib Resistance in Advanced Renal Cell Carcinoma

Affiliations

De Novo Serine Synthesis Is a Metabolic Vulnerability That Can Be Exploited to Overcome Sunitinib Resistance in Advanced Renal Cell Carcinoma

Manon Teisseire et al. Cancer Res. .

Abstract

Sunitinib is an oral tyrosine kinase inhibitor used in treating advanced renal cell carcinoma (RCC) that exhibits significant efficacy but faces resistance in 30% of patients. Identifying the molecular mechanisms underlying resistance could enable the development of strategies to enhance sunitinib sensitivity. In this study, we showed that sunitinib induces a metabolic shift leading to increased serine synthesis in RCC cells. Activation of the GCN2-ATF4 stress response pathway was identified as the mechanistic link between sunitinib treatment and elevated serine production. The increased serine biosynthesis supported nucleotide synthesis and sustained cell proliferation, migration, and invasion following sunitinib treatment. Inhibiting key enzymes in the serine synthesis pathway, such as phosphoglycerate dehydrogenase and phosphoserine aminotransferase 1, enhanced the sensitivity of resistant cells to sunitinib. Beyond RCC, similar activation of serine synthesis following sunitinib treatment occurred in a variety of other cancer types, suggesting a shared adaptive response to sunitinib therapy. Together, this study identifies the de novo serine synthesis pathway as a potential target to overcome sunitinib resistance, offering insights into therapeutic strategies applicable across diverse cancer contexts. Significance: Sunitinib treatment induces metabolic reprogramming to provide essential metabolite building blocks for tumor survival, resistance, and progression by upregulating serine biosynthesis, which represents a targetable dependency to enhance therapeutic efficacy.


Conflict of interest statement

No disclosures were reported.

Figures

None
Graphical abstract
Figure 1.
Figure 1.
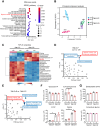
Metabolic reprogramming and increased serine metabolism in sunitinib-treated ccRCC. A, Functional enrichment analysis based on Kyoto Encyclopedia of Genes and Genomes (KEGG) pathways presented as dot–bubble plots. Pathways are ordered by ascending significance, comparing sunitinib-treated 786-O parental cells with control (vehicle-treated) cells. Bubble size is proportional to the impact of each pathway, with the most significantly altered pathways characterized by a high −log(P) value and high pathway impact (top right region). Glycine, serine, and threonine metabolism are highlighted in red. B, Steady-state metabolite profiles of 786-O cells treated with DMSO (veh) or sunitinib (sun; 2.5 μmol/L, 15 hours). The heatmap shows the top 20 significantly altered metabolites, measured by LC-MS/MS, line-normalized, and ranked by P value. Data include 786-O parental (786-O-P) and sunitinib-resistant (786-O-R) cells, each condition represented by biological triplicates. C, Dendrogram illustrating the steady-state metabolomic analysis conducted in triplicate for three conditions: control (veh), sunitinib-treated cells (sun), and cells resistant to sunitinib not treated (R) or treated (R +sun) with sunitinib. The vertical axis represents the complexes analyzed as samples, whereas the horizontal axis indicates the average distance between different clusters. D, Bubble plots depict altered metabolic pathways in 786-O parental cells treated with sunitinib (786-O-P +sun) compared with DMSO (veh). E, Bubble plots illustrate the differences in altered metabolic pathways between sunitinib-resistant cells (786-O R) and parental cells (786-O-P). F, Normalized peak areas of various metabolites serving as intermediates in the serine biosynthesis pathway are presented to provide insights into the impact of sunitinib treatment and resistance mechanisms. G, Normalized peak areas of extracellular serine in 786-O parental cells (786-O-P) or 786-O resistant cells (786-O-R) treated with sunitinib (+) compared with DMSO (−). Glucose-6-P, glucose-6-phosphate; 3-PHP, 3-phospho-hydroxypyruvate. *, P < 0.05 (two-way ANOVA).
Figure 2.
Figure 2.
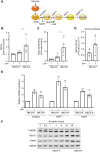
Treatment with sunitinib leads to increased serine biosynthesis in vitro. A, Schematic of the serine biosynthesis pathway and the enzymes directly involved and associated with this pathway. B, Serine levels measured in parental 786-O cells (786-O-P) and sunitinib-resistant cells (786-O-R). Cells were treated with vehicle (DMSO) or sunitinib (sun; 2.5 μmol/L, 48 hours), and normalized peak areas of serine were quantified via LC-MS/MS from five independent steady-state experiments. Data are presented as fold change relative to the control (vehicle-treated 786-O-P cells). C, Ratio of serine to 3PG measured from four independent steady-state experiments in parental RCC cells (786-O-P) treated with vehicle (DMSO) or sunitinib (2.5 μmol/L, 48 hours) and in sunitinib-resistant RCC cells (786-O-R). Data are presented as fold change over control. D, Ratio of serine (M+3) to 3-phosphoglycerate (3PG; M+3) based on two independent flux experiments in parental RCC cells (786-O-P) treated with vehicle or sunitinib (2.5 μmol/L, 48 hours). Cells were incubated in [13C6]-glucose–containing medium for 15 hours, and the synthesis of serine from glucose was measured by LC-MS/MS. E, Relative mRNA expression levels of PHGDH, PSAT1, and PSPH in parental RCC cells (786-O-P) treated with vehicle (DMSO) or sunitinib (2.5 μmol/L, 48 hours) and in sunitinib-resistant cells (786-O-R). The mRNA levels were quantified by qPCR and normalized to control levels. Data represent the mean of three to four independent experiments. F, Immunoblots of parental RCC cells (786-O-P) treated with sunitinib (2.5 μmol/L) for the indicated time points and in sunitinib-resistant RCC cells (786-O-R). ns, nonsignificant; *, P < 0.05; **, P < 0.01; ***, P < 0.001 (two-way ANOVA).
Figure 3.
Figure 3.
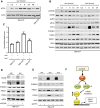
The GCN2/eIF2/ATF4 RE stress response pathway is required for activation of the serine biosynthesis pathway. A, Immunoblots showing ATF4 protein expression in parental RCC cells (786-O-P) treated with DMSO (vehicle) or sunitinib (sun; 2.5 μmol/L) for the indicated time points (0–48 hours) and in sunitinib-resistant cells (786-O-R). B, Immunoblots of 786-O-P cells treated with sunitinib (2.5 μmol/L) or tunicamycin (tuni; 1 μg/mL) for the indicated time points. C, Normalized peak areas of serine from steady-state metabolite profiling in 786-O-P cells treated with DMSO (veh), sunitinib (2.5 μmol/L), or tunicamycin (1 μg/mL) and in sunitinib-resistant cells (786-O-R). Three different experiments were conducted. D, Immunoblots of 786-O-P cells treated with DMSO (veh) or sunitinib (2.5 μmol/L) for 48 hours, following transfection with siGCN2 or control siRNA. E, Immunoblots of 786-O-P cells treated with DMSO (veh), sunitinib (2.5 μmol/L), or tunicamycin (1 μg/mL), following transfection with siATF4 or control siRNA. F, Schematic diagram depicting the mechanism by which sunitinib induces the ISR pathway. Sunitinib activates GCN2, leading to phosphorylation of eIF2α, which enhances ATF4 translation. ATF4 then upregulates serine biosynthesis enzymes, PSAT1 and PSPH, to sustain cellular metabolism under stress. *, P < 0.05; ***, P < 0.001 (two-way ANOVA).
Figure 4.
Figure 4.
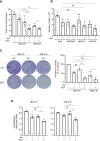
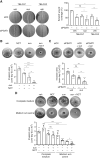
The de novo serine synthesis pathway is essential for proliferation and nucleotide synthesis under sunitinib treatment. A, Cell proliferation assay measured by CellTiter-Glo in 786-O parental (786-O-P) and sunitinib-resistant (786-O-R) cells 96 hours after treatment with vehicle (DMSO), sunitinib (sun; 2.5 μmol/L), NCT-503 (NCT; 30 μmol/L), or a combination of both treatments. Three different experiments were conducted. B, Cell number quantification of 786-O-P cells 96 hours after treatment with vehicle (DMSO) or sunitinib (2.5 μmol/L) after transfection with siRNAs targeting PHGDH, PSAT1, PSPH, or nontargeting pools (siCtl). Cells were counted, and five independent experiments were conducted. C, Clonogenic assay of 786-O-P and 786-O-R cells treated with DMSO (veh), sunitinib (2.5 μmol/L), NCT-503 (30 μmol/L), or their combination. Colonies were cultured for 10 days, photographed, and quantified using ImageJ. The number of colonies is shown as a percentage of the control. Three different experiments were conducted. D, Relative incorporation of radiolabeled U-[14C]-glucose into total RNA in 786-O-P and 786-O-R cells treated with vehicle (DMSO), sunitinib (2.5 μmol/L), NCT-503 (30 μmol/L), or a combination of both treatments for 24 hours. Three different experiments were conducted. ns, nonsignificant; *, P < 0.05; **, P < 0.01; ***, P < 0.001 (two-way ANOVA).
Figure 5.
Figure 5.
The de novo serine synthesis pathway supports migration and invasion under sunitinib treatment. A, Cell migration measured by a scratch wound–healing assay in 786-O parental RCC cells (786-O-P) and sunitinib-resistant cells (786-O-R) treated with DMSO (veh) or sunitinib (sun; 2.5 μmol/L) and transfected with siRNAs targeting PSAT1 (siPSAT1) or nontargeting controls (siCtl). Quantification represents the percentage of wound closure after 16 hours. Data are presented as the mean ± SEM (n = 4). Four different experiments were conducted. B, Quantification of spheroid invasion area of 786-O-P cells after 4 days of invasion. Spheroids were treated with DMSO (veh), sunitinib (2.5 μmol/L), NCT-503 (NCT; 30 μmol/L), or their combination 24 hours before embedding in Matrigel (1 mg/mL). Three different experiments were conducted. C, Spheroid invasion assay of 786-O-P cells transfected with siRNAs targeting PSAT1 (siPSAT1; 25 nmol/L) or nontargeting pools (siCtl) were subsequently treated with DMSO or sunitinib (2.5 μmol/L) for 24 hours before embedding in Matrigel (1 mg/mL). Three different experiments were conducted. D, Spheroid invasion assay of sunitinib-resistant (786-O-R) cells treated with DMSO (veh), sunitinib (2.5 μmol/L), NCT-503 (30 μmol/L), or a combination of both. Spheroids were cultured in either complete media or serine-free media for 4 days. Two different experiments were conducted. ns, nonsignificant; *, P < 0.05; **, P < 0.01; ***, P < 0.001 (two-way ANOVA).
Figure 6.
Figure 6.
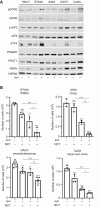
Sunitinib treatment enhances de novo serine metabolism across multiple cancer models. A, Immunoblots various cancer lines, including 786-O (ccRCC), BT549 (TNBC), A549 (lung), DAOY (medulloblastoma), and Cal33 (head and neck), treated with DMSO (veh) or sunitinib (sun; 2.5 μmol/L) for 48 hours. B, Cell count measurements conducted 96 hours after treating BT549, A549, DAOY, and Cal33 with DMSO (veh), sunitinib (2.5 μmol/L), NCT-503 (NCT; 30 μmol/L), or a combination of both treatments. Three different experiments were conducted. ns, nonsignificant; *, P < 0.05; **, P < 0.01; ***, P < 0.001 (two-way ANOVA).
Figure 7.
Figure 7.
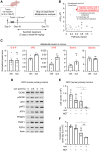
Sunitinib enhances serine biosynthesis pathway in vivo and in ccRCC patient samples. A, Schematic of the in vivo experiment: 786-O cells were subcutaneously implanted into nude mice (n = 5 per group; two tumors per mouse). Mice were treated with either vehicle (veh) or sunitinib (40 mg/kg/day orally, 5 days a week, from day 42 to day 69). Metabolite profiling was conducted on tumor samples collected at the end of the treatment period. B, Bubble plots illustrating altered metabolic pathways in ccRCC xenografts. Pathway comparison between sunitinib-treated and control mice shows that glycine, serine, and threonine metabolism (highlighted in red) is one of the most impacted pathways. The size of each bubble corresponds to the pathway impact. C, Normalized peak areas of metabolites, including intermediates of the serine biosynthesis pathway in ccRCC xenograft models treated with vehicle (veh, DMSO) or sunitinib (sun). D, Immunoblots of fresh human kidney cells treated with DMSO (veh) or sunitinib at varying concentrations for 48 hours. The immunoblot is representative of four different fresh human kidney samples. E, Cell count performed 96 hours after treating fresh human kidney cells with DMSO (veh), sunitinib (5 μmol/L), or NCT-503 (NCT; 50 μmol/L), or a combination of both treatments. Five different experiments were conducted. F, Quantification of spheroid invasion areas after 7 days of invasion. Spheroids from ccRCC patient samples were treated with DMSO (veh), sunitinib (0.5 μmol/L), NCT-503 (30 μmol/L), or a combination of both treatments 24 hours before embedding in Matrigel (1 mg/mL). Two different experiments were conducted. ns, nonsignificant; *, P < 0.05; **, P < 0.01; ***, P < 0.001 (two-way ANOVA).
Figure 8.
Figure 8.
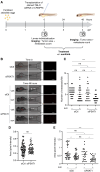
PSAT1 depletion suppresses local growth and distant metastases in a zebrafish model. A, Schematic of the in vivo experiment: 786-O cells treated with siRNA (siPSAT1 or nontargeting siCtl) were injected into the perivitelline space of zebrafish embryos at 48-hpf. dpf, days post-fertilization. Embryos were treated with or without sunitinib (2.5 μmol/L), and tumor area and metastasis were assessed at 0 and 48 hours after injection. B, Representative images of local and distant metastases in zebrafish embryos (N = 30) injected with siCtl- or siPSAT1-treated 786-O cells (labeled with red DiD) into the perivitelline space and treated with sunitinib (2.5 μmol/L). Analysis was conducted at 0 and 48 hours later. C, Quantification of distant metastases per zebrafish, based on fluorescence microscopy. Five different experiments were conducted. D and E, Quantification of tumor growth by measuring tumor area and red fluorescent protein (RFP) signal area. ns, nonsignificant; *, P < 0.05; ***, P < 0.001 (two-way ANOVA). Five different experiments were conducted. A, Created in BioRender. Giuliano, S. (2025) https://BioRender.com/e83m090.

References

    1. Maxwell PH, Wiesener MS, Chang GW, Clifford SC, Vaux EC, Cockman ME, et al. The tumour suppressor protein VHL targets hypoxia-inducible factors for oxygen-dependent proteolysis. Nature 1999;399:271–5. - PubMed
    1. Kaelin WG Jr. Molecular basis of the VHL hereditary cancer syndrome. Nat Rev Cancer 2002;2:673–82. - PubMed
    1. Brugarolas J. PBRM1 and BAP1 as novel targets for renal cell carcinoma. Cancer J 2013;19:324–32. - PMC - PubMed
    1. Chowdhury B, Porter EG, Stewart JC, Ferreira CR, Schipma MJ, Dykhuizen EC. PBRM1 regulates the expression of genes involved in metabolism and cell adhesion in renal clear cell carcinoma. PLoS One 2016;11:e0153718. - PMC - PubMed
    1. Tang Y, Jin Y-H, Li H-L, Xin H, Chen J-D, Li X-Y, et al. PBRM1 deficiency oncogenic addiction is associated with activated AKT-mTOR signalling and aerobic glycolysis in clear cell renal cell carcinoma cells. J Cell Mol Med 2022;26:3837–49. - PMC - PubMed

MeSH terms