. 2025 Mar 3;21(3):e1012836.
doi: 10.1371/journal.pcbi.1012836. eCollection 2025 Mar.

Post-processing and weighted combination of infectious disease nowcasts

Affiliations

Post-processing and weighted combination of infectious disease nowcasts

André Victor Ribeiro Amaral et al. PLoS Comput Biol. .

Abstract

In infectious disease surveillance, incidence data are frequently subject to reporting delays and retrospective corrections, making it hard to assess current trends in real time. A variety of probabilistic nowcasting methods have been suggested to correct for the resulting biases. Building upon a recent comparison of eight of these methods in an application to COVID-19 hospitalization data from Germany, the objective of this paper is twofold. Firstly, we investigate how nowcasts from different models can be improved using statistical post-processing methods as employed, e.g., in weather forecasting. Secondly, we assess the potential of weighted ensemble nowcasts, i.e., weighted combinations of different probabilistic nowcasts. These are a natural extension of unweighted nowcast ensembles, which have previously been found to outperform most individual models. Both in post-processing and ensemble building, specific challenges arise from the fact that data are constantly revised, hindering the use of standard approaches. We find that post-processing can improve the individual performance of almost all considered models both in terms of evaluation scores and forecast interval coverage. Improving upon the performance of unweighted ensemble nowcasts via weighting schemes, on the other hand, poses a substantial challenge. Across an array of approaches, we find modest improvement in scores for some and decreased performance for most, with overall more favorable results for simple methods. In terms of forecast interval coverage, however, our methods lead to rather consistent improvements over the unweighted ensembles.


Conflict of interest statement

The authors have declared that no competing interests exist.

Figures

Fig 1
Fig 1. Illustration of the nowcasting task and nowcasts from three different models (KIT, LMU, and a mean ensemble) on February 01, March 01, and April 01, 2022, respectively.
Black lines show data as available in real time on the respective forecast date, with the characteristic dip due to delays. The red line shows the data as completed later (40 days after the end of the displayed period). Point nowcasts and 50% and 95% uncertainty intervals are shown in colors.
Fig 2
Fig 2. National-level nowcasts 0 and 14 days back for the eight individual models, by target date.
The red line shows the nowcasting target, i.e., the number of COVID-19 7-day hospitalization cases after 40 days of retrospective corrections. The grey lines show the reported incidence counts at the time of nowcasting, i.e., after 0 (top) and 14 days (bottom), of retrospective corrections. Blue shaded areas represent nowcast intervals. This figure parallels Figs 5 and 6 from [10].
Fig 3
Fig 3. Model performance of original models and ensembles from [10].
Left: WIS (averaged over time points and horizons), split into components for underprediction, spread, and overprediction. A second axis at the top of the plot shows relative WIS with respect to a naïve baseline of no delay correction (see Sect 3.2). Middle: WIS by nowcast horizon (averaged over time points). Right: Empirical coverage proportions (averaged over time points and horizons). The results are reported for the national level (top row) and averaged across states (middle row) and age groups (bottom row).
Fig 4
Fig 4. Performance of post-processed (PP4) individual-model nowcasts compared to the original versions, national level.
Left: WIS (averaged over time points and horizons). Right: Coverage proportions (averaged over time points and horizons). In the left and right panel, circles ( ∘ ) represent the results for the original models before post-processing, i.e., as in Fig 3.
Fig 5
Fig 5. Illustration of post-processed nowcasts and their performance.
Left column: Same-day nowcasts for the post-processed LMU model (top) and nowcasts 14 days back for the post-processed SZ model (bottom). All nowcasts are at the national level and based on the post-processing scheme PP4. Middle column: Average WIS before and after post-processing, by nowcast horizon. Right column: WIS (averaged over horizons) before and after post-processing, per target date. The two dashed vertical lines represent December 30, 2021, i.e., the earliest target date, and February 8, 2022, i.e., the first nowcast date of the evaluation period. Scores before February 8 (greyed out) only partly enter into the reported average scores (with nowcasts referring to this period but issued on February 7 or before excluded).
Fig 6
Fig 6. Performance of unweighted and weighted ensemble approaches at the national level.
Left: WIS (averaged over time points and horizons). For reference, vertical lines indicate the performance of the best individual model with (dotted line) an without post-processing (solid line; in both cases RIVM). Middle: WIS (averaged over time points) by nowcast horizon. Right: Coverage proportions (averaged over time points and horizons).
Fig 7
Fig 7. Performance of unweighted and weighted ensemble approaches at the state and age-group levels (averaged across strata).
Left: WIS (averaged over time points and horizons). Middle: WIS (averaged over time points) by nowcast horizon. Right: Coverage proportions (averaged over time points and horizons). Note that due to extensive computing times, only a subset of approaches was applied to the stratified nowcasts (see Table 1).
Fig 8
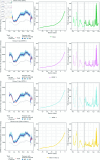
Fig 8. Illustration of same-day nowcasts for the Mean, DISW4, AISW4 and Select-4-Mean2 ensembles.
See caption of Fig 5 for details on plot elements and Table 1 for details on the methods specifications.
Fig 9
Fig 9. Estimated weights for the 0.025, 0.5, and 0.975 quantiles based on the direct inverse-score weighting method DISW2 (weights shared across horizons, simple imputation).
Weights are shown for the national level. As in Fig 5, results preceding the actual evaluation period are greyed out.
Fig 10
Fig 10. National-level weights for the 0 . 025, 0 . 5, and 0 . 975 quantiles based on the AISW 2 method (weights and scaling parameter shared across horizons, simple imputation).
Due to the introduced scaling parameter ϕα, the weights are not required to sum up to 1. The horizontal dashed line represents weight = 1.
Fig 11
Fig 11. WIS (averaged over time points and horizons) for n = 1 , … , 8 in the Select-n-Mean2 and Select-n-Median2 models.
Red circles show results for model selection updated each day, as would be done in a real-time setting. For context, black circles show average values for all possible combinations of models when keeping the selection fixed over time. The horizontal dashed line represents the average WIS achieved by the full ensemble with all eight member models.

References

    1. Codeco C, Coelho F, Cruz O, Oliveira S, Castro T, Bastos L. Infodengue: a nowcasting system for the surveillance of arboviruses in Brazil. Revue d’Épidémiologie et de Santé Publique. 2018;66:S386. doi: 10.1016/j.respe.2018.05.408 - DOI
    1. Bastos LS, Economou T, Gomes MFC, Villela DAM, Coelho FC, Cruz OG, et al.. A modelling approach for correcting reporting delays in disease surveillance data. Stat Med 2019;38(22):4363–77. doi: 10.1002/sim.8303 - DOI - PMC - PubMed
    1. Beesley LJ, Osthus D, Del Valle SY. Addressing delayed case reporting in infectious disease forecast modeling. PLoS Comput Biol 2022;18(6):e1010115. doi: 10.1371/journal.pcbi.1010115 - DOI - PMC - PubMed
    1. Cox DR, Medley GF. A process of events with notification delay and the forecasting of AIDS. Philos Trans R Soc Lond B Biol Sci 1989;325(1226):135–45. doi: 10.1098/rstb.1989.0078 - DOI - PubMed
    1. Höhle M, an der Heiden M. Bayesian nowcasting during the STEC O104:H4 outbreak in Germany, 2011. Biometrics 2014;70(4):993–1002. doi: 10.1111/biom.12194 - DOI - PubMed