. 2025 Mar 18;19(10):9760-9778.
doi: 10.1021/acsnano.4c07503. Epub 2025 Mar 3.

Host Immune Cell Membrane Deformability Governs the Uptake Route of Malaria-Derived Extracellular Vesicles

Affiliations

Host Immune Cell Membrane Deformability Governs the Uptake Route of Malaria-Derived Extracellular Vesicles

Daniel Alfandari et al. ACS Nano. .

Abstract

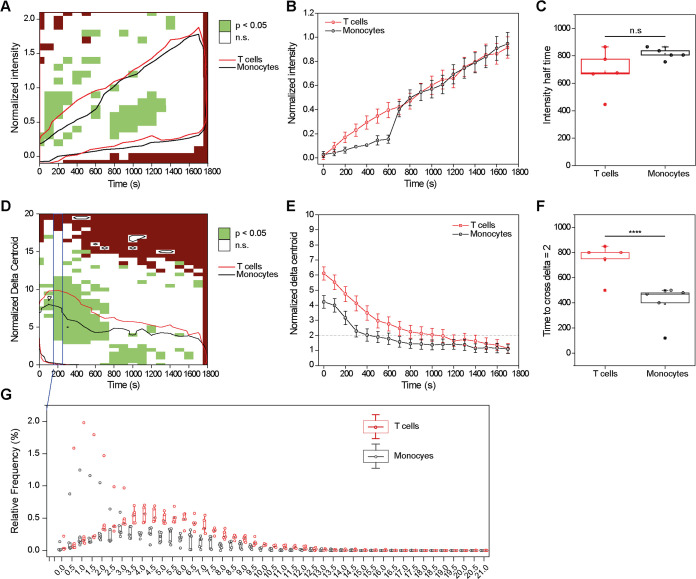
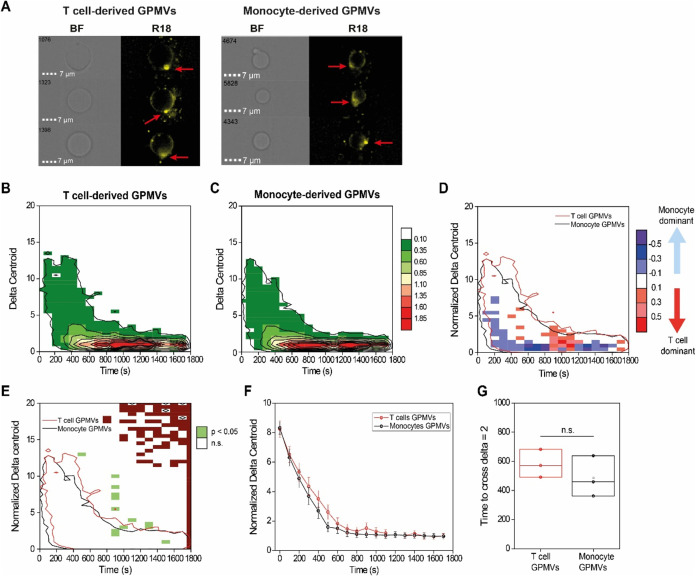
The malaria parasite, Plasmodium falciparum, secretes extracellular vesicles (EVs) to facilitate its growth and to communicate with the external microenvironment, primarily targeting the host's immune cells. How parasitic EVs enter specific immune cell types within the highly heterogeneous pool of immune cells remains largely unknown. Using a combination of imaging flow cytometry and advanced fluorescence analysis, we demonstrated that the route of uptake of parasite-derived EVs differs markedly between host T cells and monocytes. T cells, which are components of the adaptive immune system, internalize parasite-derived EVs mainly through an interaction with the plasma membrane, whereas monocytes, which function in the innate immune system, take up these EVs via endocytosis. The membranal/endocytic balance of EV internalization is driven mostly by the amount of endocytic incorporation. Integrating atomic force microscopy with fluorescence data analysis revealed that internalization depends on the biophysical properties of the cell membrane rather than solely on molecular interactions. In support of this, altering the cholesterol content in the cell membrane tilted the balance in favor of one uptake route over another. Our results provide mechanistic insights into how P. falciparum-derived EVs enter into diverse host cells. This study highlights the sophisticated cell-communication tactics used by the malaria parasite.

Keywords: EVs; cellular uptake; extracellular vesicles; imaging flow cytometry; malaria; membrane deformability.


Conflict of interest statement

The authors declare no competing financial interest.

Figures

Figure 1
Figure 1
Analysis of fluorescence signal from R18-labeled EVs reveals differences in uptake patterns into T cells and monocytes. (A) Graphical illustration of the experimental setup utilized to probe P. falciparum-derived EV uptake by cells. R18-labeled EVs were incubated with Hoechst-labeled cells within the flow chamber of the IFC instrument, and fluorescence images were continuously acquired throughout the 30 min incubation. (B) Representative IFC images acquired in the bright field (general shape and morphology of the cell), in the R18 channel (yellow), and in the Hoechst channel (purple) for the nuclear signal to select live cells. (C) Representative data distribution of the Δxy parameter obtained from an acquisition run. Data was then time-consumed and median normalized for easier comparison to other acquisitions. (D) Heat map obtained from 2D binning the distribution of normalized and truncated data, displaying relative frequencies of events in a specific time and Δxy coordinates. Representative images of the R18 channels for cells with polarized and uniform distributions (T cells and monocytes, respectively) are shown. (E) Filtered frequency distribution obtained after removing all values below statistical noise from the data plotted in panel D. (F) Kinetic profile obtained by using relative frequencies from panel E to calculate the weighted average for Δxynorm. Data are presented as weighted averages (dots) with weighted standard errors (whiskers). Illustrations created with BioRender.com and licensed for publication (agreement number: VK26WKI424).
Figure 2
Figure 2
Total intensities and intensity distributions of R18-labeled EVs are different between T cells and monocytes. (A) Representative IFC images of recipient T cells (left) and monocytes (right) showing the differences in the R18 signal distributions over time during incubation with R18-labeled P. falciparum-derived EVs. (B, C) Average heat maps of total R18 fluorescence intensity (i.e., amount of fluorescence measured in the whole cell) after incubation of R18-labeled P. falciparum-derived EVs with either (B) T cells or (C) monocytes. Heat map color represents the relative frequency (in percentage) at each specific normalized intensity - time coordinate, according to color legend in the figure. (D) Heat map of R18 total intensity events in T cells and monocytes over time. Blue areas indicate more events in monocytes compared with T cells, and red areas indicate the opposite. Outlines indicate the isofrequency region at a relative frequency of 0.1% for either T cells (red) or monocytes (black). Heat map color represents the difference in relative frequency (in percentage) between T cells and monocytes legend in the figure. (E, F) Average heat maps of cellular R18 Δxynorm, representative of uniformity of fluorescence signal along the membrane, after incubation of R18-labeled P. falciparum-derived EVs with either (E) T cells or (F) monocytes. Heat map color represents the relative frequency (in percentage) at each specific Δxy - time coordinate, according to color legend in the figure. (G) Heat map of R18 Δxynorm events in T cells and monocytes. Blue areas indicate more events in monocytes compared to T cells, and red areas indicate the opposite. Outlines indicate the isofrequency region at a relative frequency of 0.1% for either T cells (red) or monocytes (black). Heat map color represents the difference in relative frequency (in percentage) between T cells and monocytes at each specific Δxynorm - time coordinates, according to color legend in the figure. All panels were obtained from 5 independent biological repeats.
Figure 3
Figure 3
Fluorescence intensity distribution reveals differential uptake mechanisms in T cells versus monocytes. (A) Heat map of statistical significance of total R18 fluorescence intensity postincubation of R18-labeled EVs into T cells and monocytes obtained from IFC images. Statistical significance was calculated using a two-sample t-test when green indicates statistical significance (p < 0.05), white indicates no significance (n.s.), and brown indicates statistical test not applicable. Outlines indicate the isofrequency region at a relative frequency of 0.1% for T cells (red) and monocytes (black). (B) Representative kinetic profiles of total R18 fluorescence intensity in T cells (red) and monocytes (black). (C) Comparison of τ1/2 values for T cells and monocytes, showing no significant difference (n.s.). (D) Heat map of statistical significance in R18 fluorescence Δxynorm after internalization of R18-labeled EVs to T cells and monocytes obtained from IFC images. Statistical significance was calculated using a two-sample t-test when green indicates statistical significance (p < 0.05), white indicates no significance (n.s.), and brown indicates statistical test not applicable. Outlines indicate the isofrequency region at a relative frequency of 0.1% for T cells (red) and monocytes (black). (E) Representative kinetic profiles of total R18 fluorescence Δxy in T cells (red) and monocytes (black) throughout the time window. (F) Comparison of time to reach homogeneous fluorescence distribution (time to cross Δxy=2norm) for T cells and monocytes. (G) 2D distribution of the relative frequency of events binned across Δxy values (bin width of 0.5) and time (bin width of 100 min) for T cells (red) and monocytes (black).
Figure 4
Figure 4
Monocytes and T cells have distinct P. falciparum-derived EV uptake kinetics. (A, B) Representative images of spectral signatures of (A) monocytes and (B) T cells either untreated or treated for 30 min with TO-labeled P. falciparum-derived EVs. The areas within gray dashed lines show B1–B14 channels equivalent to the TO fluorescence signal range. (C, D) Representative pseudocolor (left) and histogram (right) plots for raw B3 peak channel intensities in TO-positive (C) monocytes and (D) T cells. (E, F) Representative post-unmixing histograms (with autofluorescence subtraction) illustrating time-dependent increases in fluorescence signal following 5-, 15-, or 30 min incubation with TO-labeled P. falciparum-derived EVs in (E) monocytes and (F) T cells. The adjacent histograms show treatment-induced changes (upper) versus autofluorescence levels (lower) across experimental groups. (G, H) Averaged percentages of TO+ cells for (G) 10 000 EVs per cell with statistical significance evaluated using ANOVA F(5, 16) = 22.7, p < 0.0001 and (H) 30 000 EVs per cell with statistical significance evaluated using ANOVA F(5, 16) = 7.1, p < 0.01, Šidak multiple comparison tests. **p < 0.01, ***p < 0.001 monocytes versus T cells within the same time points.
Figure 5
Figure 5
Depletion of cellular organelles removes differences in EV internalization dynamics between T cells and monocytes. (A) Representative images of T cell-derived (left) and monocyte-derived (right) GPMVs following incubation with R18-labeled EVs. Images are shown in the bright field (BF) and the R18 fluorescence channel. (B) Heat map of the average R18 Δxy relative frequency after incubation of R18-labeled EVs with T cell-derived GPMVs. (C) Heat map of average R18 Δxy relative frequency after incubation of R18-labeled EVs with monocyte-derived GPMVs. (D) Heat map of R18 Δxynorm events in T cells and monocytes. Blue areas indicate more events in monocytes compared to T cells, and the red areas indicate the opposite. Outlines indicate the isofrequency region at a relative frequency of 0.1% for T cells (red) and monocytes (black). (E) Heat map of statistical significance in R18 fluorescence Δxynorm after internalization of R18-labeled EVs in GPMVs derived from T cells and monocytes. Significance was determined by using a two-sample t-test with green indicating statistical significance (p < 0.05), white indicating no significance (n.s.), and brown indicating statistical test not applicable. (F) Representative total R18 fluorescence Δxy profiles for GPMVs derived from T cells (red) and monocytes (black). (G) Comparison of time to reach homogeneous fluorescence distribution (time to cross Δxynorm = 2) for GPMVs derived from T cells and monocytes. The data presented are based on 3 biological repeats. Each kinetic profile is presented as a weighted average (dot) and weighted standard error (whiskers). Heat map color in panels B and C represents the relative frequency (in percentage) at each specific Δxy - time coordinate, according to color legend in the figure. Heat map color in panel D represents the difference in relative frequency (in percentage) between T cells and monocytes at each specific Δxynorm - time coordinates, according to color legend in the figure.
Figure 6
Figure 6
T cell membranes are more rigid than monocyte membranes. (A) Measurement of Young’s Modulus by AFM on intact GMPVs obtained from either T cells (dark blue) or monocytes (light blue). Data are presented as relative frequencies obtained from 4 replicates for each cell type and calculated with a bin width of 500 Pa. Statistical significance was calculated using one-way ANOVA; *p < 0.05. (B, C) Representative images of supported lipid bilayers from (B) T cells and (C) monocytes. Scale bars: 2 μm. (D) Representative force–separation curves measured on the supported lipid bilayer of T cell- and monocyte-derived GPMV populations. (E) Puncture force box plots for the T cell- and monocyte-derived GPMV populations. The box represents the first quartile (Q1) and the third quartile (Q3) of the data, with a line at the median. The whiskers extend from the box to the farthest data point lying within 1.5 × the interquartile range (IQR) from the box (Q1–1.5 × IQR, and Q3 + 1.5 × IQR). Outliers are represented by diamonds. The data presented was measured at an approach speed of 1 μm/s (n = 316 events for T cells and n = 308 events for monocytes). All data sets measured at different speeds and 2 different biological repetitions showed a similar significant trend.
Figure 7
Figure 7
Removal of cholesterol shifts the uptake route of T cells from the membrane to the endocytic pathway. (A) Representative IFC images of untreated T cells, T cells treated with 1.5 mM mβCD, and T cells treated with 2.5 mM mβCD during the first 600 s after the addition of R18-labeled EVs. (B) Heat maps of average cellular R18 Δxynorm relative frequency after incubation of R18-labeled EVs with untreated T cells (left), cells treated with 1.5 mM mβCD (center), and cells treated with 2.5 mM mβCD (right). Heat map color represents the relative frequency (in percentage) at each specific Δxy - time coordinate, according to color legend in the figure. (C) Heat map of differences in Δxynorm events between untreated T cells and cells treated with 1.5 mM mβCD. (D) Heat map of differences in Δxynorm events between untreated T cells and cells treated with 2.5 mM mβCD. (E) Representative kinetic profile of Δxynorm for untreated T cells (red), T cells treated with 1.5 mM mβCD (blue), and T cells treated with 2.5 mM mβCD (green), showing a progressive loss of the polarized region at early time points. (F) Comparison of time to reach homogeneous fluorescence distribution (time to cross Δxynorm = 2) for untreated T cells (red), T cells treated with 1.5 mM mβCD (blue), and 2.5 mM mβCD (green), normalized to untreated T cells. All heat maps and bar graphs presented are based on 3 biological repeats. For heat maps of differences (panels C and D), blue areas indicate more events in the mβCD-treated cells compared to untreated T cells, and red areas indicate the opposite. Outlines indicate the isofrequency region at a relative frequency of 0.1% for either nontreated T cells (red), T cells treated with 1.5 mM mβCD (blue), and 2.5 mM mβCD (green). Each kinetic profile is presented as a weighted average (dot) and weighted standard error (whiskers). Heat map color in panels C and D represents the difference in relative frequency (in percentage) between untreated T cells and mβCD-treated T cells at each specific Δxynorm - time coordinates, according to color legend in the figure.
Figure 8
Figure 8
Proposed model for EV uptake into monocytes and T cells. EVs primarily enter monocytes through the endocytic pathway, whereas in T cells, uptake is mediated through specific regions of direct membrane contact or fusion.

References

    1. World Malaria Report 2023. https://www.who.int/teams/global-malaria-programme/reports/world-malaria.... (accessed April 18, 2024).
    1. Ofir-Birin Y.; Heidenreich M.; Regev-Rudzki N. Pathogen-Derived Extracellular Vesicles Coordinate Social Behaviour and Host Manipulation. Semin. Cell Dev. Biol. 2017, 67, 83–90. 10.1016/j.semcdb.2017.03.004. - DOI - PubMed
    1. Mashburn L. M.; Whiteley M. Membrane Vesicles Traffic Signals and Facilitate Group Activities in a Prokaryote. Nature 2005, 437 (7057), 422–425. 10.1038/nature03925. - DOI - PubMed
    1. van der Pol E.; Böing A. N.; Harrison P.; Sturk A.; Nieuwland R. Classification, Functions, and Clinical Relevance of Extracellular Vesicles. Pharmacol. Rev. 2012, 64 (3), 676–705. 10.1124/pr.112.005983. - DOI - PubMed
    1. Sisquella X.; Ofir-Birin Y.; Pimentel M. A.; Cheng L.; Abou Karam P.; Sampaio N. G.; Penington J. S.; Connolly D.; Giladi T.; Scicluna B. J.; Sharples R. A.; Waltmann A.; Avni D.; Schwartz E.; Schofield L.; Porat Z.; Hansen D. S.; Papenfuss A. T.; Eriksson E. M.; Gerlic M.; Hill A. F.; Bowie A. G.; Regev-Rudzki N. Malaria Parasite DNA-Harbouring Vesicles Activate Cytosolic Immune Sensors. Nat. Commun. 2017, 8 (1), 1985.10.1038/s41467-017-02083-1. - DOI - PMC - PubMed

Publication types

MeSH terms

LinkOut - more resources