. 2025 Mar 3;13(1):32.
doi: 10.1038/s41413-025-00410-7.

Beclin 1 of megakaryocytic lineage cells is locally dispensable for platelet hemostasis but functions distally in bone homeostasis

Affiliations

Beclin 1 of megakaryocytic lineage cells is locally dispensable for platelet hemostasis but functions distally in bone homeostasis

Lei Li et al. Bone Res. .

Abstract

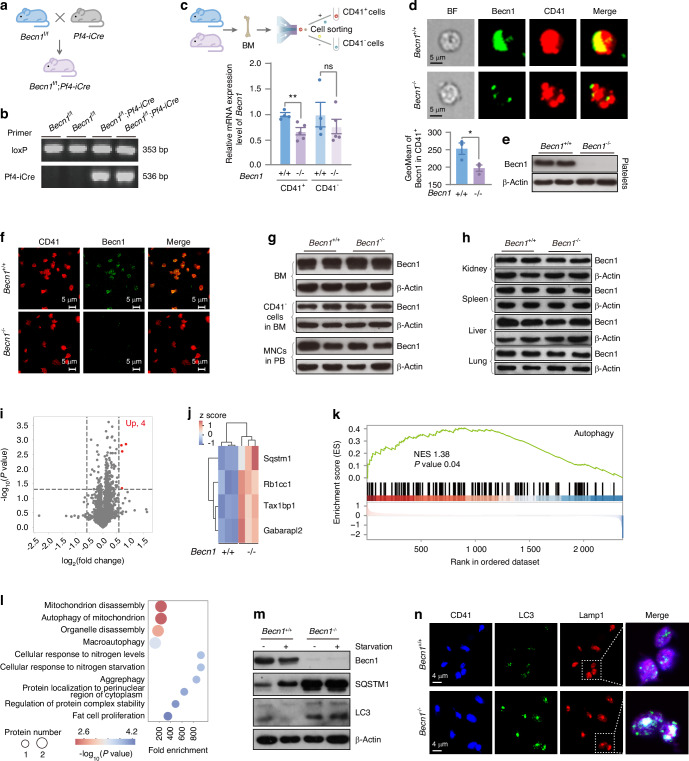
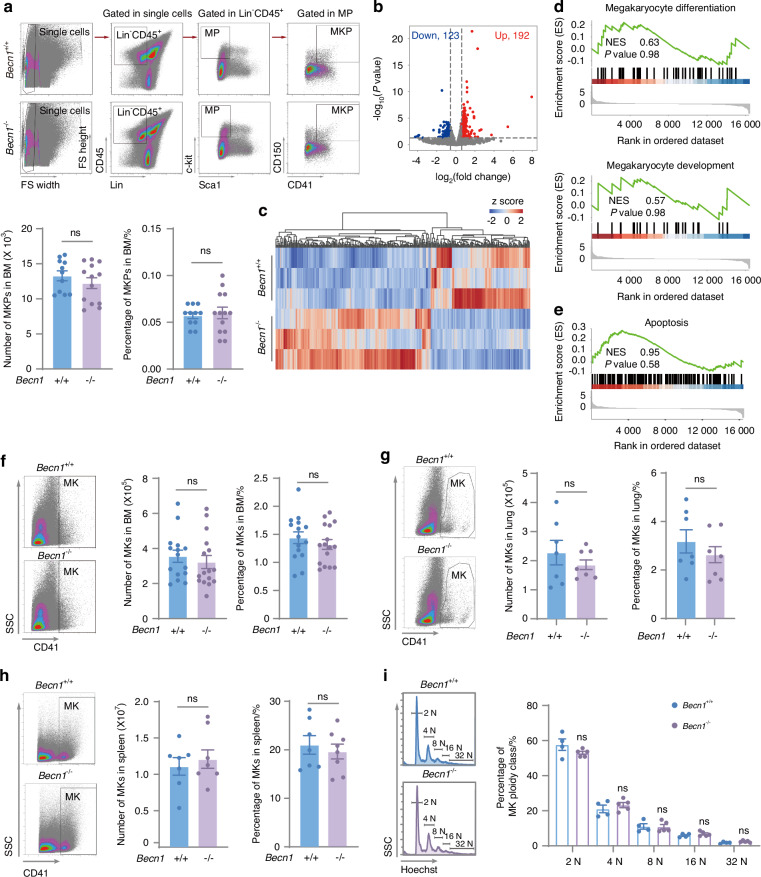
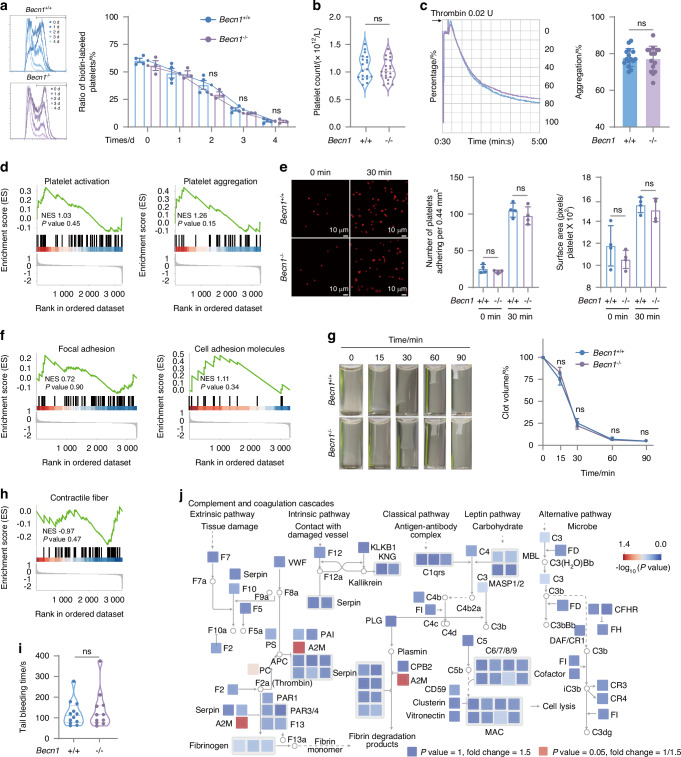
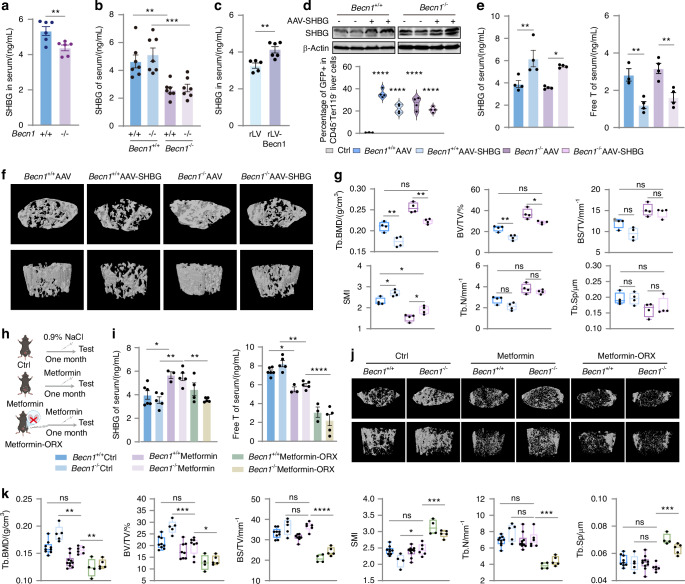
The crosstalk between megakaryocytic lineage cells and the skeletal system has just begun to be explored but remains largely elusive. Using conditional gene knockout mouse models, we demonstrated that loss of Beclin 1 (Becn1), a major regulator of mammalian autophagy, exclusively in the megakaryocytic lineage disrupted autophagy in platelets but did not compromise megakaryopoiesis or the formation and function of platelets. Unexpectedly, conditional Becn1 deletion in male mice led to a remarkable increase in bone mass with improved bone quality, in association with a decrease in sex hormone binding globulin (SHBG) and an increase in free testosterone (FT). In vivo Becn1 overexpression in megakaryocytic lineage-specific cells reduced bone mass and quality, along with an increase in SHBG and a decrease in FT. Transplantation of wild-type bone marrow cells into megakaryocytic lineage Becn1-deficient male mice restored bone mass and normalized SHBG and FT. Furthermore, bilateral orchiectomy of Becn1f/f;Pf4-iCre mice, which are crippled with the production of testosterone, resulted in a reduction in bone mass and quality, whereas in vivo overexpression of SHBG, specifically in the liver of Becn1f/f;Pf4-iCre mice, decreased FT and reduced bone mass and quality. In addition, metformin treatment, which induces SHBG expression, reduced FT and normalized bone mass in Becn1f/f;Pf4-iCre mice. We thus concluded that Becn1 of the megakaryocytic lineage is dispensable locally for platelet hemostasis but limits bone mass by increasing SHBG, which in turn reduces the FT of male mice. Our findings highlight a mechanism by which Becn1 from megakaryocytic lineage cells distally balances bone growth.


Conflict of interest statement

Competing interests: The authors declare no competing interests.

Figures

Fig. 1
Fig. 1
Generation of megakaryocytic lineage-specific Becn1 knockout Becn1f/f;Pf4-iCre mice. ac Generation of Becn1f/f;Pf4-iCre mice, identified by electrophoresis of tail DNA and analysis of Becn1 mRNA expression levels by RT‒qPCR in CD41+ cells and CD41 cells from the BM. Gapdh was used as a reference gene. d Analysis of Becn1 expression (green) in MKs from Becn1f/f and Becn1f/f;Pf4-iCre mice by imaging flow cytometry. MKs were identified by CD41 staining. The upper panel shows a representative flow image, and the lower panel shows the results of the flow image analysis. e Analysis of the Becn1 protein expression level in platelets by western blotting. β-Actin was used as a loading control. f Analysis of Becn1 expression (green) in platelets from Becn1f/f and Becn1f/f;Pf4-iCre mice by confocal microscopy. Platelets were labeled with CD41 (red). g, h Western blot analysis of Becn1 expression in whole BM cells, CD41cells from the BM, and MNCs from the peripheral blood, kidney, spleen, liver, and lung. i Volcano plot of the platelet proteome. Differentially expressed proteins (DEPs) were determined under the conditions of |log2(fold change)| ≥ log2(1.5) and P < 0.05. j Heatmap of DEPs. k Gene set enrichment analysis (GSEA) of proteins involved in autophagy. The signaling pathway was adapted from the Gene Ontology (GO) pathway (GO:0006914). l GO enrichment analysis of DEPs in platelets. The ten most significant biological process (BP) terms. m Western blot analysis of autophagy-related proteins in platelets with or without starvation. n Colocalization analysis of LC3 and Lamp1 in platelets using confocal microscopy. Data are means ± SEMs. *P < 0.05; **P < 0.01
Fig. 2
Fig. 2
Pf4-iCre-mediated Becn1 deletion does not impair megakaryopoiesis. a Number and percentage of MK progenitors (MKPs) in the bone marrow of Becn1f/f and Becn1f/f;Pf4-iCre mice. Upper panel: Flow cytometric analysis of MKPs (LinCD45+Sca1c-kit+CD150+CD41+). Lower panel: Statistical analysis of the number and percentage of MKPs in the bone marrow. MP cells: LinCD45+Sca1c-kit+. b Volcano plot of MKs depicting the transcriptome of MKs. Differentially expressed genes (DEGs) were determined under the conditions of a |log2(fold change)| ≥ log2(1.5) and a P < 0.05. A total of 192 genes were upregulated, and 123 genes were downregulated. c Heatmap representing DEGs in the MK transcriptome. d GSEA of megakaryocyte differentiation (upper panel, GO:0030219) and megakaryocyte development (lower panel, GO:0035855). e GSEA of apoptosis (KEGG pathway, mmu04210). f Number and percentage of MKs in the bone marrow. Left panel: Flow cytometric analysis of MKs (CD41+) in the bone marrow. Right panel: Statistical analysis of the number and percentage of MKs in Becn1f/f and Becn1f/f;Pf4-iCre mice. g Number and percentage of MKs in the lung. Left panel: Flow cytometric analysis of MKs in the lung. Right panel: Statistical analysis of the number and percentage of MKs in the lung. h Number and percentage of MKs in the spleen. Left panel: Flow cytometric analysis of MKs in the spleen. Right panel: Statistical analysis of the number and percentage of MKs in Becn1f/f and Becn1f/f;Pf4-iCre mouse spleens. i Ploidy distribution of MKs in Becn1f/f and Becn1f/f;Pf4-iCre mice. MK ploidy was measured by a double-staining technique (CD41 and Hoechst) and flow cytometry. Left panel: Histograms of DNA content (Hoechst) in MKs (CD41+). Right panel: Statistical analysis of MK ploidy levels. Data are means ± SEMs
Fig. 3
Fig. 3
Pf4-iCre-mediated Becn1 deletion does not impair the lifespan or function of platelets. a Flow cytometric analysis of the percentage of biotin-labeled platelets in Becn1f/f and Becn1f/f;Pf4-iCre mice after the injection of NHS-biotin. b Platelet counts in Becn1 f/f and Becn1f/f;Pf4-iCre mice. c Platelet aggregation levels in response to 0.02 U thrombin. Left panel: representative aggregation tracing of platelets using platelet aggregometry; right panel: statistical analysis of aggregation. d GSEA of platelet activation (GO:0030168) and aggregation (GO:0070527) terms. e Platelets spread on immobilized fibrinogen after treatment with 0.02 U of thrombin. Adherent cells were stained with phalloidin. Adhesion (number of platelets per 0.44 mm2) and spreading (mean platelet area) were visualized and evaluated via confocal microscopy and imaging. f GSEA of adhesion. Left panel: Focal adhesion (mmu04510). Right panel: Cell adhesion molecules (mmu04514). g Clot retraction of mouse platelets at different time points after treatment with 0.02 U thrombin. h GSEA of contractile fibers (GO:0043292). i Tail bleeding time of Becn1f/f and Becn1f/f;Pf4-iCre mice. j The proteome changes observed in Becn1f/f and Becn1f/f;Pf4-iCre mice were mapped to the KEGG pathway mmu04610, which formed a signaling network. The size of each node in the network was scaled to represent the magnitude of protein expression change in Becn1f/f and Becn1f/f;Pf4-iCre mice. Furthermore, the color bar indicates the -log10(P value), which reflects the statistical significance of the differences between the two groups. Data are means ± SEMs
Fig. 4
Fig. 4
Mx1-Cre-mediated Becn1 deletion impairs megakaryopoiesis and platelet function. a Platelet counts in the peripheral blood of Becn1f/f and Becn1f/f;Mx1-Cre mice. b Number and percentage of MKPs in the bone marrow of Becn1f/f and Becn1f/f;Mx1-Cre mice. Flow cytometric analysis of MKPs (left) and number and percentage of MKPs in the bone marrow (right). c Number and percentage of MKs in the BM. Flow cytometric analysis of MKs in the BM (left) and number and percentage of MKs in Becn1f/f and Becn1f/f;Mx1-Cre mice (right). d Flow cytometric analysis of MKs in the lung (Left) and number and percentage of MKs in the lung (right). e Flow cytometric analysis of MKs in the spleen (left) and number and percentage of MKs in the spleens of Becn1f/f and Becn1f/f;Mx1-Cre mice (right). f Ploidy distribution of MKs in Becn1f/f and Becn1f/f;Mx1-Cre mice. Histograms of DNA content (Hoechst) in MKs (left) and percentage of MK ploidy class (right). g Platelet aggregation levels in response to 0.02 U thrombin. Representative aggregation tracing of mouse platelets using platelet aggregometry (left) and statistical analysis of the aggregation data (right). h Spread of 0.02 U of thrombin-treated platelets on immobilized fibrinogen. Adherent cells were stained with phalloidin. The adhesion (number of platelets per 0.44 mm2) and spreading (mean platelet area) of the platelets were visualized by confocal microscopy and evaluated by ImageJ. i Tail bleeding time of Becn1f/f and Becn1f/f;Mx1-Cre mice. Data are means ± SEMs. *P < 0.05; **P < 0.01; ***P < 0.001; ****P < 0.000 1
Fig. 5
Fig. 5
Becn1 of the megakaryocytic lineage cells negatively regulates bone mass in males. a, b Micro-CT analysis of Becn1f/f and Becn1f/f;Pf4-iCre mice. c Representative calcein double-labeling images with quantification of the mineral apposition rate (MAR). d Representative image and statistical analysis of HE staining of the femur. e Three-point mechanical testing of bone strength and stiffness. f Diagram of the whole bone marrow transplantation mouse model. g HE staining of the femurs of transplant recipient mice (Becn1+/+Becn1+/+, n = 2; Becn1+/+Becn1–/–, n = 4; Becn1–/–Becn1+/+, n = 2; Becn1–/–Becn1–/–, n = 3). h, i Micro-CT analysis of the transplanted mice. j Analysis of the Becn1 protein expression level in platelets by western blotting. β-Actin was used as a loading control. Left, representative western blot; right, statistical graph showing the relative expression levels of Becn1. k Percentages of GFP-positive platelets in rLV and rLV-Becn1 mice. l Statistical analysis of the percentages of GFP-positive MKPs, MKs, and platelets in rLV and rLV-Becn1 mice. m, n Micro-CT analysis of rLV and rLV-Becn1 mice. (rLV: Mice with megakaryocytic lineage-specific overexpression of the vector; rLV-Becn1: Mice with megakaryocytic lineage-specific overexpression of Becn1. Data are means ± SEMs. *P < 0.05; **P < 0.01; ***P < 0.001; ****P < 0.000 1
Fig. 6
Fig. 6
Becn1 of megakaryocytic lineage cells negatively regulates free testosterone levels, thereby inhibiting osteogenic activity but increasing osteoclastogenesis in males. a TB staining of mouse femurs (Becn1f/f, n = 3; Becn1f/f;Pf4-iCre, n = 3). b TRAP staining of mouse femurs (Becn1f/f, n = 3; Becn1f/f;Pf4-iCre, n = 3). c ELISA analysis of the serum levels of sex hormones. d ELISA analysis of free testosterone levels in the serum of rLV and rLV-Becn1 mice. e ELISA analysis of free testosterone levels in the serum of transplant recipient mice. f TB staining of the femurs of transplant recipient mice (Becn1+/+−Becn1+/+, n = 2; Becn1+/+Becn1−/−, n = 4; Becn1−/−Becn1+/+, n = 2; Becn1−/−Becn1−/−, n = 3). g TRAP staining of the femurs of transplant recipient mice (Becn1+/+Becn1+/+, n = 2; Becn1+/+Becn1−/−, n = 4; Becn1−/−Becn1+/+, n = 2; Becn1−/−Becn1−/−, n = 3). h Schematic illustration of the bilateral orchiectomy (ORX) model. i ELISA analysis of serum testosterone levels in ORX mice. j, k Micro-CT analysis of ORX mice. Data are means ± SEMs. *P < 0.05; **P < 0.01; ***P < 0.001; ****P < 0.000 1
Fig. 7
Fig. 7
Becn1 of megakaryocytic linease cells increases SHBG levels, leading to decreased release of FT and reduced bone mass in males. a ELISA analysis of the serum levels of SHBG. b ELISA analysis of SHBG levels in the serum of transplant recipient male mice. c ELISA analysis of SHBG levels in the serum of rLV and rLV-Becn1 mice. d Western blot analysis of SHBG expression in liver tissue, with β-actin as a loading control. Upper panel, representative western blot; lower panel, statistical analysis of the percentage of GFP-positive cells in the CD45Ter119 liver population of the AAV and AAV-SHBG mice. e ELISA analysis of SHBG and FT levels in the serum of AAV and AAV-SHBG mice. f, g Micro-CT results for the AAV and AAV-SHBG mice. h Intervention diagram depicting metformin gavage treatment in Ctrl and ORX mice. i ELISA analysis of SHBG and FT levels in the serum of metformin-treated and ORX mice. j, k Micro-CT results of metformin-treated and ORX mice. Data are means ± SEMs. *P < 0.05; **P < 0.01; ***P < 0.001; ****P < 0.000 1
Fig. 8
Fig. 8
A cartoon illustrating the role of Becn1 of MK lineage cells in distally balancing bone mass. Becn1 from MK lineage cells from male mice increases the level of SHBG, thus reducing the amount of FT in the blood and ultimately limiting bone mass by inhibiting osteogenesis and enhancing osteoclastogenesis

References

    1. Junt, T. et al. Dynamic visualization of thrombopoiesis within bone marrow. Science317, 1767–1770 (2007). - PubMed
    1. Howell, W. H. & Donahue, D. D. The production of blood platelets in the lungs. J. Exp. Med.65, 177–203 (1937). - PMC - PubMed
    1. Kaufman, R. M., Airo, R., Pollack, S. & Crosby, W. H. Circulating megakaryocytes and platelet release in the lung. Blood26, 720–731 (1965). - PubMed
    1. Lefrancais, E. et al. The lung is a site of platelet biogenesis and a reservoir for haematopoietic progenitors. Nature544, 105–109 (2017). - PMC - PubMed
    1. Patel, S. R., Hartwig, J. H. & Italiano, J. E. Jr. The biogenesis of platelets from megakaryocyte proplatelets. J. Clin. Investig.115, 3348–3354 (2005). - PMC - PubMed

LinkOut - more resources