. 2025 Mar 3;15(1):7497.
doi: 10.1038/s41598-025-90513-2.

Knocking down the neuronal lactate transporter MCT2 in the arcuate nucleus of female rats increases food intake and body weight

Affiliations

Knocking down the neuronal lactate transporter MCT2 in the arcuate nucleus of female rats increases food intake and body weight

Alanis Coca et al. Sci Rep. .

Abstract

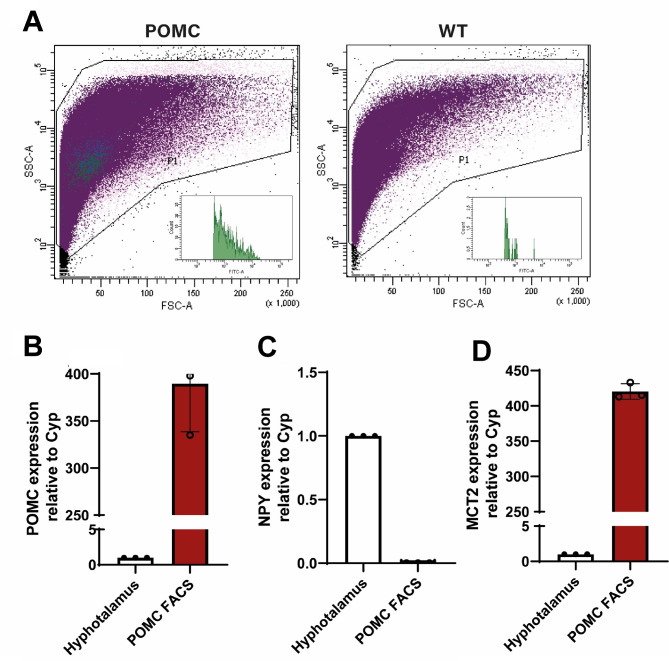
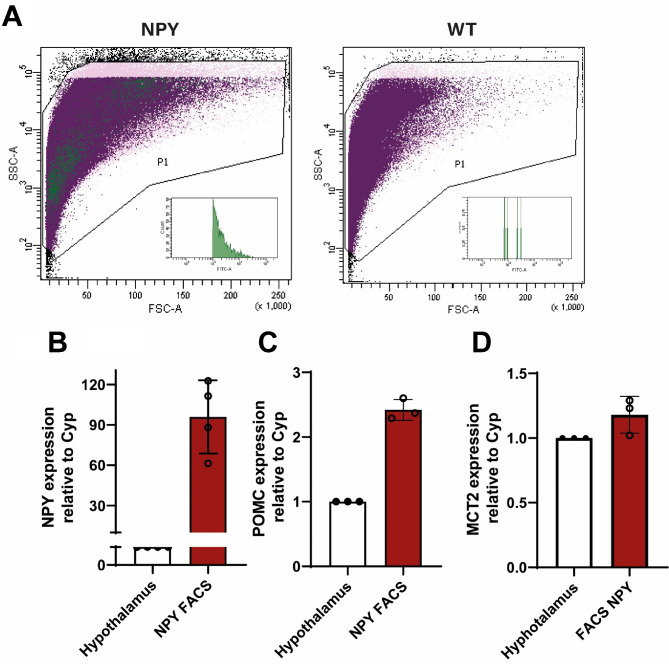
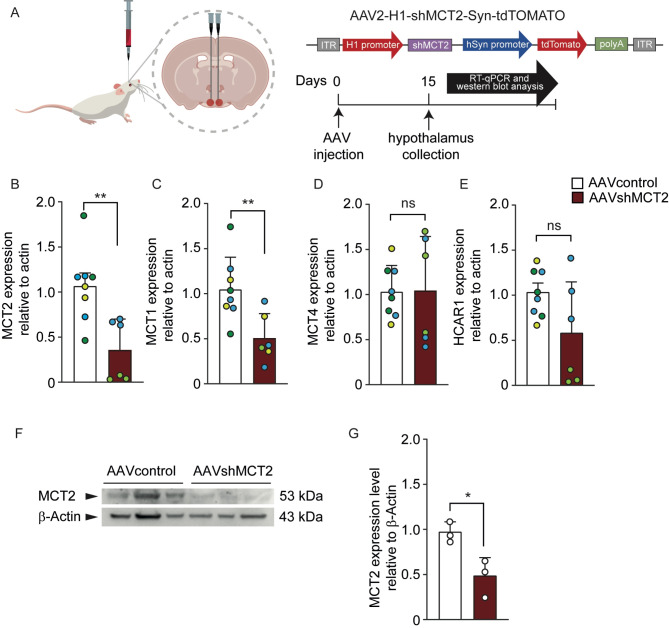
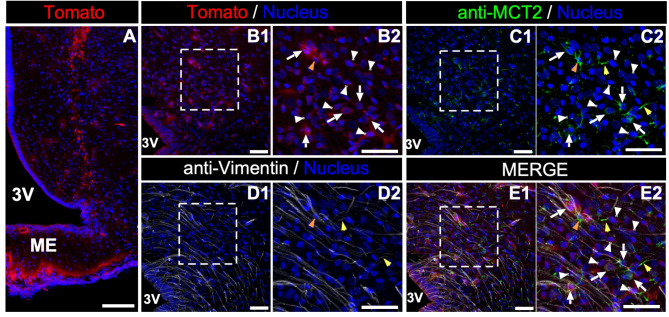
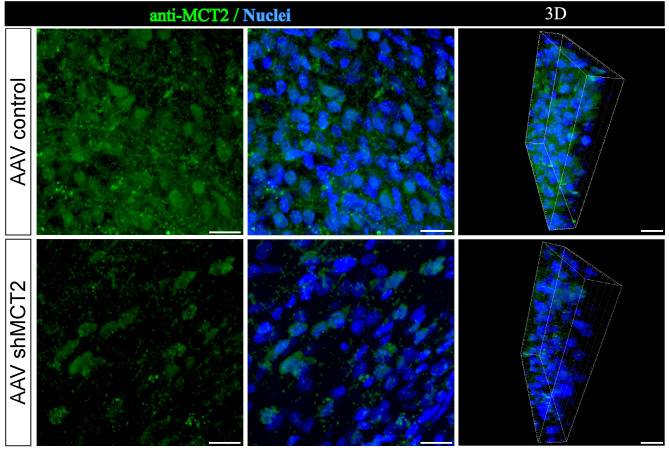
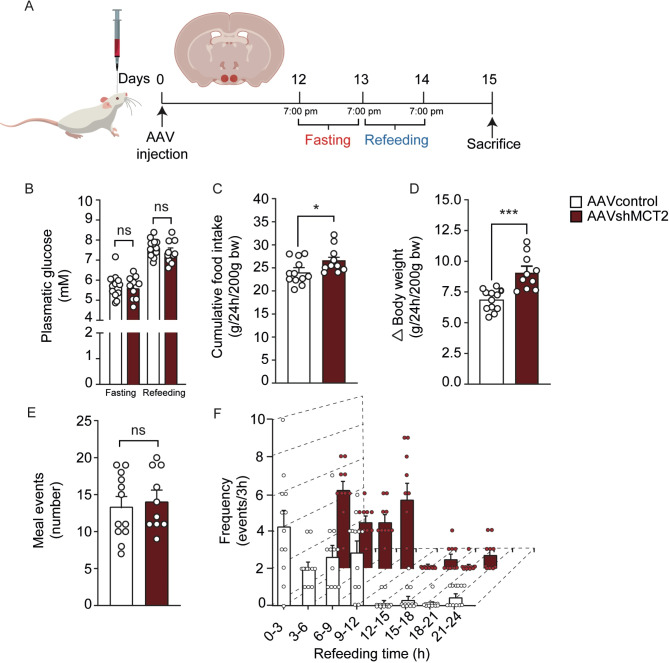
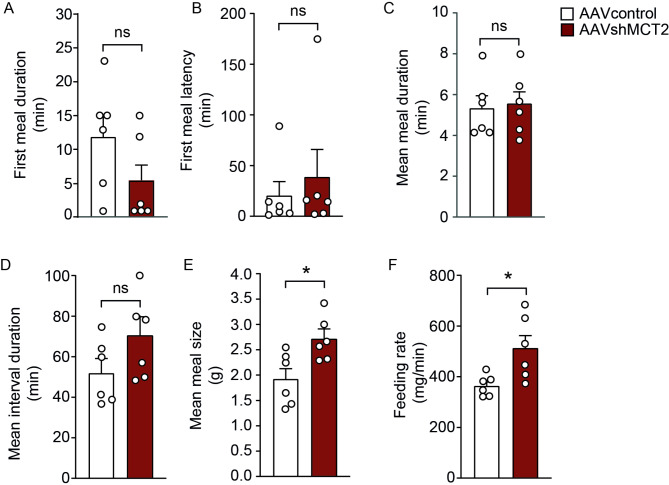
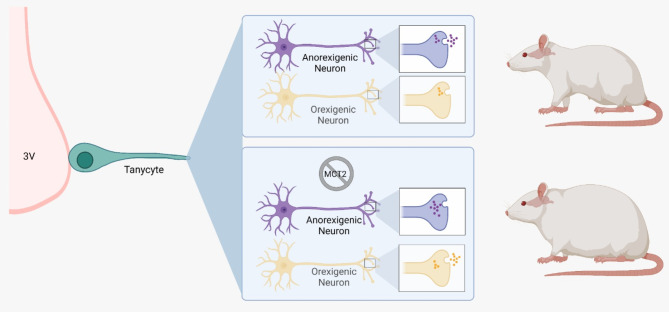
In the arcuate nucleus of the hypothalamus, tanycyte-neuron interactions regulate glucose homeostasis and feeding behavior. Previously, we reported that monocarboxylate transporters (MCT) 1 and 4 are localized in tanycytes, whereas MCT2 is present in arcuate nucleus neurons, including orexigenic and anorexigenic neurons (POMC). MCT1 and MCT4 inhibition impacts feeding behavior, suggesting that monocarboxylate transfer between tanycytes and neurons influences food intake. Electrophysiological studies have shown that POMC neurons respond to lactate through transport and indirect signaling using astrocytic hydroxycarboxylic acid receptor 1. To investigate the role of MCT2 further, we generated MCT2 knockdown rats and analyzed their feeding behavior. Female Sprague-Dawley rats received bilateral injections in the arcuate nucleus with an adeno-associated virus (AAV) carrying a specific short hairpin RNA to inhibit MCT2 expression, thereby generating neuronal MCT2 knockdown rats. Knockdown efficiency in rat hypothalamic tissue was assessed using real-time PCR, Western Blot, and immunohistochemistry. The acute effect on feeding behavior was evaluated following 24 h of fasting, followed by 24 h of refeeding. In MCT2-knockdown rats, we observed additional inhibition of MCT1, suggesting a potential glial response to increased parenchymal lactate levels. Both macrostructure and microstructure of feeding were evaluated in MCT2-knockdown rats and compared to control AAV-injected rats. MCT2 knockdown led to a significant increase in macrostructural parameters, such as food intake and body weight. These findings underscore the importance of lactate transfer as a mechanism in tanycyte-neuron communication mediated by monocarboxylates.

Keywords: Arcuate nucleus; Feeding behavior; MCT2; Rats; Satiation.


Conflict of interest statement

Declarations. Competing interests: The authors declare no competing interests.

Figures

Fig. 1
Fig. 1
MCT2 expression in the arcuate nucleus (ARC) and its association with POMC neurons. (A) Flow cytometry (FACS) plots showing forward scatter (FSC-A) versus side scatter (SSC-A) to illustrate the sorting of POMC-GFP neurons from transgenic and wild-type (WT) mice. Insets display the distribution of FITC intensity for gated events, confirming the enrichment of GFP-positive POMC neurons. (B) Quantitative RT-PCR analysis of gene expression for POMC, (C) NPY, and (D) MCT2 in whole hypothalamic tissue and FACS-purified POMC neurons. Data indicate higher expression of POMC and MCT2 in sorted POMC neurons compared to whole hypothalamic samples, while NPY expression remains negligible in POMC-purified cells.
Fig. 2
Fig. 2
Expression of MCT2 in NPY neurons of the arcuate nucleus (ARC). (A) Flow cytometry (FACS) plots showing forward scatter (FSC-A) versus side scatter (SSC-A) to illustrate the sorting of NPY-GFP neurons from transgenic and wild-type (WT) mice. Insets display the distribution of FITC intensity for gated events, confirming the enrichment of GFP-positive NPY neurons. (B) Quantitative RT-PCR analysis showing the expression levels of NPY, (C) POMC, and (D) MCT2 in whole hypothalamic tissue and FACS-purified NPY neurons. Results indicate a significant enrichment of NPY and MCT2 expression in sorted NPY neurons compared to hypothalamic samples, while POMC expression is minimal in NPY-purified cells.
Fig. 3
Fig. 3
Robust inhibition of MCT2 expression in female rats transduced with AAVshMCT2 compared to control AAV. (A) Schematic of the experimental protocol showing the AAV constructs used: AAV-SYN-TdTOMATO as the control and AAV-shMCT2-SYN-TdTOMATO for MCT2 knockdown. Injection coordinates were as follows: anterior-posterior (AP): −3.14 mm, dorsal-ventral (DV): −9.8 mm, and left-right (LR): ± 0.30 mm. (B-E) Quantitative RT-PCR (qRT-PCR) analysis of MCT2, MCT1, MCT4, and HCAR1 mRNA levels in the hypothalami of rats transduced with control AAV (open bars) or AAVshMCT2 (closed bars) 2 weeks post-injection. Each experimental group processed in a different experiment was assigned a unique color, and three experiments were performed. (F) Western blot analysis showing MCT2 protein levels with actin as the loading control. (G) Semi-quantitative densitometric analysis of MCT2 protein levels normalized to actin, using three animals per condition. Data are presented as mean ± SEM. *p < 0.05; **p < 0.01 (unpaired t-test).
Fig. 4
Fig. 4
AAVshMCT2 effectively targets the ARC and reduces MCT2 expression. (A-B2) Confocal microscopy analysis showing the localization of the tdTOMATO reporter (red) to confirm transduction of cells in the ARC. (C1-C2) Immunolocalization of MCT2 (green) to assess expression levels. (D1-D2) Immunolocalization of vimentin (white) to visualize tanycyte processes. (E1) Merged images illustrating the spatial relationship between tdTOMATO-expressing cells, MCT2, and tanycyte processes. (E2) High-magnification view of E1 highlighting the close association between tanycyte processes and MCT2-expressing neurons. White arrowheads indicate neurons transduced with tdTOMATO that lack MCT2 immunoreactivity. White arrows indicate neurons transduced with tdTOMATO that exhibit MCT2 immunoreactivity. Yellow arrowheads point to possible endothelial cells that are also vimentin-positive. The orange arrow indicates an astrocyte-like cell that is vimentin-negative but MCT2-positive. ME: median eminence; 3 V: third ventricle.
Fig. 5
Fig. 5
AAVshMCT2 reduces MCT2 immunoreactivity in the ARC. Immunohistochemistry analysis of MCT2 (green) with DAPI (blue) as a nuclear marker in rats transduced with (A-C) control AAV and (D-F) AAVshMCT2. (C and F) 3-D views reconstructed from 15 confocal z-planes spanning a total of 10 μm, demonstrating the reduction of MCT2 signal in AAVshMCT2-injected rats compared to control. The 3D projection was generated using Zen Software Version 8.0, which includes image acquisition, processing, and a module for 3D visualization and analysis. The images were obtained using a ZEISS LSM780 confocal laser scanning microscope (Carl Zeiss Microscopy GmbH, Germany). More information about the software can be found at: https://www.micro-shop.zeiss.com/es/uy/softwarefinder/software-categories/zenblack/.
Fig. 6
Fig. 6
Knockdown of MCT2 increases food intake and body weight in female rats. (A) Experimental protocol depicting bilateral AAV injections (control or AAVshMCT2) into the ARC of adult female rats. After 12 days, rats underwent 24 h of fasting followed by 24 h of refeeding. Glycemia, food intake, and body weight were measured after fasting and at the end of the refeeding period. (B) Glycemia measured in rats transduced with AAV control (open bars) or AAVshMCT2 (closed bars) after fasting and refeeding. (C) Food intake over 24 h post-refeeding, expressed as g/200 g body weight. (D) Percentage change in body weight 24 h post-refeeding. (E) Cumulative meal frequency during the 24-h refeeding period. (F) Meal frequency assessed every 3 h during the refeeding period. Data are presented as mean ± SEM. *p < 0.05; **p < 0.01; ***p < 0.001 (unpaired t-test).
Fig. 7
Fig. 7
Microstructure of ingestion in female rats with MCT2 knockdown. Quantification of the following feeding microstructure parameters: (A) first meal duration (min), (B) latency to first meal (min), (C) average meal duration (min), (D) average interval duration between meals (min), (E) meal size (g), and (F) feeding rate (mg/min). Analysis of the feeding rate, calculated as the total food consumed divided by the total meal duration, indicated that female rats with MCT2 knockdown exhibited an increased eating rate, correlating with a significant increase in overall food intake.
Fig. 8
Fig. 8
Schematic representation summarizing the results of this manuscript. Our results suggest that the potential exchange of lactate between tanycytes and neurons in the arcuate nucleus may serve as a source of metabolic energy as well as a signaling mechanism. A reduction in MCT2 expression correlates with increased food intake and significant weight gain in rats. Impaired lactate uptake in POMC and NPY neurons could affect POMC activation and reduce NPY inhibition, suggesting that lactate plays a role in regulating feeding behavior and energy balance, with potential implications for the treatment of metabolic disorders.

References

    1. Karin Pierre, P. J. M. & Luc Pellerin MCT2 is a Major Neuronal Monocarboxylate Transporter in the Adult Mouse Brain22p. 586–595 (SAGE journals, 2002). 5. - PubMed
    1. Millan, C. et al. Glial glucokinase expression in adult and post-natal development of the hypothalamic region. ASN Neuro. 2 (3), e00035 (2010). - PMC - PubMed
    1. Joost, H. G. & Thorens, B. The extended GLUT-family of sugar/polyol transport facilitators: nomenclature, sequence characteristics, and potential function of its novel members (review). Mol. Membr. Biol.18 (4), 247–256 (2001). - PubMed
    1. Bolborea, M. et al. Hypothalamic tanycytes generate acute hyperphagia through activation of the arcuate neuronal network. Proc. Natl. Acad. Sci.117 (25), 14473–14481 (2020). - PMC - PubMed
    1. Garcia-Robles, M. A. et al. Hypothalamic ependymal-glial cells express the glucose transporter GLUT2, a protein involved in glucose sensing. J. Neurochem. 86 (3), 709–724 (2003). - PubMed