. 2025 Mar 3;9(1):58.
doi: 10.1038/s41698-025-00848-2.

Complement activation in tumor microenvironment after neoadjuvant therapy and its impact on pancreatic cancer outcomes

Affiliations

Complement activation in tumor microenvironment after neoadjuvant therapy and its impact on pancreatic cancer outcomes

Xiaofei Zhang et al. NPJ Precis Oncol. .

Abstract

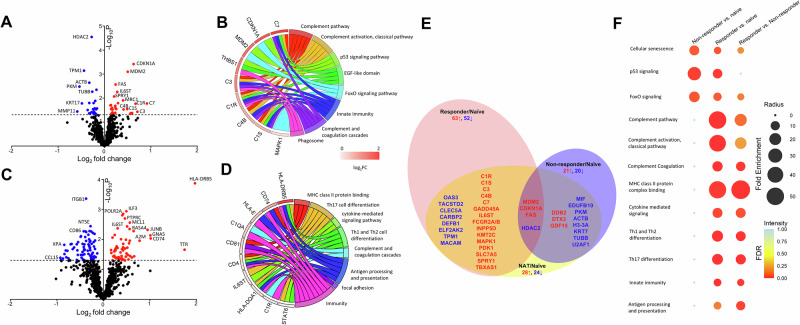
Neoadjuvant therapy (NAT) is increasingly being used for pancreatic ductal adenocarcinoma (PDAC). This study investigates how NAT differentially impacts PDAC's carcinoma cells and the tumor microenvironment (TME). Spatial transcriptomics was used to compare gene expression profiles in carcinoma cells and the TME of 23 NAT-treated versus 13 NAT-naïve PDACs. Findings were validated by single-nucleus RNA sequencing (snRNA-seq) analysis. NAT induces apoptosis and inhibits proliferation of carcinoma cells and coordinately upregulates multiple complement genes (C1R, C1S, C3, C4B and C7) within the TME. Higher TME complement expression following NAT is associated with increased immunomodulatory and neurotrophic cancer-associated fibroblasts (CAFs); more CD4+ T cells; reduced immune exhaustion gene expression, and improved overall survival. snRNA-seq analysis demonstrates C3 complement is mainly upregulated in CAFs. These findings suggest that local complement dynamics could serve as a novel biomarker for prognosis, evaluating treatment response, and guiding therapeutic strategies in NAT-treated PDAC patients.


Conflict of interest statement

Competing interests: The authors declare no competing interests.

Figures

Fig. 1
Fig. 1. Spatial transcriptomics reveals intra- and intertumoral heterogeneity of neoadjuvant therapy (NAT) response in pancreatic ductal adenocarcinoma (PDAC) cancer cells and the tumor microenvironment (TME).
A Clinical and pathologic characteristics of the 36 patients in our study cohort. For patients 14–17, both the pre-NAT biopsies (included in the naïve group) and the corresponding post-NAT resection specimen (included in the NAT group) were analyzed. For all other patients, only the respected primary PDAC specimens were used. B Immunofluorescence segmentation of each ROI into carcinoma AOI and TME AOI (pan-CK in green, α-SMA in yellow, DAPI in blue). Total mRNA libraries were prepared separately from each of these two AOIs for every ROI. C Heatmap of gene expression profiles in all 223 carcinoma and TME AOIs. Unsupervised clustering reveals a distinct separation between carcinoma AOIs and TME AOIs, with limited overlap in the middle. There is no discernible separation between the naïve group and the NAT group within either the carcinoma AOI cluster or the TME AOI cluster. Similarly, among the NAT-treated patients, there was no discernible separation between the responders and non-responders. D UMAP plot demonstrating near-complete separation of carcinoma AOIs and TME AOIs. A total of 95.1% (137/144) of the TME AOIs cluster above the dashed line, while 94.5% (103/109) of the carcinoma AOIs cluster below the dashed line. Approximately 5% of the AOIs overlap at the tails of these two clusters. There is no noticeable separation between the NAT group and the naïve group within either cluster. Similarly, within the NAT group, there is no noticeable separation between responders (dark brown) and non-responders (light brown) in either the carcinoma AOI cluster or the TME AOI cluster. E. UMAP plot of the four pairs of pre-NAT biopsy and corresponding post-NAT resection from patients 14–17 (∆=naïve carcinoma; ▲=NAT-treated carcinoma. ○=naïve TME; ●=NAT-treated TME. Datapoints from the same patient are shown in the same color). For both carcinoma AOIs and TME AOIs, datapoints from NAT group are separated from those from the naïve group. The dotted lines connect each datapoint to its nearest neighbor. Most of the datapoints are closer to datapoints from the same patient than to those of different patients, suggesting datapoints from the same patient tend to cluster together.
Fig. 2
Fig. 2. Impact of NAT on carcinoma cells in PDAC.
A Volcano-plot showing differentially expressed genes (DEGs) in carcinoma cells induced by NAT. B Chord diagram illustrating the relationship between individual DEGs and the enriched pathways induced by NAT in carcinoma cells. C Impact of NAT on malignant cell lineage programs (top) and malignant cell states (bottom). NAT significantly upregulated the acinar program and downregulated the Cycling_G2/M state. TNF-NFκB signaling showed a decrease with marginal statistical significance. D Histologic evaluation showing that the NAT-treated carcinoma cells (bottom) exhibit significantly increased apoptosis (solid arrowhead), decreased mitosis (open arrowhead), and cytoplasmic vacuolization compared to naïve carcinoma cells (top), consistent with transcriptomics findings. E Volcano-plot showing DEGs in the carcinoma AOIs when comparing responders to the non-responders in the NAT group. F Chord diagram illustrating the relationship between individual DEGs and the enriched pathways when comparing responders versus non-responders. G Differences in malignant cell lineage programs (top) and malignant cell states (bottom) between responders versus non-responders in the NAT group. The squamoid lineage program and adhesive malignant state were significantly upregulated, whereas the cycling_G2/M state was significantly downregulated. H H&E images of a carcinoma AOI in a non-responder (top, patient#33, Cycling-G2/M score = 20.2, squamoid signature score = 25.7, adhesive state score = 19.5) versus a carcinoma AOI in a responder (lower, patient #25, Cycling-G2/M Score=14.2 squamoid signature Score=45.8, adhesive state Score=34.0). Overall, the carcinoma AOIs in the non-responder show more discohesive and less squamoid morphology with more mitoses, consistent with the transcriptomics findings. (#p < 0.1; *p < 0.05; **p < 0.01).
Fig. 3
Fig. 3. Impact of NAT on PDAC TME.
A Volcano plot displaying differentially expressed genes (DEGs) in the TME of PDAC induced by NAT. B Chord diagram illustrating the relationship between individual DEGs and the enriched pathways. The five NAT-upregulated complement genes are broadly associated with immunomodulation pathways. C Volcano plot displaying DEGs in the TME when comparing responders versus non-responders of the NAT group. D Chord diagram illustrating the relationship between individual DEGs and the enriched pathways when comparing responders versus non-responders of the NAT group. E Venn diagram showing the overlap of upregulated (red font) and downregulated (blue font) genes in TME AOIs when comparing the entire NAT group (yellow), the responder subgroup (red), and the non-responder subgroup (blue) against the naïve group. Notably, the five complement genes were upregulated only in the responder subgroup. F Dot plot showing the most significantly enriched pathways in comparisons between responders vs. the naïve group (left), non-responders vs. the naïve group (middle), and responders vs. the non-responders (right).
Fig. 4
Fig. 4. Impact of NAT on CAFs and immune cells in the TME of PDAC.
A Quantitative analysis of signature scores for all major types of immune cell in the tumor immune microenvironment (TIME) in the naïve and NAT groups. No statistically significant changes were observed, except for a marginal increase in mast cell numbers. B NAT significantly increased immunomodulatory CAFs and the neurotrophic CAFs, with no significant changes observed in other CAF subtypes. C Complement C3 expression levels within TME are significantly correlated with the signature score of immunomodulatory CAFs (R = 0.65, p = 1.8e-5). D snRNA-seq analysis demonstrating a significant increase in the number of complement C3 expressing CAFs following NAT. The percentages of C3 expressing CAFs in each subtype and corresponding p-values are indicated in the upper right corner. (#p < 0.1; *p < 0.05; **p < 0.01).
Fig. 5
Fig. 5. NAT-induced upregulation of complement expression in TME is associated with immunomodulation and reduced immune exhaustion.
A Heatmap displaying the expression levels of the five key complement genes (C1R, C1S, C3, C4B, C7) that are upregulated by NAT in the TME of the NAT group. Unsupervised clustering segregates patients in NAT-group into high and low TME complement groups. B Box plot showing that the high TME complement subgroup has significantly increased numbers of mast cells, CD4 + T cells and monocytes compared to the low TME complement subgroup. C The high TME complement group exhibits significantly increased immunomodulatory CAFs compared to the low TME complement group. Additionally, the high TME complement subgroup shows significantly decreased immune exhaustion signature score and no significant change in immune cytotoxicity signature score. D Bar plot illustrating the expression levels of 5 complements (C1R, C1S, C3, C4B, C7) in the TME AOIs across the naïve group, the responder subgroup, and non-responder subgroup. E Box plot demonstrating that compared to the non-responder subgroup, the responder subgroup has significantly increased numbers of CD4 + T cells, monocytes and macrophages; and significantly decreased number of regulatory T (Treg) cells. F Responders show a significant increase in immunomodulatory CAFs compared to non-responders. Additionally, responders exhibit significantly decreased immune exhaustion signature scores and no significant change in immune cytotoxicity signature scores when compared to non-responders. (ns, not significant; *p < 0.05; **p < 0.01; ***p < 0.001).
Fig. 6
Fig. 6. The prognostic relevance of NAT-induced upregulation of TME complement.
A Forest plot of multivariate Cox proportional hazards analysis showing high TME complement level is an independent favorable prognostic factor for NAT-treated patients (HR = 0.21; 95% CI: 0.06-0.51; p = 0.023). Positive surgical resection margin (R1) is an independent poor prognostic factor for NAT-treated patients (HR = 5.46; 95% CI: 1.28-23.27, p = 0.022). B Kaplan-Meier survival curves comparing overall survival rates among the high TME complement subgroup (red line), the low TME complement subgroup (blue line) and the naïve group (green line). The high TME complement subgroup exhibits significantly improved overall survival compared to the low TME complement subgroup and marginally improved overall survival compared to the naïve group. No statistically significant difference was observed between the low TME complement subgroup and the naïve group. C Kaplan-Meier survival curves comparing the overall survival among the responder group (dark brown), the non-responder group (light brown) and the naïve group (black). The responders showed significantly improved overall survival compared to the non-responders. No statistically significant difference was observed in overall survival between the responders and the naïve group. D Schematic representation summarizing how NAT differentially remodels carcinoma cells and the TME of PDAC. While NAT increases apoptosis and decreases the proliferation and G2/M phase cycling in carcinoma cells, it has broad immunomodulatory effects on the TME through upregulating local complement expression and signaling. (ns, not significant; #p < 0.1; *p < 0.05; **p < 0.01; ***p < 0.001).

Update of

References

    1. Siegel, R. L., Miller, K. D., Fuchs, H. E. & Jemal, A. Cancer statistics, 2022. CA Cancer J. Clin.72, 7–33 (2022). - PubMed
    1. Rahib, L., Wehner, M. R., Matrisian, L. M. & Nead, K. T. Estimated projection of US cancer incidence and death to 2040. JAMA Netw. Open4, e214708 (2021). - PMC - PubMed
    1. Vincent, A., Herman, J., Schulick, R., Hruban, R. H. & Goggins, M. Pancreatic cancer. Lancet378, 607–620 (2011). - PMC - PubMed
    1. Ferrone, C. R. et al. Pancreatic adenocarcinoma: the actual 5-year survivors. J. Gastrointest. Surg.12, 701–706 (2008). - PubMed
    1. Hu, Z. I. & O’Reilly, E. M. Therapeutic developments in pancreatic cancer. Nat. Rev. Gastroenterol. Hepatol.21, 7–24 (2024). - PubMed

LinkOut - more resources