. 2025 Mar;7(3):531-555.
doi: 10.1038/s42255-025-01225-w. Epub 2025 Mar 3.

Regulation of mammalian cellular metabolism by endogenous cyanide production

Affiliations

Regulation of mammalian cellular metabolism by endogenous cyanide production

Karim Zuhra et al. Nat Metab. 2025 Mar.

Abstract

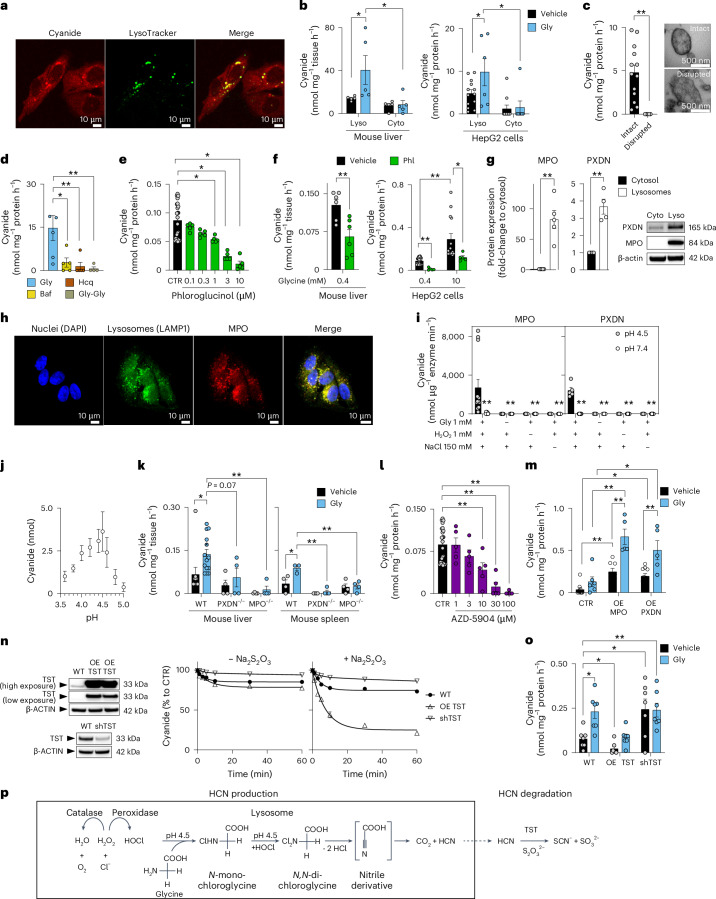
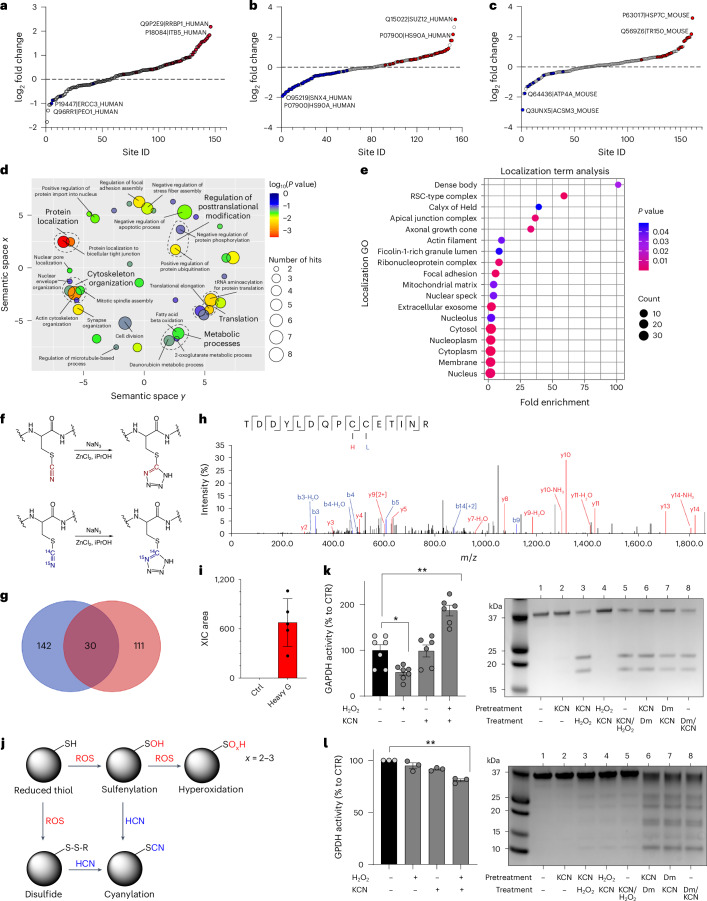
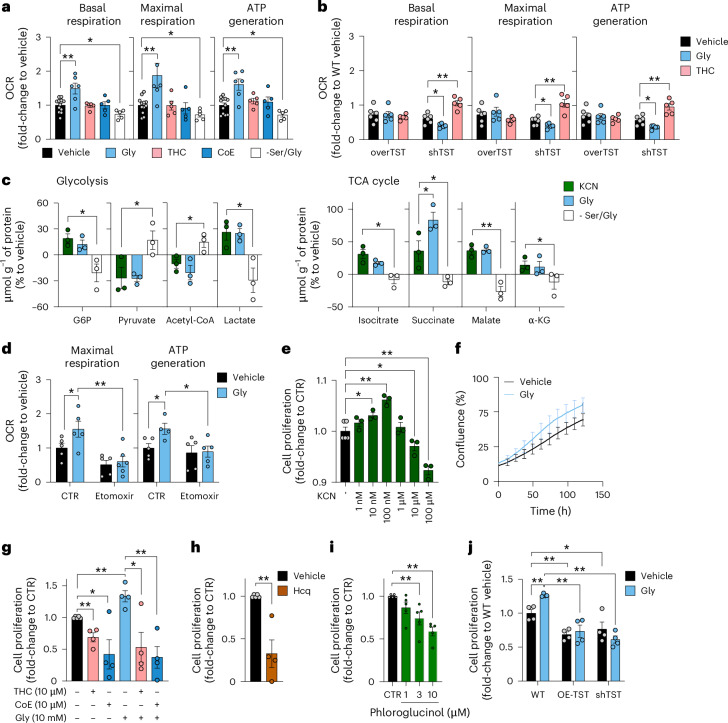
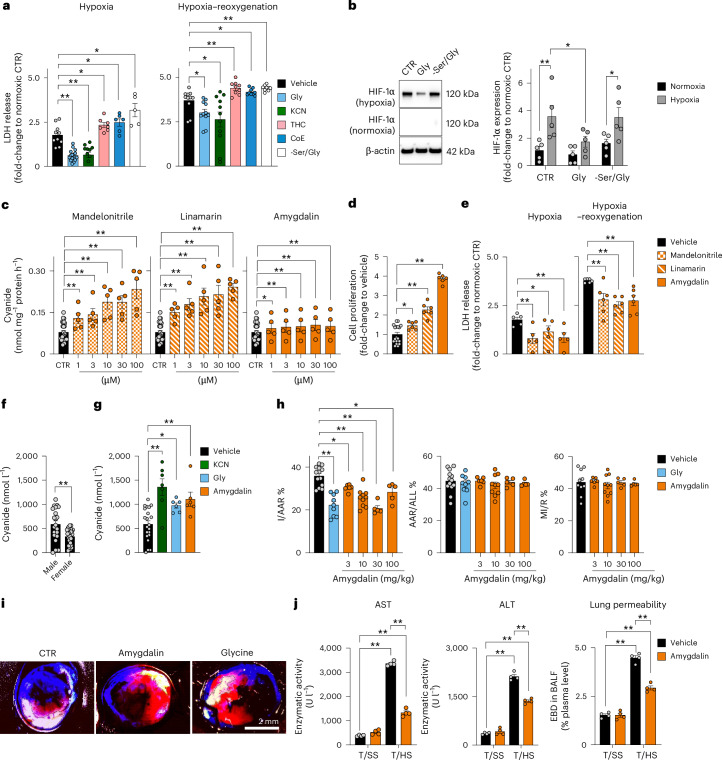
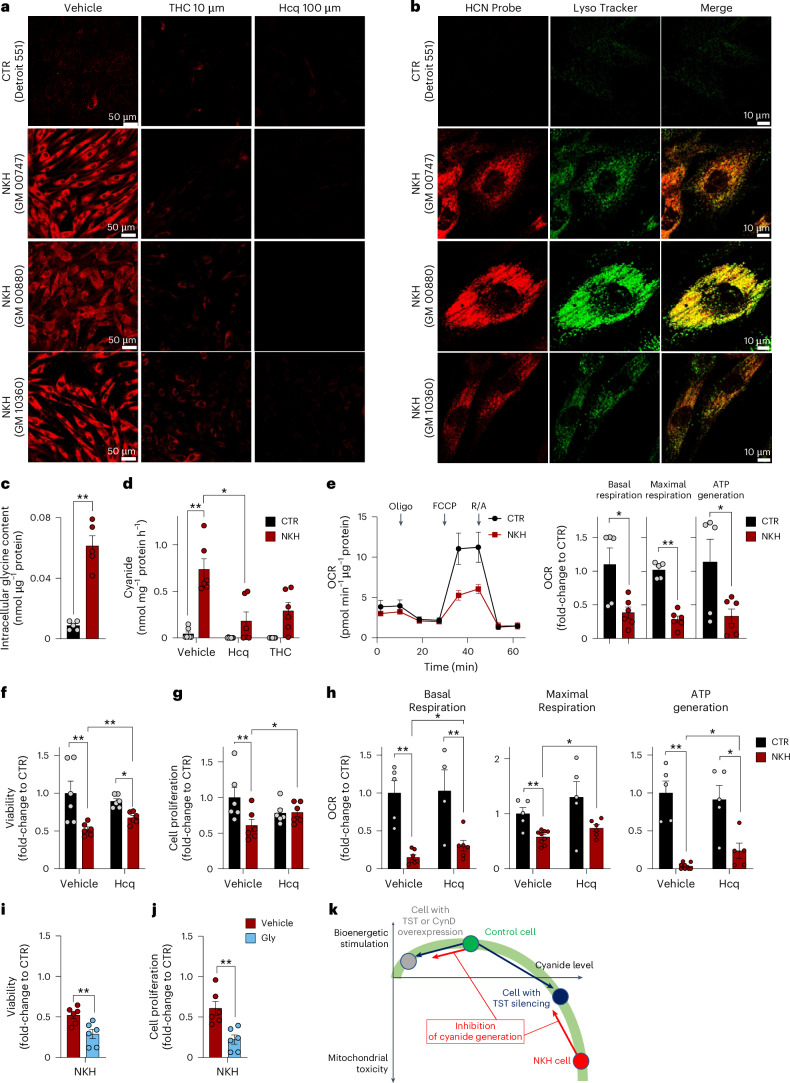
Small, gaseous molecules such as nitric oxide, carbon monoxide and hydrogen sulfide are produced as signalling molecules in mammalian cells. Here, we show that low concentrations of cyanide are generated endogenously in various mammalian tissues and cells. We detect cyanide in several cellular compartments of human cells and in various tissues and the blood of mice. Cyanide production is stimulated by glycine, occurs at the low pH of lysosomes and requires peroxidase activity. When generated at a specific rate, cyanide exerts stimulatory effects on mitochondrial bioenergetics, cell metabolism and cell proliferation, but impairs cellular bioenergetics at high concentrations. Cyanide can modify cysteine residues via protein S-cyanylation, which is detectable basally in cells and mice, and increases in response to glycine. Low-dose cyanide supplementation exhibits cytoprotective effects in hypoxia and reoxygenation models in vitro and in vivo. Conversely, pathologically elevated cyanide production in nonketotic hyperglycinaemia is detrimental to cells. Our findings indicate that cyanide should be considered part of the same group of endogenous mammalian regulatory gasotransmitters as nitric oxide, carbon monoxide and hydrogen sulfide.


Conflict of interest statement

Competing interests: The authors declare no competing interests.

Figures

Fig. 1
Fig. 1. Cyanide is endogenously produced in mouse tissues and human cells.
ad, Cyanide production rates from tissue homogenates in homogenization medium containing 0.4 mM glycine (vehicle) or in medium supplemented with 10 mM glycine (Gly) were determined by the electrochemical (ECh) method after alkalinization. a, Comparison of cyanide generation from various tissues (at least n = 6 per group, biological replicates). b, Comparison of cyanide generation from male-versus-female mice (n = 6 per group, biological replicates). c, Detection of cyanide generation from liver homogenates using the Cyanalyzer LC–MS/MS method (n = 5 per group, biological replicates). d, Detection of cyanide generation from liver homogenates obtained from male mice using the spectrophotometric method (n = 5 per group, biological replicates). e, Treatment with HCN scavengers THC or CoE (10 µM), lowered the cyanide generation (ECh method) from mouse liver homogenates (n = 6 per group, biological replicates). f, Heat inactivation of proteins (HI), physical inactivation of proteins by multiple cycles of freezing and thawing (F&T) or SDS-induced protein denaturation (SDS) lowered the cyanide signal (ECh method) from mouse liver homogenates, compared to the control (CTR; at least n = 5 per group, biological replicates). g,h, Intracellular visualization (g) and quantification (h) of cyanide by confocal microscopy. Quantification of cyanide-specific signal using corrected total cell fluorescence (CTCF) values using two different cyanide-sensitive fluoroprobes Chemosensor P (CP) and a spiropyrane derivative of cyanobiphenyl (CSP) in human primary hepatocytes (n = 4 per group, biological replicates) and a human hepatoma line (HepG2; n = 6 per group or n = 5 per group, biological replicates, using CP or CSP probes, respectively) treated with a vehicle, 10 mM glycine (Gly) or 10 µM THC. Created with BioRender.com. i, Cyanide production in primary mouse and human hepatocytes and HepG2 cells treated with vehicle in standard medium containing 0.4 mM glycine (vehicle), addition of 10 mM glycine (Gly) or addition of 10 µM THC in control medium (ECh method; n = 4 per group biological replicates for primary human hepatocytes, n = 6 per group biological replicates for HepG2 cells). j, Effect of THC or CoE (10 µM) on the cyanide signal in HepG2 cells (ECh method; at least n = 6 per group, biological replicates). k, Cyanide production in a panel of mammalian cell lines in normal medium containing 0.4 mM glycine (vehicle), in medium supplemented with 10 mM glycine (Gly) or in −Ser/Gly medium for 24 h (ECh method; at least n = 5 per group, biological replicates). l, Cyanide production from human PBMCs and human neutrophils under basal conditions and after incubation with 10 mM glycine (Gly) for 4 h (ECh method; n = 6 per group, biological replicates). m, Cyanide production in HepG2 cells grown for 24 h in normal medium (containing 0.4 mM glycine) in the absence or presence of 100 µM SHMT inhibitor or in −Ser/Gly medium supplemented with 0.4–10 mM glycine (ECh method; at least n = 7 per group, biological replicates). n, Glycine levels in HepG2 cells under baseline conditions, after pharmacological inhibition of SHMT (iSHMT), after addition of 10 mM glycine to the culture medium or in −Ser/Gly medium for 24 h (ECh method; at least n = 5 per group, biological replicates). Data in af and hn are expressed as the mean ± s.e.m. Data in a, b, e, f and hn were analysed with a two-way analysis of variance (ANOVA) followed by Bonferroni’s multiple-comparisons test. Data in c, d and l were analysed with a two-sided Student’s t-test. *P < 0.05 and **P < 0.01 indicate significant differences. Source data
Fig. 2
Fig. 2. Cyanide is enzymatically generated by lysosomal peroxidases.
a, The cyanide signal in HepG2 cells partially colocalizes with lysosomes (confocal microscopy using Chemosensor P). Images shown are representative of n = 3 biological replicates per group. b,c, Cyanide generation in lysosomal and cytosolic fractions (Lyso and Cyto, respectively) obtained from mouse liver or HepG2 cells ± 10 mM glycine (Gly; ECh method; at least n = 5 per group, biological replicates; b) or from isolated intact versus disrupted lysosomes (ECh method; at least n = 5 per group, biological replicates; c) as visually confirmed by electron microscopy. d, Cyanide generation in isolated lysosomes after treatment with 1 µM bafilomycin (Baf), 30 µM hydroxychloroquine (Hcq) or 150 mM glycylglycine dipeptide (Gly-Gly; ECh method; n = 5 per group, biological replicates). e, Cyanide detection in HepG2 cells with 0.1–10 µM phloroglucinol (Phl; ECh method; at least n = 5 per group, biological replicates). f, Cyanide detection from isolated lysosomes obtained from mouse liver homogenates incubated with 0.4 mM glycine in the absence or presence of 10 µM Phl (left) or HepG2 cells incubated with 0.4 mM or 10 mM glycine in the absence or presence of 10 µM Phl (ECh method; at least n = 5 per group, biological replicates). g, MPO and PXDN expression in lysosomal (L) and cytosolic (C) fractions of HepG2 cells (n = 5 biological replicates for MPO and n = 4 biological replicates for PXDN). h, Confocal microscopy of MPO localization in lysosomes. Nuclei were chemically stained using DAPI, while lysosomes and MPO were immunohistochemically detected using LAMP1 and MPO antibodies, respectively. Images shown are representative of n = 3 biological replicates per group. i, MPO or PXDN catalyse cyanide generation at pH 4.5 (enzyme was incubated with various combinations of 1 mM glycine, 1 mM H2O2 and 150 mM NaCl; ECh method; at least n = 5 per group, technical replicates). j, Determination of an optimal pH for cyanide generation using equimolar concentrations of HOCl and glycine (optimum pH 4.5; ECh method; n = 9 per group, technical replicates). k, Cyanide production in liver and spleen homogenates of WT, PXDN+/− and MPO−/− male mice under baseline conditions and after the addition of 10 mM glycine (Gly; ECh method; at least n = 4 per group, biological replicates). l, Detection of cyanide in HepG2 cells treated with 1–100 µM MPO inhibitor AZD-5904 (ECh method; at least n = 5 per group, biological replicates). m, Detection of cyanide in HEK293T cells overexpressing (OE) MPO or PXDN in the absence or presence of an additional 10 mM glycine (ECh method; at least n = 5 per group, biological replicates). n, Impact of overexpression of human rhodanese (OE-TST, cells from two different passages) or its downregulation (shTST) in HepG2 cells (as confirmed by western blots) on cellular capacity to degrade exogenously administered 100 µM KCN in the absence or presence of 1 mM sodium thiosulfate (ECh method; n = 5 per group, biological replicates). o, Overexpression of human rhodanese (OE-TST) or its downregulation (shTST) in HepG2 cells resulted in the reduction or accumulation, respectively, of endogenous cyanide in HepG2 cells (ECh method; n = 7 per group, biological replicates). Data in bg, i, jm and o are expressed as the mean ± s.e.m. Data in bf, i and ko were analysed with a two-way ANOVA followed by Bonferroni’s multiple-comparisons test. Data in c and g were analysed with a two-sided Student’s t-test. *P < 0.05 and **P < 0.01 indicate significant differences. p, Our proposed scheme of lysosomal cyanide generation. In lysosomes, at pH 4.5, glycine undergoes a two-step chlorination reaction in the presence of peroxidase-derived HOCl. The subsequent hydrolysis of N,N-dichloroglycine leads to the formation of an unstable nitrile derivative intermediate, which spontaneously decomposes to carbon dioxide (CO2) and hydrogen cyanide (HCN). HCN, in turn, is converted to SCN and CO2 via rhodanese/TST using thiosulfate in the extra-lysosomal cell compartment. Source data
Fig. 3
Fig. 3. HOCl-catalysed lysosomal HCN generation.
a, HCN generation after mixing equimolar amounts of HOCl and different proteinogenic amino acids at pH 4.5 in 50 mM sodium citrate buffer as quantified by the ECh method (n = 6 per group, biological replicates). b, Western blot analysis of MPO expression in liver homogenates from MPO−/− male mice compared to WT male controls. No quantification was performed for MPO expression due to no detectable protein band in the MPO−/− samples. c, Western blot analysis of PXDN expression in liver homogenates from PXDN+/− male mice compared to WT male controls, followed by the densitometric quantification of PDXN expression (at least n = 4 per group, biological replicates). d, HCN generation in HEK293T cells (WT) and HEK293T cells overexpressing catalase (OE-CAT) in the absence or presence of 10 mM glycine by using the ECh method (at least n = 5 per group, biological replicates). e, Decomposition of exogenously supplied potassium cyanide by HepG2 cells (WT) and HepG2 cells overexpressing CynD (n = 10 per group, biological replicates). f, Cyanide production in HepG2 cells (WT) and HepG2 cells overexpressing CynD (CynD) in the absence and presence of 10 mM glycine (at least n = 8 per group, biological replicates). g, Proposed mechanism and consequences of cyanide generation in mammalian cells. Lysosomal peroxidases, mainly MPO and PXDN, catalyse the production of HOCl from H2O2 and Cl. At physiological lysosomal pH 4.5, glycine is chlorinated by HOCl to generate N,N-dichloroglycine, which spontaneously decomposes into cyanide, CO2 and HCl. Cyanide diffuses through the lysosomal membrane to the cytosol where it acts as a signalling molecule (in part through S-cyanylation of target proteins), directly stimulates bioenergetics and provides cytoprotective effects. Data in a, c, d and f are expressed as the mean ± s.e.m. Data in a, d and f were analysed with a two-way ANOVA followed by Bonferroni’s multiple-comparisons test. Data in c were analysed with a two-sided Student’s t-test. *P < 0.05 and **P < 0.01 indicate significant differences. Source data
Fig. 4
Fig. 4. Cyanide induces posttranslational protein modifications.
ac, Proteome-wide and site-specific changes in S-cyanylation in HepG2 cells treated with 1 µM KCN (a), HepG2 cells treated with 10 mM glycine (Gly; b) and mouse liver tissue lysates treated with 10 mM Gly (c; n = 5 per group, biological replicates). d, Gene Ontology (GO) term enrichment (biological process) of the proteins whose S-cyanylation is significantly increased in HepG2 cells treated with Gly and cyanide releasers and decreased in cells cultured in glycine/serine-free medium. Using DAVID for enrichment, the outcomes were visualized through REVIGO. Significant GO terms passed the Benjamini-adjusted P-value threshold of 0.01. Circle dimensions denote the protein count within specific GO terms, while colour gradients communicate the degree of significance. e, GO term enrichment analysis (cellular localization) of cyanylated proteins. f, Zn2+-catalysed transformation of cyanylated peptides to light and heavy tetrazole, used to increase specificity of detected modifications. g, Venn diagram comparing the proteins found to contain 13C15N (heavy cyano) cyanylation with the endogenously cyanylated proteins (light cyano) in liver tissue lysates treated with 13C15N-labelled Gly (n = 5, biological replicates). h,i, Annotated MS/MS spectrum of peptides from Rab GDP dissociation inhibitor beta (UniProt accession: Q61598) displaying two cysteine sites—C203 labelled with light tetrazole (blue L) and C202 labelled with heavy tetrazole (red H; h)—and corresponding quantification of extracted ion chromatogram (XIC) area (n = 5 per group, biological replicates; i). j, Proposed scheme of protein S-cyanylation. After reaction with reactive oxygen species (ROS), thiols (RSH) become oxidized to either sulfenic acid (RSOH) or disulfides (RSSR), which could be both intramolecular and intermolecular disulfides. Both ROSH and RSSR could react with HCN leading to protein cyanylation (RSCN). When SH groups are hyperoxidized, they are no longer reactive to cyanide. k, Left, Enzymatic activity of GAPDH pre-incubated with H2O2 (10 µM), KCN (10 µM) or H2O2/KCN (at least n = 6 per group, biological replicates). Right, Detection of high-pH-induced peptide bond cleavage at cyanylation sites of GAPDH that was treated with a different combination of KCN, H2O2 or diamide (Dm; SDS–PAGE analysis). l, Left, Enzymatic activity of GPDH pre-incubated with H2O2 (10 µM), KCN (10 µM) or H2O2/KCN (n = 3 per group, biological replicates). Right, Detection of high-pH-induced peptide bond cleavage at cyanylation sites of GPDH that was treated with a different combination of KCN, H2O2 or diamide (Dm; SDS–PAGE analysis). Data in i, k and l are expressed as the mean ± s.e.m. Data in k and l were analysed with a two-way ANOVA followed by Bonferroni’s multiple-comparisons test. *P < 0.05 and **P < 0.01 indicate significant differences. Source data
Fig. 5
Fig. 5. Endogenous cyanide generation supports cellular bioenergetics and proliferation.
a, Bioenergetic profile of HepG2 cells treated with 10 mM glycine for 24 h in the absence (Gly) or presence of 10 µM cyanide scavenger THC or CoE for the last 3 h, or grown in Ser/Gly-free medium (at least n = 5 per group, biological replicates). b, Bioenergetic profile of WT versus TST-overexpressing (OE-TST) versus TST-knockdown (shTST) HepG2 cells in the absence (vehicle) or presence of 10 mM glycine for 24 h (Gly) or 10 µM THC for 3 h (at least n = 5 per group, biological replicates). c, Targeted metabolomic analysis of HepG2 cells subjected to exogenous 10 nM KCN or 10 mM glycine, or grown in −Ser/Gly medium for 24 h. G6P, glucose-6-phosphate; α-KG, α-ketoglutarate (n = 3 per group, biological replicates). d, FFA oxidation analysis of HepG2 cells in the absence and presence of 10 mM glycine for 24 h (at least n = 5 per group, biological replicates). ei, Proliferation of HepG2 cells in the presence of 1 nM–100 µM KCN (e), in the presence of 10 mM glycine (measured by the IncuCyte system) (f), in the presence of 0.4 mM (standard medium—control) or 10 mM glycine in the presence or absence of 10 µM THC or 10 µM CoE (g), 10 µM Hcq (h) or 1–10 µM Phl determined at 24 h by the 5-bromo-2′-deoxyuridine (BrdU) assay (i; at least n = 3 per group, biological replicates). j, Proliferation of WT versus OE-TST versus shTST HepG2 cells in the absence or presence of 10 mM glycine determined at 24 h by the BrdU assay (n = 4 per group, biological replicates). Data are expressed as the mean ± s.e.m. and were analysed with a two-way ANOVA followed by Bonferroni’s multiple-comparisons test. *P < 0.05 and **P < 0.01 indicate significant differences. TCA, tricarboxylic acid. Source data
Fig. 6
Fig. 6. Glycine-induced transcriptomic changes.
Gene-set enrichment analysis (GSEA), using the hallmark pathway gene sets of HepG2 cells incubated with 10 mM glycine for 24 h compared to vehicle. Data were obtained from RNA-seq of n = 3 biological replicates per group. FDR, false discovery rate. Source data
Fig. 7
Fig. 7. Controlled cyanide supplementation exerts cytoprotective effects.
a,b, Effect of treatment with 10 mM glycine, 10 nM KCN, 10 µM THC, 10 µM CoE and the −Ser/Gly medium in HepG2 cells subjected to hypoxia (48 h) or hypoxia–reoxygenation (48/24 h) on lactate dehydrogenase (LDH) release (at least n = 5 per group, biological replicates; a) and HIF-1α expression (n = 5 per group, biological replicates; b). c, Cyanide release from mandelonitrile, linamarin and amygdalin (ECh method; at least n = 5 per group, biological replicates). d,e, Effect of 300 µM mandelonitrile, linamarin and amygdalin on cell proliferation (d) and hypoxia-induced and hypoxia–reoxygenation-induced cell injury (measured as LDH release) in HepG2 cells (at least n = 5 per group, biological replicates; e). f,g, Cyanide concentrations in mouse blood under baseline conditions (f) and after administration of 0.1 mg per kg body weight KCN, 100 mg per kg glycine or 10 mg per kg amygdalin (at least n = 6 per group, biological replicates; g). h,i, Effect of 300 mg per kg glycine or 3–300 mg per kg amygdalin on infarct size in a model of myocardial ischaemia–reperfusion in male C57BL/6J mice. The infarct size (I) relative to the area at risk (AAR), AAR relative to the whole myocardial area (ALL) and myocardial ischaemia (MI) relative to reperfusion (R) are shown (at least n = 5 per group, biological replicates). Images shown in i are representative of n = 6 biological replicates per group. j, Effect of 10 mg per kg amygdalin on markers of organ damage (AST, aspartate aminotransferase; ALT, alanine transaminase; lung permeability) in a model of haemorrhagic shock in male C57BL/6J mice. T/SS, sham-shock; T/HS, haemorrhagic shock (n = 4 per group, biological replicates). Data in ah and j are expressed as the mean ± s.e.m. Data in ae, g, h and j were analysed with a two-way ANOVA followed by Bonferroni’s multiple-comparisons test. Data in f were analysed with a two-sided Student’s t-test. *P < 0.05 and **P < 0.01 indicate significant differences. BALF, bronchoalveolar lavage fluid; EBD, Evans blue dye. Source data
Fig. 8
Fig. 8. Endogenous cyanide generation is increased and cell function is diminished in fibroblasts derived from individuals with NKH.
a, Confocal microscopy images showing increased endogenous cyanide levels in fibroblasts derived from individuals with NKH (cell lines GM00880, GM00747 and GM10360) compared to control fibroblasts from healthy individuals (Detroit 551) in controls (vehicle) and in the presence of 10 µM THC or 100 µM Hcq as visualized by CSP cyanide-selective probe. Images shown are representative of n = 3 biological replicates per group. b, Confocal microscopy images showing the partial colocalization of cyanide (CSP probe) with lysosomes (LysoTracker) in NKH fibroblasts compared to healthy controls. Images shown are representative of n = 3 biological replicates per group. c, Quantification of intracellular glycine concentrations in control (CTR) and NKH fibroblasts (n = 5 per group, biological replicates). d, Cyanide production in CTR and NKH fibroblasts under basal conditions (vehicle) and after 24 h treatment with 10 µM Hcq or 10 µM THC (ECh method; at least n = 6 per group, biological replicates). e, Bioenergetic profile measured by extracellular flux analysis in healthy control and NKH fibroblasts indicating mitochondrial dysfunction. OCR, oxygen consumption rate. Arrows represent the addition of ATP synthase inhibitor oligomycin, the uncoupling agent carbonyl cyanide-4-(trifluoromethoxy)phenylhydrazone (FCCP) and the combined addition of the mitochondrial complex I inhibitor rotenone and the mitochondrial complex III inhibitor antimycin (R/A) in the extracellular flux analysis protocol. fh, Cellular viability (LDH release; n = 6 per group, biological replicates; f), proliferation rate (BrdU incorporation; n = 6 per group, biological replicates; g) and cellular bioenergetic parameters (h) in healthy controls and NKH fibroblasts in the absence or presence of 30 µM hydroxychloroquine for 72 h (at least n = 5 per group, biological replicates). i,j, Cell viability (n = 6 per group, biological replicates; i) and proliferation (n = 6 per group, biological replicates; j) of NKH fibroblasts at the baseline (vehicle) or treated with 10 mM glycine for 72 h. k, Proposed scheme of the bell-shaped concentration–response curve of cyanide in mammalian cells. At physiological concentrations, cyanide supports mitochondrial function, stimulates metabolism and supports proliferation. TST or CynD overexpression results in an increased decomposition of endogenously generated cyanide, and attenuates these stimulatory effects (black arrow). A similar mechanism is responsible for the bioenergetic effect of cyanide scavengers or inhibitors of cyanide generation in healthy control cells (red arrow). TST silencing attenuates the decomposition of endogenously generated cyanide (blue arrow). Cyanide accumulates and reaches levels at which it impairs mitochondrial function, suppresses bioenergetics and proliferation. When cyanide is generated at very high rates (such as in NKH cells, which accumulate glycine), cyanide reaches concentrations where it markedly impairs metabolism and proliferation and exerts cytotoxic effects. Inhibition of cyanide generation in NKH cells attenuates these toxic effects (red arrow). Data in cj are expressed as the mean ± s.e.m. Data in dh were analysed with a two-way ANOVA followed by Bonferroni’s multiple-comparisons test. Data in c, i and j were analysed with a two-sided Student’s t-test. *P < 0.05 and **P < 0.01 indicate significant differences. Source data
Extended Data Fig. 1
Extended Data Fig. 1. Cyanide detection methods used.
The electrochemical (ECh) method (h-i), the LC-MS/MS method, and (j-m) the monocyano-cobinamide (MCC) method of cyanide quantification. (a) Workflow of HCN detection using the electrochemical method (ECh) used in the current study. RT – room temperature. Created with BioRender.com. (b) Standard curve using potassium cyanide (KCN) prepared in 0.5 M NaOH in closed Eppendorf tubes and measured after 30 min incubation at room temperature (at least n = 5 per group, technical replicates). (c) Ion-selectivity of the ECh method (at least n = 3/group, technical replicates). (d) Increase of HCN generation as compared to the vehicle (Δ Cyanide) measured in the presence of different proteinogenic amino acids (10 mM) in mouse liver tissue (at least n = 5/group, technical replicates). (e) Increasing concentrations of glycine do not interfere with KCN detection (n = 5/group, technical replicates). (f) Decrease of free HCN levels in the presence of 0-100 µM HCN scavengers trihistidyl-cobinamide (THC) or dicobalt edetate (CoE) (at least n = 3/group, technical replicates). (g) The pharmacological modulators used in the study do not interfere with cyanide detection: 100 µM SHMT inhibitor, 1 µM bafilomycin, 100 µM hydroxychloroquine, 150 mM glycine-glycine, 10 µM phloroglucinol and 10 µM AZD-5904 (n = 5/group, technical replicates). (h) Workflow of HCN detection using LC-MS/MS. Created with BioRender.com. (i) Standard-curve of potassium cyanide (KCN) and reaction of HCN with 2,3-naphtalenedialdehyde (NDA) and taurine to produce the fluorescent product 1-cyano-benzoisoindole (CBI) (n = 3/group, technical replicates). (j) Workflow of HCN detection using the monocyano-cobinamide (MCC) method. Created with BioRender.com. (k) UV-Vis absorption spectra of MCC exposed to increased concentrations of HCN (provided as KCN). (l) Molecular structure of MCC which, in the presence of HCN, is converted to dicyano-cobinamide. (m) Standard curve of potassium cyanide (KCN) using the MCC method (n = 2/group, technical replicates). Data in c, d, e, f, g, m are expressed as the mean ± s.e.m. Source data
Extended Data Fig. 2
Extended Data Fig. 2. Modulation of HCN levels in HepG2 cells.
Increasing concentrations of (a) the HCN scavenger trihistidyl-cobinamide (THC, 0-30 µM) (at least n = 5/group, biological replicates), (b) the HCN scavenger dicobalt edetate (CoE, 0-30 µM) (at least n = 5/group, biological replicates), (c) the glycine transporter GlyT-1 inhibitor iclepertin (ICE 10-100 µM) (at least n = 5/group, biological replicates), and (d) the SHMT inhibitor lometrexol hydrate (LH, 1-10 µM) (at least n = 5/group, biological replicates) abrogate the glycine-induced increase in HCN signal from HepG2 cells, as measured by electrochemical method. (e) The glycine receptor antagonist strychnine (Str) does not affect glycine-stimulated cyanide generation (at least n = 6/group, biological replicates). Data in a, b, c, d, e, are expressed as the mean ± s.e.m. Data were analysed with a two-way ANOVA followed by Bonferroni’s multiple-comparisons test. *p < 0.05 and **p < 0.01 indicate significant differences. Source data
Extended Data Fig. 3
Extended Data Fig. 3. Confocal microscopy analysis of cyanide and HOCl generation in HepG2 cells.
(a) Workflow of HCN detection using confocal microscopy. MPO – myeloperoxidase. Created with BioRender.com. (b) Confocal microscopy of HepG2 cells incubated with 10 µM selective HCN probe for 1 h incubation together with other cell-permeant dyes (10 µM Calcein AM, 1 µM CellMask Green Actin Tracking Stain or 200 nM MitoTracker Deep Red FM) for 30 minutes at 37 °C and 5% CO2. At the end of the incubation, cells were washed 3x and visualized using confocal microscope. Following excitation and emission spectra were used: HCN probe (Ex405/Em584-620 nm), Calcein AM (Ex488/Em517 nm), CellMask Plasma Membrane Stain (Ex488/Em535 nm) MitoTracker Deep Red FM (Ex644/Em665 nm). Images shown are representative of n = 3 biological replicates/group. (c) Co-localization of MPO with various subcellular organelles. Representative confocal microscopy images of HepG2 showing that MPO does not localize to the endoplasmic reticulum (ER) nor mitochondria. ER was visualized by using 500 nM ER tracker green. Primary anti-MPO antibody (mouse, dilution 1:10,000, Sigma-Aldrich) followed by incubation with appropriate secondary antibody goat anti-rabbit IgG (H + L) Highly Cross-Adsorbed Secondary Antibody Alexa Fluor Plus 647 (1:1,000 dilution) was used for detection of MPO. Mitochondria were visualized by using 200 nM MitoTracker Deep Red FM stain, while cellular nuclei were stained by 5 µg/ml DAPI. Images were collected at Leica 8 STELLARIS Falcon using 63x magnification. For co-localization with ER, ER tracker was visualized at Ex504/Em511 nm and MPO at Ex647/Em665 nm. For co-localization with mitochondria, MitoTracker was visualized at Ex647/Em665 nm and MPO at Ex568/Em603 nm. Images shown are representative of n = 3 biological replicates/group. (d) Co-localization of HOCl with lysosomes. Representative confocal microscopy image of HepG2 showing that HOCl localizes with lysosomes. HepG2 cells were loaded with 10 µM Chemosensor P in HBSS for 1 h together with 50 nM LysoTrackerGreen for 30 min at 37 °C and 5% CO2. At the end of the incubation, cells were washed 3x and visualized using confocal microscope. Following excitation and emission spectra were used: HOCl probe (Ex405/Em450-550 nm) and LysoTrackerGreen Ex488/Em517 nm. Images shown are representative of n = 3 biological replicates/group. Source data
Extended Data Fig. 4
Extended Data Fig. 4. Mechanisms of lysosomal HCN production.
(a) Western blot of cytosolic (C) vs lysosomal (L) fractions from HepG2 cells. LAMP-1: lysosomal associated membrane protein 1; GAPDH: glyceraldehyde 3-phosphate dehydrogenase. (b) Western blot of lysosomal (L), extra-lysosomal (EL) and cytosolic (C) fractions from mouse liver. (c) HCN detection in the lysosomal vs cytosolic fractions of HepG2 cells, with or without incubation with glycine (10 mM), as measured with the LC-MS/MS method (at least n = 4, biological replicates). (d) Inhibitory effect of the lysosomal proton pump inhibitor bafilomycin (Baf, 0.1- 1 µM) on cyanide production in HepG2 cells in the presence of increasing concentration (10 mM) of glycine (Gly) (at least n = 4/group, biological replicates). (e) Inhibitory effect of the lysosomal deacidifier hydroxychloroquine (1-100 µM) on cyanide production in HepG2 cells (at least n = 4/group, biological replicates). (f) Inhibitory effect of the peroxidase inhibitor phloroglucinol (Phl, 1- 30 µM) on cyanide production in HepG2 cells (at least n = 4/group, biological replicates). (g) Western blots of the expression of catalase and various peroxidases – catalase, peroxiredoxin3 (PRDX3), peroxiredoxin6 (PRDX6), glutathione S-transferase alpha1 (GSTA1), glutathione S-transferase alpha2 (GSTA2), and microsomal glutathione S-transferase1 (MGST1) – in cytosolic (C) vs. lysosomal (L) fractions of HepG2 cells, including densitometric quantification of their relative expression (n = 5/group, biological replicates). Data in c, d, e, f, g, are expressed as the mean ± s.e.m. Data in c, d, e, f were analysed with a two-way ANOVA followed by Bonferroni’s multiple-comparisons test. Data in g were analysed with a two-sided Student’s t-test. *p < 0.05 and **p < 0.01 indicate significant differences. Source data
Extended Data Fig. 5
Extended Data Fig. 5. S-cyanylome remodeling caused by glycine or various cyanide donors.
The proteome-wide and site-specific changes in S-cyanylation in (a) HepG2 cells treated with 10 nM KCN, (b) 100 µM mandelonitrile and (c) 100 µM amygdalin. N = 5/group, biological replicates. Colored dots represent cyanylated peptides found to be statistically significantly affected by the treatment; p < 0.05. (d) Venn diagram of proteins whose S-cyanylation was found to be significantly increased in HepG2 cells treated with 1 nM KCN, 10 nM KCN, and 100 µM mandelonitrile. (e) Proteome-wide and site-specific changes in S-cyanylation in HepG2 cells grown in glycine/serine free medium. (f) Annotated MS/MS spectra of peptide from glycine N-methyltransferase (UniProt accession: Q9QXF8) with C186 site either as carbamidomethylated (IAM) or containing light (blue L) or heavy (red H) tetrazole. Source data
Extended Data Fig. 6
Extended Data Fig. 6. S-Cyanylation of glyceraldehyde 3-phosphate dehydrogenase (GAPDH) and glycerol-3-phosphate dehydrogenase (GPDH).
(a) Schematic representation of chemical cleavage of polypeptide’s backbone occurring after S-cyanylation of target cysteine residues under alkaline conditions. Cleavage is then detected by SDS-PAGE followed by Coomassie-staining. Created with BioRender.com. (b) Human GAPDH contains three cysteine residues. S-cyanylation of GAPDH results in the generation of two visible bands that are consistent with one single cleavage reaction and one S-cyanylation site. (c) MS label-free quantification of S-cyanylation of C247 peptide. Peptide intensity is normalized to the total GAPDH in each sample. 0.55 µM GAPDH was treated with 10 µM KCN, 10 µM H2O2 or their combination (n=XX/group, technical replicates). (d) MS label-free quantification of GPDH treated with 10 µM KCN, 10 µM H2O2 or their combination (n = 5/group, biological replicates). ND – not detected. Data in c, d are expressed as the mean ± s.e.m. Data in c were analysed with a two-way ANOVA followed by Bonferroni’s multiple-comparisons test. **p < 0.01 indicates significant differences. Source data
Extended Data Fig. 7
Extended Data Fig. 7. Endogenous HCN modulates cellular bioenergetics in HepG2 cells: extracellular flux analysis.
(a) Glycine-dependent stimulation of cellular bioenergetics is abrogated by HCN scavengers. Extracellular flux analysis of HepG2 cells incubated with 10 mM glycine (Gly) for 24 h followed by 3 h with 10 µM of the cyanide scavengers (trihistidyl-cobinamide (THC) or dicobalt edetate (CoE). OCR: oxygen consumption rate (at least n = 5/group, biological replicates). (b) HepG2 cells incubated with serine/glycine free medium (-Ser/Gly) or with serine/glycine free medium re-supplemented with 0.4 mM serine and 0.4 mM glycine (+Ser/Gly) (at least n = 5/group, biological replicates). (c,d). Glycine-dependent stimulation of cellular bioenergetics is abrogated by overexpression of the HCN-catabolizing enzyme cyanide dihydratase (CynD) in HepG2 cells, compared to normal control wild-type (WT) cells. Extracellular flux analysis (n = 6/group, biological replicates). (e,f) Free fatty acid oxidation extracellular flux analysis of (e) control HepG2 cells and (f) HepG2 cells pretreated with 4 µM etomoxir (carnitine palmitoyl transferase-1 inhibitor). In both cases, cells were pre-incubated in presence of 10 mM glycine or vehicle for 24 h. Arrows in panels a, b, c, e and f represent the times of the addition of the ATP synthase inhibitor oligomycin, the uncoupling agent carbonyl cyanide-4-(trifluoromethoxy)phenylhydrazone (FCCP) and the combined addition of the mitochondrial Complex I inhibitor rotenone and the mitochondrial Complex III inhibitor antimycin (R/A) in the Extracellular Flux Analysis protocol (at least n = 5/group, biological replicates). Data are expressed as the mean ± s.e.m. Data were analysed with a two-way ANOVA followed by Bonferroni’s multiple-comparisons test. *p < 0.05 and **p < 0.01 indicate significant differences. Source data
Extended Data Fig. 8
Extended Data Fig. 8. Effect of KCN, glycine supplementation or serine/glycine deprivation on glycolysis and Krebs cycle.
Metabolite levels analyzed by LCMS in HepG2 cells cultured in normal medium, in normal medium supplemented with 10 nM KCN, 10 mM glycine (Gly) or under deprivation of serine and glycine (-Ser/Gly). Relative % changes compared to the baseline levels of the metabolites (detected in normal culture medium) are shown. Metabolites in yellow squares were not detected by the method used. Data are expressed as the mean ± s.e.m. of n = 3 independent experiments and were analysed with a two-way ANOVA followed by Bonferroni’s multiple-comparisons test. *p < 0.05 and **p < 0.01 indicate significant differences. Source data

References

    1. Wang, R. Gasotransmitters: growing pains and joys. Trends Biochem. Sci.39, 227–232 (2014). - PubMed
    1. Kelm, M. Nitric oxide metabolism and breakdown. Biochim. Biophys. Acta1411, 273–289 (1999). - PubMed
    1. Moncada, S., Palmer, R. M. & Higgs, E. A. Nitric oxide: physiology, pathophysiology, and pharmacology. Pharmacol. Rev.43, 109–142 (1991). - PubMed
    1. Wang, R. Physiological implications of hydrogen sulfide: a whiff exploration that blossomed. Physiol. Rev.92, 791–896 (2012). - PubMed
    1. Wu, L. & Wang, R. Carbon monoxide: endogenous production, physiological functions, and pharmacological applications. Pharmacol. Rev.57, 585–630 (2005). - PubMed

LinkOut - more resources