. 2025 Apr;44(8):2323-2352.
doi: 10.1038/s44318-025-00398-0. Epub 2025 Mar 3.

Noncanonical circRNA biogenesis driven by alpha and gamma herpesviruses

Affiliations

Noncanonical circRNA biogenesis driven by alpha and gamma herpesviruses

Sarah E Dremel et al. EMBO J. 2025 Apr.

Abstract

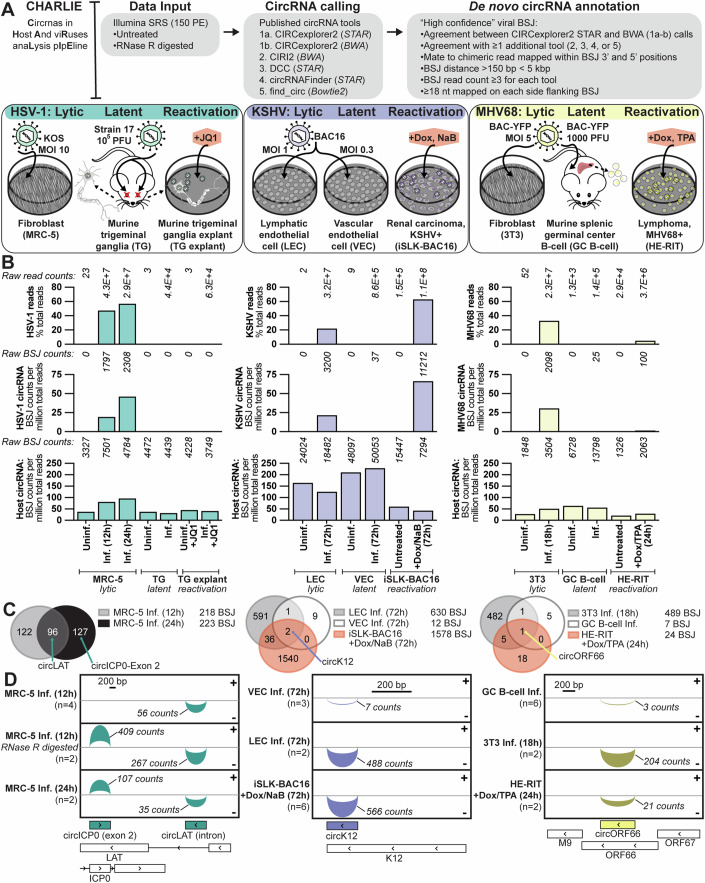
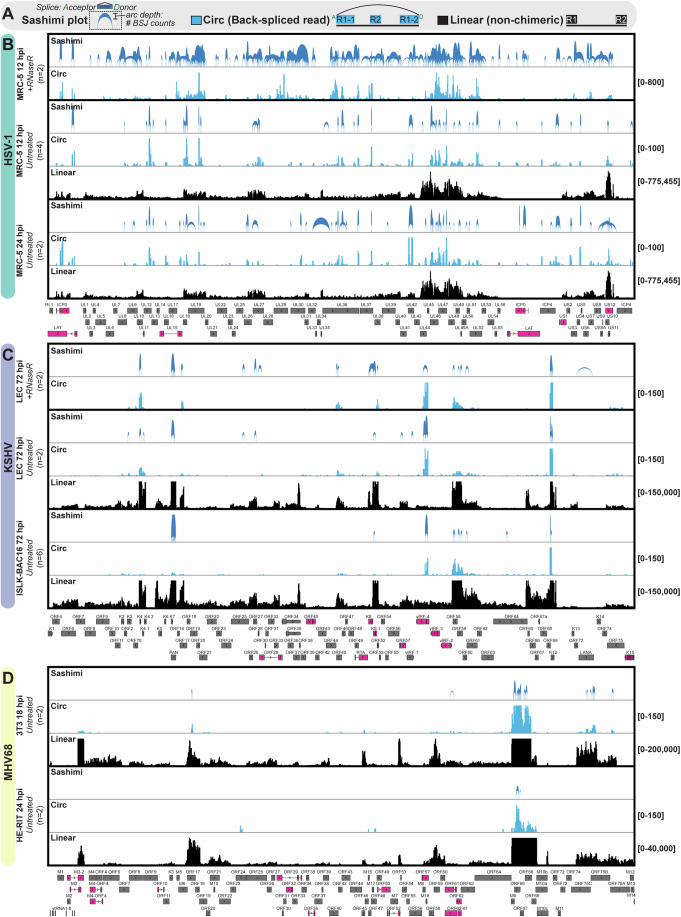
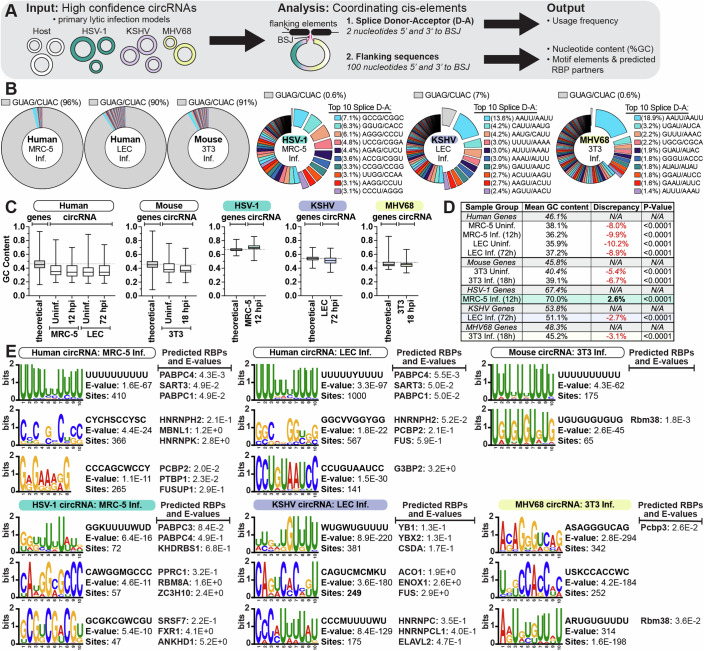
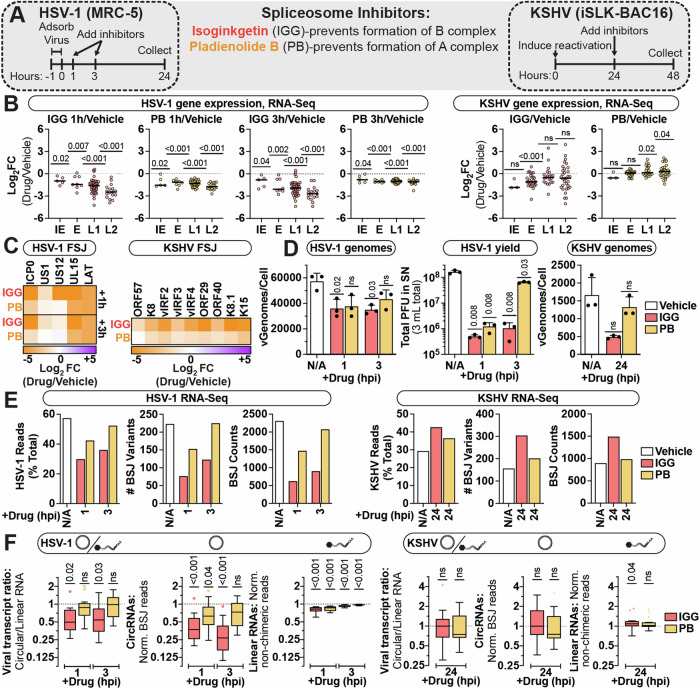
Herpesviruses require the host transcriptional machinery, inducing significant changes in gene expression to prioritize viral transcripts. We examined alpha- and gamma-herpesvirus alterations to a type of alternative splicing, namely circular RNA (circRNA) synthesis. We developed "Circrnas in Host And viRuses anaLysis pIpEline" (CHARLIE) to facilitate viral profiling. This method identified thousands of back-splicing variants, including circRNA common to lytic and latent phases of infection. Ours is the first report of Herpes Simplex Virus-1 circRNAs, including species derived from ICP0 and the latency-associated transcript. We characterized back-splicing cis- and trans-elements, and found viral circRNAs resistant to spliceosome perturbation and lacking canonical splice donor-acceptors. Subsequent loss-of-function studies of host RNA ligases (RTCB, RLIG1) revealed instances of decreased viral back splicing. Using eCLIP and 4sU-Sequencing, we determined that the KSHV RNA-binding protein, ORF57, enhanced synthesis for a subset of viral and host circRNAs. Our work explores unique splicing mechanisms driven by lytic infection, and identifies a class of transcripts with the potential to function in replication, persistence, or tumorigenesis.

Keywords: Alternative Splicing; Circular RNAs; Herpesviruses; RNA-Binding Proteins.


Conflict of interest statement

Disclosure and competing interests statement. The authors declare no competing interests.

Figures

Figure 1
Figure 1. Herpesvirus circRNA repertoire.
(AD) Infection models include HSV-1: infected fibroblasts (MRC-5), latently infected murine trigeminal ganglia (TG), and latently infected murine TG explanted (TG explant) with or without a reactivation enhancer (JQ1); KSHV: infected human dermal lymphatic endothelial cells (LEC) or human umbilical vascular endothelial cells (VEC), iSLK-BAC16 reactivated with doxycycline (Dox) and sodium butyrate (NaB); MHV68: infected mouse fibroblasts (3T3), latently infected murine germinal center B cells (GC B-cell), and A20 HE-RIT (HE-RIT) reactivated with Dox and tetradecanoyl phorbol acetate (TPA). (A) Infographic for profiling strategy. (B) All reads mapped to the viral genome as a percentage of total reads. The sum of raw counts for each condition are reported above. High-confidence viral or host circRNAs plotted as BSJ counts per million total reads. The sum of raw BSJ counts for each condition are reported above. Column bars are the average of biological replicates. (C) Venn diagrams of overlapping high-confidence viral back splice junction (BSJ) variants. (D) Sashimi plots for select high-confidence circRNA variants, arcs are proportional to raw BSJ counts. Data Information: RNA-sequencing was performed, and high-confidence circRNAs were called using CHARLIE (Circrnas in Host And viRuses anaLysis pIpEline).
Figure 2
Figure 2. Profile of high-incidence lytic circRNAs.
(A) Infographic for data visualization. (BD) Visualization of high-confidence circRNAs for HSV-1, KSHV, and MHV68 in lytic models described in Fig. 1. If indicated, RNA samples were enriched for circRNAs using RNase R ( + RNase R). Single-exon (gray) and multi-exon (pink) viral genes are shown below. Data Information: RNA-Seq was performed and high-confidence circRNAs were called using CHARLIE. Sashimi plots are limited to circRNA variants identified in at least two biological replicates, arcs are proportional to raw BSJ counts. Blue and black traces include circular (back-spliced reads) and linear (non-chimeric) reads, respectively. Traces are the sum of raw BSJ or linear read values for all biological replicates. Y axis minimum and maximum values are shown on the right.
Figure 3
Figure 3. Cis-elements coordinating viral back-splicing events.
(A) Infographic for BSJ flanking cis-element analysis performed on high-confidence viral and host circRNAs identified in primary lytic infection models (infected MRC-5, LEC, 3T3). (B) Splice donor–acceptor frequency for high-confidence BSJ variants, reported as sense and antisense sequences. The percentage which use the canonical splice donor–acceptor are reported above. (C, D) Box and whiskey plots and table summary for GC content of 100 nucleotides (nt) BSJ flanking sequences relative to the theoretical GC content of all genes in an organism. (E) Motif discovery was performed for 100 nt BSJ flanking sequences. The top three motifs were represented as nucleotide consensus plots, with E-values, and the number of sites in input sequences to the right. The top three predicted RBP-binding partners for each motif are listed. Data Information: Within box & whisker plots the lower and upper bounds of the box are at the first and third quartiles, respectively, the center line at the median, and the minima and maxima values are indicated by whiskers. For GC-content analysis, Wilcoxon t tests were performed relative to the theoretical gene GC content, P values are given. Discriminative motif discovery was performed using the MEME algorithm. The top three most significant motifs, by weighted E value, were included. Motif-motif similarity analysis was performed using the TOMTOM algorithm. For predicted RBP-binding partners, all hits had Bonferroni corrected P value < 0.05 and only the top three most significant are shown.
Figure 4
Figure 4. Impact of spliceosome perturbation on viral circRNA synthesis.
(A) Experimental infographic. Infection models were treated with spliceosome inhibitors, isoginkgetin (IGG) and pladienolide B (PB). HSV-1-infected fibroblasts were treated with inhibitors at 1 or 3 h post infection and collected at 24 h post infection. iSLK-BAC16 were treated with inhibitors at 24 h after lytic reactivation and collected after 24 h of inhibitor treatment. (B) Viral gene expression (each data point is a gene) clustered by transcriptional class: Immediate early (IE; HSV-1 n = 5, KSHV n = 3), Early (E; HSV-1 n = 8, KSHV n = 28), Leaky Late (L1; HSV-1 n = 41, KSHV n = 21), Late (L2; HSV-1 n = 17, KSHV n = 32). (C) Expression of spliced viral transcripts, quantified via forward spliced junctions (FSJ). (D) qPCR assessment of genome quantity (n = 3), plotted as viral genomes per cell (vGenomes/Cell). HSV-1 yield (n = 3) plotted as plaque-forming units (PFU) per mL supernatant (SN). (E) RNA-Seq overview for all viral mapped reads (MR), as percent total reads (% Total). The number of unique BSJ variants and total BSJ counts is reported for high-confidence viral circRNAs. (F) CircRNA quantitation via CHARLIE, graphed as Tukey’s box plots. Transcript ratios were determined by plotting gene expression for a given loci, with circular (BSJ-containing reads) over linear (non-chimeric) reads. Only circRNA loci with >5 BSJ reads per sample in all conditions were included (HSV-1 n = 12, KSHV n = 18). Data Information: RNA-Seq data is normalized to ERCC spike-in controls. In viral gene expression graphs, each dot is the average of biological duplicates for a gene, cross-bars are the average. In heatmaps, all data is the average of biological duplicates and plotted as log2FC (Drug/Vehicle). In viral genomes and yield graphs, data points are biological replicates, bar maxima are the average, error bars are standard deviation. For Tukey box plots, the lower and upper bounds of the box are the first and third quartiles, respectively, the center line at the median. The whiskers represent a distance of 1.5 times the IQR relative to the upper or lower quartile; data points are values which did not reside within this range. For viral genomes and yield, paired t tests (Drug-Vehicle) were performed, P values < 0.05 are labeled and not significant (ns) indicates P values ≥ 0.05. For viral circRNA quantitation, Wilcoxon signed-rank tests were performed for each circRNA loci relative to a paired vehicle control, P values < 0.05 are labeled and not significant (ns) indicates P values ≥ 0.05. Source data are available online for this figure.
Figure 5
Figure 5. Dependence of viral circRNAs on host RNA ligases.
(A) Experimental infographic. MRC-5 were transfected with siRNAs targeting RNA ligases (RLIG1, RTCB) or a nontargeting control (NTC) for 48 h. MRC-5 were infected with HSV-1 for an additional 12 or 24 h (12 or 24 h). iSLK-BAC16 were siRNA transfected for 24 h followed by lytic reactivation for 72 h (72 h). (B) Viral gene expression (each data point is a gene) clustered by transcriptional class: Immediate early (IE; HSV-1 n = 5, KSHV n = 3), Early (E; HSV-1 n = 8, KSHV n = 28), Leaky Late (L1; HSV-1 n = 41, KSHV n = 21), Late (L2; HSV-1 n = 17, KSHV n = 32). (C) Expression of spliced viral transcripts, quantified via forward spliced junctions (FSJ). (D) qPCR assessment of genome quantity (n = 3–4) plotted as viral genomes per cell (vGenomes/Cell). HSV-1 yield (n = 3) plotted as plaque-forming units (PFU) per mL supernatant (SN). KSHV progeny (n = 3) plotted as protected viral genomes (encapsidated genomes per mL in SN) or infectivity measured via supernatant transfer (%GFP+ Vero). (E) CircRNA quantitation via CHARLIE, graphed as Tukey’s box plots. Transcript ratios were determined by plotting gene expression for a given loci, with circular (BSJ-containing reads) over linear (non-chimeric) reads. Only circRNA loci with >5 BSJ reads per sample in all conditions were included (HSV-1 n = 30, KSHV n = 50). (F) ddPCR quantitation using divergent (circRNA) or convergent (gene) primers (n = 4–5). Data Information: RNA-Seq data is normalized to ERCC spike-in controls. In viral gene expression graphs, each dot is the average of biological duplicates for a gene, cross-bars are the average. In heatmaps, all data is the average of biological duplicates and plotted as log2FC (RNA ligase/NTC). In column bar graphs, data points are biological replicates, bar maxima are the average, error bars are standard deviation. For Tukey box plots, the lower and upper bounds of the box are the first and third quartiles, respectively, the center line at the median. The whiskers represent a distance of 1.5 times the IQR relative to the upper or lower quartile; data points are values which did not reside within this range. For viral genomes, viral yield, and ddPCR assays paired t tests (RNA ligase-NTC) were performed, P values < 0.05 are labeled and not significant (ns) indicates P values ≥0.05. For circRNA quantitation (RNA-Seq), Wilcoxon signed-rank tests were performed for each circRNA loci relative to a paired NTC control, P values < 0.05 are labeled and not significant (ns) indicates P values ≥ 0.05. Source data are available online for this figure.
Figure 6
Figure 6. Impact of key lytic effectors on viral circRNA synthesis.
(AF) RNA-Seq data from HSV-1 (MRC-5 cells infected at an MOI of 10 PFU/cell for 12 h) and KSHV (iSLK-BAC16 induced with Dox and NaB for 3 days) infection. Experiments were performed with mutant cells and viruses which lack expression of the viral protein indicated. If indicated, cells were treated with cidofivir (CDV), phosphonoacetic acid (PAA), or cycloheximide (CHX) at 0 h post infection (hpi). (A, C) Sequencing overview for all viral mapped reads (MR), as percent total reads (% Total). The number of unique BSJ variants, total BSJ counts, or BSJ counts/variant is reported for high-confidence viral circRNAs. (B, D) Transcript (circ/linear) ratios for high-confidence viral BSJ variants. (E) The top five most highly expressed circRNAs in each sample were merged to form heatmaps which report log10 BSJ counts for biological duplicates. BSJ positions are reported on the left. Colinear genes and their gene class are reported on the right, with IE (immediate early), E (early), L1 (leaky late), L2 (true late). Data Information: RNA-Sequencing was performed and high-confidence circRNAs were called using CHARLIE. All analysis is relative to a paired wild-type (WT) control. In column bar graphs, data points are biological replicates, and bar maxima are average. In transcript ratio graphs, each dot is the average of biological duplicates for a unique BSJ, cross-bars are the geometric mean and error bars are the geometric standard deviation.
Figure 7
Figure 7. ORF57 regulation of circRNA synthesis
(A, B) ORF57 eCLIP (n = 2) was performed on iSLK-BAC16 reactivated for 24 h. “Input” is a paired, size-selected RNA-Seq wherein ORF57 immunoprecipitation (IP) was not performed. (A) Reads mapped to ribosomal RNA (rRNA), human genes (excluding rRNA), or KSHV genes are plotted as a function of total reads. Uniquely mapped reads containing forward or back splice junctions were plotted relative to all reads mapped to their respective genome. (B) Overlapping identity of high-confidence circRNAs called in the dataset. (C, D) Bulk RNA-Seq (Total) and 4sU RNA-Seq (4sU) was performed on ΔORF57 (KO) or iSLK-BAC16 (WT) cells with (24 h) or without (Unind.) reactivation. (C) The number of unique BSJ variants and total BSJ counts is reported for all high-confidence circRNAs. (D) Normalized BSJ counts and circ/linear ratios for select circRNAs. Data Information: eCLIP and RNA-Seq data is the average of biological duplicates. RNA-Seq data was normalized as follows: 4sU-Seq-Reads Per Kilobase per Million mapped reads (RPKM); total relative to ERCC spike-ins. In column bar graphs, data points are biological replicates, and bar maxima are average.
Figure EV1
Figure EV1. CircRNA derived from HSV-1 latency-associated transcript.
(A, B) Our high-confidence circRNA threshold was lowered (count of ≥1 rather than ≥3) to reanalyze murine HSV-1 infection models. The overlapping incidence of these circRNAs is demonstrated for murine and human models. (CE) RNase R-digested RNA (MRC-5 12 hpi) was reverse transcribed and PCR amplified with divergent primers. Amplicons were assessed via electrophoresis (TapeStation) or long-read sequencing (Oxford Nanopore Technology). The MAFFT consensus for circLAT was aligned to the expected BSJ sequence identified by CHARLIE, percent matching is reported. (F) RNase R protection assay for RNA from infected MRC-5 (12 hpi) or infected murine TG (4 wpi). cDNA samples were amplified with divergent (gray) or convergent (red) primers. Values are delta Ct (RNase R - Mock Ct), data points are biological replicates (n = 4) and horizontal lines are the average.
Figure EV2
Figure EV2. Prominent examples of herpesvirus circRNAs.
(AC) Visualization of high-confidence circRNAs for HSV-1, KSHV, and MHV68 in lytic models described in Fig. 1. If indicated, RNA samples were treated with RNase R. Viral genes are shown below. Data Information: RNA-Seq was performed and high-confidence circRNAs were called using CHARLIE. Sashimi plots show high-confidence circRNA with arcs proportional to raw BSJ counts. Blue and black traces include circular (back-spliced reads) and linear (non-chimeric) reads, respectively. Traces are the sum of raw BSJ or linear read values for all biological replicates. Y axis minimum and maximum values are shown on the right.
Figure EV3
Figure EV3. Herpesvirus circRNA copy levels and in silico interaction networks.
(A) Copy level quantitation of viral circRNAs (n = 3–4). RNA was collected from the models described in Fig. 1. cDNA was quantified using digital droplet PCR (ddPCR) and convergent (linear transcripts) or divergent (circular transcripts) primers. Data is normalized to the total amount of RNA in the reverse transcription reaction and plotted as copies per μg total RNA. (B) In silico circRNA–miRNA-mRNA interaction networks for circLAT (HSV-1), circK12 (KSHV), and circORF66 (MHV68) variants highlighted in Fig. 1C, D. (C) Putative downstream mRNA targets were used to perform overrepresentation analysis. Pathway hits, mRNA targets present, and p values are given. Data Information: In column bar graphs, data points are biological replicates, bar maxima are the average, error bars are standard deviation. Ingenuity Pathway Analysis (IPA) core analysis P values are calculated using a Fisher’s Exact Test.
Figure EV4
Figure EV4. Viral circRNAs are refractory to RNA lariat debranching enzyme depletion.
(A, C, D, G, I, K) MRC-5 were transfected with siRNAs targeting RNA lariat debranching enzyme (DBR1) or a nontargeting control (NTC) for 2 days. MRC-5 were mock (Uninf.) or HSV-1 infected for an additional 12 h. (B, E, F, H, J, L) iSLK-BAC16 were transfected with siRNAs targeting DBR1 or a NTC for 24 h. Subsequently, cells were treated with vehicle (Unind.) or Dox and NaB for 72 h (72 h). (A, B) Protein expression was assessed by immunoblotting and quantified relative to a loading control (GAPDH). (C, F) Host transcripts were quantified by qPCR relative to the reference gene (18S). (GL). ddPCR quantitation using divergent (circRNA) or convergent (gene) primers. Data Information: In column bar graphs, data points are biological replicates (n = 2–3), bar maxima are the average, for n > 2 error bars are standard deviation. All data is relative a paired siNTC sample. If n ≥ 3, two-tailed paired t tests were performed, P values < 0.05 are labeled and not significant (ns) indicates P values ≥ 0.05. Source data are available online for this figure.
Figure EV5
Figure EV5. Quantitation of viral RNAs after RNA ligase depletion.
(AD) RNA-Seq data from infection models in Fig. 5. (A) RNA-Seq overview for all viral mapped reads (MR), as percent total reads (% Total). The number of unique BSJ variants and total BSJ counts is reported for high-confidence viral circRNAs. (B) Overlapping identity of high-confidence viral circRNAs, includes only BSJ with ≥10 reads per sample. (C, D) Visualization of high-confidence HSV-1 and KSHV circRNAs. Green and black traces include circular (back-spliced reads) and linear (non-chimeric) reads, respectively. Traces are the sum of raw BSJ or linear read values for biological duplicates. Y axis minimum and maximum values are shown on the right. Viral genes are shown below and labeled by gene class as IE (yellow), E (green), L1 (blue), and L2 (purple). Data Information: RNA-Seq (n = 2) was performed and high-confidence circRNAs were called using CHARLIE. In column bar graphs, data points are biological replicates, and bar maxima are the average.

References

    1. Abere B, Zhou H, Li J, Cao S, Toptan T, Grundhoff A, Fischer N, Moore PS, Chang Y, Racaniello VR (2020) Merkel cell polyomavirus encodes circular RNAs (circRNAs) enabling a dynamic circRNA/microRNA/mRNA regulatory network. mBio 11:e03059–03020 - PMC - PubMed
    1. Afgan E, Baker D, Batut B, van den Beek M, Bouvier D, Čech M, Chilton J, Clements D, Coraor N, Grüning BA et al (2018) The Galaxy platform for accessible, reproducible and collaborative biomedical analyses: 2018 update. Nucleic Acids Res 46:W537–W544 - PMC - PubMed
    1. Alwine JC, Steinhart WL, Hill CW (1974) Transcription of herpes simplex type 1 DNA in nuclei isolated from infected HEp-2 and KB cells. Virology 60:302–307 - PubMed
    1. Arias C, Weisburd B, Stern-Ginossar N, Mercier A, Madrid AS, Bellare P, Holdorf M, Weissman JS, Ganem D (2014) KSHV 2.0: a comprehensive annotation of the Kaposi’s sarcoma-associated herpesvirus genome using next-generation sequencing reveals novel genomic and functional features. PLoS Pathog 10:e1003847 - PMC - PubMed
    1. Ashwal-Fluss R, Meyer M, Pamudurti Nagarjuna R, Ivanov A, Bartok O, Hanan M, Evantal N, Memczak S, Rajewsky N, Kadener S (2014) circRNA biogenesis competes with pre-mRNA splicing. Mol Cell 56:55–66 - PubMed

LinkOut - more resources