. 2025 May;35(5):345-361.
doi: 10.1038/s41422-025-01080-0. Epub 2025 Mar 4.

SETD1B-mediated broad H3K4me3 controls proper temporal patterns of gene expression critical for spermatid development

Affiliations

SETD1B-mediated broad H3K4me3 controls proper temporal patterns of gene expression critical for spermatid development

Zhen Lin et al. Cell Res. 2025 May.

Abstract

Epigenetic programming governs cell fate determination during development through intricately controlling sequential gene activation and repression. Although H3K4me3 is widely recognized as a hallmark of gene activation, its role in modulating transcription output and timing within a continuously developing system remains poorly understood. In this study, we provide a detailed characterization of the epigenomic landscapes in developing male germ cells. We identified thousands of spermatid-specific broad H3K4me3 domains regulated by the SETD1B-RFX2 axis, representing a previously underappreciated form of H3K4me3. These domains, overlapping with H3K27ac-marked enhancers and promoters, play critical roles in orchestrating robust transcription and accurate temporal control of gene expression. Mechanistically, these broad H3K4me3 compete effectively with regular H3K4me3 for transcriptional machinery, thereby ensuring robust levels and precise timing of master gene expression in mouse spermiogenesis. Disruption of this mechanism compromises the accuracy of transcription dosage and timing, ultimately impairing spermiogenesis. Additionally, we unveil remarkable changes in the distribution of heterochromatin marks, including H3K27me3 and H3K9me2, during the mitosis-to-meiosis transition and completion of meiotic recombination, which closely correlates with gene silencing. This work underscores the highly orchestrated epigenetic regulation in spermatogenesis, highlighting the previously unrecognized role of Setd1b in the formation of broad H3K4me3 domains and transcriptional control, and provides an invaluable resource for future studies toward the elucidation of spermatogenesis.


Conflict of interest statement

Competing interests: Fei Lan is a scientific co-founder and stockholder of Active Motif Shanghai, Inc. and Alternative Bio, Inc. All other authors declare no competing interests.

Figures

Fig. 1
Fig. 1. Establishment of a comprehensive chromatin epigenomic atlas during mouse spermatogenesis.
a Schematic workflow showing the 11 subtypes of synchronized mouse spermatogenic cells isolated. These include mitotic stages (Undiff: undifferentiated spermatogonia, A1: type A1 spermatogonia, B: type B spermatogonia), meiotic stages (pL: preleptotene spermatocytes, L: leptotene spermatocytes, Z: zygotene spermatocytes, D: diplotene spermatocytes) and spermiogenesis stages (RS2: steps 1–2 round spermatids, RS4: steps 3–4 round spermatids, RS8: steps 7–8 round spermatids). Genome-wide landscapes of seven histone marks, nucleosome positioning and DNAme were profiled in the 11 subtypes by ChIP-seq and NOMe-seq, respectively. The transcriptome was established by RNA-seq. b Snapshots of UCSC genome browser showing RNA-seq, histone marks, DNA methylation, and chromatin accessibility at B (upper panels) and RS4 (middle panels) stages, and H3K4me3 at 11 different stages (lower panels) during mouse spermatogenesis at the Sohlh2 and Ttll4 gene loci. c Quantification representation of ChIP-seq peak numbers for seven histone modifications in 11 stages during mouse spermatogenesis. d Western blot analyses showing the global levels of histone marks during mouse spermatogenesis. H3 was used as the internal control. e Emission probabilities for histone modifications in 15 ChromHMM chromatin states, with a descriptive title of each chromatin state shown on the right. Active promoters are proximal to TSS, marked by hyper H3K4me3 and H3K27ac. Active enhancers, enriched in H3K27ac and H3K4me1, are distal from the TSS. Transcriptional elongation signatures were decorated with H3K36me3. Heterochromatin regions are typically associated with H3K9me2, H3K9me3, or H3K27me3 but lack active marks. The no signal (Ns) state is characterized by the absence of any histone modification. f Average chromatin accessibility on different chromatin states (Promoter and Enhancer) at RS4 stage. g Chromatin state profiles at the gene loci of Zbtb16, Sohlh1, Dmc1 and Acr across 11 different stages. Pr, promoter; En, enhancer; Tr, transcription; Hc, heterochromatin. h Stacked chart showing the genomic coverage of 4 promoter-related chromatin states. i Radar charts showing the fraction of variable bases across different stages (left panel) and distinct chromatin states (right panel). Points on the lines in both radar charts represent the median values of the fraction of variable bases.
Fig. 2
Fig. 2. Dynamics of repressive histone marks during mouse spermatogenesis.
a Snapshots of the UCSC genome browser showing the normalized ChIP-seq read densities of H3K9me2, H3K9me3, and H3K27me3 in a representative genomic region containing Oprk1 and Npbwr1 genes. Areas between H3K9me3 peaks are highlighted in light red to indicate increased H3K9me2 enrichment specifically from B to Z stages. Promoter regions, highlighted with yellow shading, are modified by H3K27me3 at various stages, excluding B to Z stages. Right panel shows a magnified view of dashed framed regions for H3K9me2 and H3K9me3 patterns in the indicated stages. SINE, LINE, and LTR elements are shown as black squares. b The numbers of H3K9me2, H3K9me3 and H3K27me3 ChIP-seq peaks at 11 stages of mouse spermatogenesis. c, d Metagene profiles showing the ChIP-seq normalized read densities of H3K9me2 on genes that are expressed (c) and repressive (d) from B to Z stages. e Alluvial plot showing the temporal dynamics of bivalent domains during mouse spermatogenesis. Each line in the plot represents a bivalent gene, and the total regions shown are those classified as bivalent genes in at least one of the analyzed stages. f Boxplot illustrating the expression levels of bivalent genes that underwent a loss of H3K27me3 modifications during the transition from A1 to B stages. g Snapshots of the UCSC genome browser showing the normalized ChIP-seq read densities of H3K4me3, H3K27me3, and H3K9me2 at A1 and pL stages on a representative bivalent gene, Fzd5. h Snapshots of the UCSC genome browser showing the normalized ChIP-seq read densities of H3K4me3 and H3K27me3 at RS8 and mature sperm stages over three representative bivalent gene loci, indicating the retained and lost bivalent states during the progression from RS8 stage to mature sperm.
Fig. 3
Fig. 3. Dynamic changes in broad H3K4me3 and H3K27ac domains during spermiogenesis.
a Snapshots of the UCSC genome browser showing the normalized ChIP-seq read densities of H3K4me3 (red) and H3K27ac (blue) at the Crem gene locus during mouse spermatogenesis. Regions shaded in pink highlight two broad H3K4me3 and H3K27ac peaks at the distal (left) and promoter (right) regions of the Crem gene, emphasizing the broad enrichment pattern of H3K4me3 and H3K27ac at the RS stages. b Heatmaps showing the normalized ChIP-seq read densities of H3K4me3 (red, upper panel) or H3K27ac (blue, lower panel) during mouse spermatogenesis on all broad H3K4me3 or H3K27ac peaks identified at the RS stages. c Stacked chart showing the numbers of broad H3K4me3 peaks (upper panel) from undifferentiated spermatogonia (Undiff) to mature sperm and H3K27ac peaks (lower panel) from Undiff to RS8 on promoter and distal regions. The broad peaks are defined as ChIP-seq peaks exceeding 5 kb in length. The promoter regions are defined as ± 2 kb from the TSS, and the distal regions are defined as the genomic regions beyond ± 2 kb from the TSS. LS denotes elongating spermatid steps 10–12, and sperm denotes the mature sperm stage. d Stacked chart showing the number of broad H3K4me3 peaks in RS4 compared to a range of indicated cell types. These include diverse mouse and human cell lines, CD4+ T cells, and early embryonic cells. e Heatmaps showing the normalized ChIP-seq read densities of H3K4me3 (red, left panel) and H3K27ac (blue, right panel) in human pachytene/diplotene (P/D) and/or RS. The visualization encompasses all broad H3K4me3 or H3K27ac peaks identified in human RSs. f Venn diagrams showing the overlap between H3K4me3-based SEs (super H3K4me3) and H3K27ac-based SEs identified by ROSE in mouse RSs. g Venn diagrams showing the overlap among H3K4me3-based SEs, H3K27ac-based SEs and broad H3K4me3 peaks.
Fig. 4
Fig. 4. Spermatid-specific broad H3K4me3 domains are coupled to transcriptional potentials of key genes for spermiogenesis.
a Boxplot showing the expression levels of target genes associated with broad, sharp, and control H3K4me3 peaks at the RS4 stage of mouse spermatogenesis. ***P < 0.001. b Functional enrichment analysis of broad H3K4me3 marked genes in mouse spermatids utilizing GREAT to infer potential functional pathways and associated biological processes. c, d Heatmaps showing the RNA expression levels (c) and broad H3K4me3 intensities (d) of RS broad H3K4me3-marked genes throughout mouse spermatogenesis. Genes are sorted based on the peak expression timing, progressing from early to late stages. e Transcription factor-binding motifs enriched within broad H3K4me3 domains in mouse RSs. f Boxplots showing the expression levels of enhancer RNAs in RSs across three categories: broad H3K4me3 domains that overlap with SEs (BroadSE+), broad H3K4me3 domains without overlapping with SEs (BroadSE–), and typical enhancers (Ens). g Transcription factor-binding motifs enriched within broad H3K4me3 domains in human RSs.
Fig. 5
Fig. 5. SETD1B is responsible for the establishment of broad H3K4me3 domain during spermiogenesis.
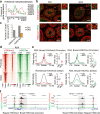
a Line chart showing the gene expression profiles of seven H3K4me3 methyltransferases across 11 stages of mouse spermatogenesis, determined by RNA-seq. b Immunofluorescent (IF) staining for H3K4me3 (red, upper panel) or H3K4me1 (red, lower panel) in sections of adult control and Setd1b cKO testes. Acrosome marker peanut lectin (PNA, green) was co-stained to determine the specific stages of the seminiferous epithelium. Magnified views of dashed framed regions were shown on the right side of each image. Scale bars, 100 μm. c Bar plot showing the numbers of broad H3K4me3 and broad H3K27ac domains identified at the RS4 stage of RSs in control and Setd1b cKO mice. d Heatmaps showing the normalized read densities of H3K4me3 (red, left panel) and H3K27ac (green, right panel) across all broad H3K4me3 and H3K27ac domains identified at the RS4 stage of RSs in both control and Setd1b cKO mice. Broad domains are categorized into promoter and distal groups based on their genomic locations. e Metagene profile plots showing the averaged ChIP-seq read densities of H3K4me3 and H3K27ac on promoter (upper) and distal (lower) broad H3K4me3 (left) and H3K27ac (right) peaks identified at the RS4 stage of RSs in both control and Setd1b cKO mice. Box plots in the right panel show the width of peaks. f Snapshot of the UCSC genome browser showing the normalized ChIP-seq read densities of H3K4me3 and H3K27ac at the Rpl22 locus (regular H3K4me3 peak), Chd5 locus (promoter broad H3K4me3 peak), and Tdrd7 locus (regular and distal broad H3K4me3 peaks) at the RS4 stage in control and Setd1b cKO mice. Broad and regular H3K4me3 peaks were shaded in grey color.
Fig. 6
Fig. 6. SETD1B deficiency leads to Pol II redistribution and transcriptional dysregulation.
a Snapshots of the UCSC genome browser showing the normalized ChIP-seq read densities of H3K4me3 across various stages of RSs, along with TAF3 and RNA Pol II read densities from wild-type control and Setd1b cKO bulk RS samples, over the Catsper1 (a broad H3K4me3 target) and Nectin2 (a regular H3K4me3 target) gene loci. Blue shading highlights regions with broad H3K4me3 (left panel) and regular H3K4me3 (right panel) peaks. b MA plots showing changes in RNA Pol II enrichment at the promoter regions of broad H3K4me3 (upper panel) or regular H3K4me3 (lower panel) marked genes following Setd1b depletion. The numbers of broad H3K4me3 targets with decreased Pol II occupancy (loss) and regular H3K4me3 targets with increased Pol II occupancy (gain) are indicated. c Heatmap showing changes in RNA Pol II and TAF3 enrichment on 1341 broad H3K4me3 marked genes exhibiting decreased Pol II occupancy (loss) and 487 regular H3K4me3 marked genes displaying increased Pol II occupancy (gain). The corresponding H3K4me3 enrichment pattern in those regions in wild-type RSs is depicted on the left. d Volcano plot showing differential gene expression between control and Setd1b cKO bulk RSs for broad H3K4me3-marked genes (upper panel) and regular H3K4me3-marked genes (lower panel). Significant differential expression was defined by a threshold of a Log2 FC ≥ 0.5 or ≤ –0.5, coupled with an adjusted P < 0.05. e Metagene profile plots showing the normalized ChIP-seq read densities of RNA Pol II for down-regulated broad H3K4me3-marked genes and up-regulated regular H3K4me3-marked genes when comparing Setd1b cKO and control bulk RS. f GO analysis for down- and up-regulated genes in bulk RSs when comparing Setd1bcKO and control mice. g Model of SETD1B-mediated broad H3K4me3 regulating gene expression through promoting Pol II occupancy.
Fig. 7
Fig. 7. SETD1B-mediated broad H3K4me3 ensures accurate expression timing of stage-specific genes and spermatid development.
a Line plots depicting the expression dynamics of representative early-stage genes (left panel) and late-stage genes (right panel) marked by broad H3K4me3, observed across RS4, RS8, and LS stages in both control and Setd1b cKO mice. b Snapshots of the UCSC genome browser showing the normalized ChIP-seq read densities of H3K4me3 across various spermatid stages from wild-type mice, along with normalized RNA Pol II read density in RS4, RS8 and LS stages from wild-type control and Setd1b cKO mice, over the Radil (an early-stage broad H3K4me3 target) and Decr2 (a late-stage regular H3K4me3 target) gene loci. Blue shading highlights the H3K4me3-covered genomic regions. c Classification of broad H3K4me3 target genes based on their peak expression timing: early (RS2 & RS4) vs late (RS8 & LS10) stages (left panel). Corresponding H3K4me3 read densities for early-stage and late-stage genes are displayed in the right panel. d Heatmap showing the variation in RNA Pol II enrichment on early-stage and late-stage broad H3K4me3 marked genes across RS4, RS8 and LS10 stages. e Heatmap showing the variation in gene expression on early-stage and late-stage broad H3K4me3-marked genes across RS4, RS8 and LS10 stages. f Multiple line charts showing the variation in gene expression on early-stage and late-stage broad H3K4me3-marked genes across RS4, RS8 and LS10 stages. g Models of SETD1B-mediated broad H3K4me3 in regulating stage-specific temporal gene expression during spermiogenesis. h H&E staining of wild-type control and Setd1b cKO testes (upper panel) or epididymis (lower panel) sections from 8-week-old mice. Scale bars, 100 µm. i Number, total, and progressive motility of caudal epididymal sperm from adult control and Setd1b cKO mice. Data are presented as mean ± SD, ***P < 0.001, **P < 0.01, Student’s t-test (n = 3). j Fluorescence staining of caudal epididymal sperm from control and Setd1b cKO mutant with fluorescence dye-labeled peanut lectin (PNA, red) for acrosome, MitoTracker Green FM (green) for mitochondria, and DAPI (blue), respectively (left panel). Stacked chart showing the proportion of sperm with normal or abnormal head morphology from control and Setd1b cKO mice (right panel).

References

    1. Clermont, Y. Kinetics of spermatogenesis in mammals: seminiferous epithelium cycle and spermatogonial renewal. Physiol. Rev.52, 198–236 (1972). - PubMed
    1. Griswold, M. D. Spermatogenesis: the commitment to meiosis. Physiol. Rev.96, 1–17 (2016). - PMC - PubMed
    1. Soumillon, M. et al. Cellular source and mechanisms of high transcriptome complexity in the mammalian testis. Cell Rep.3, 2179–2190 (2013). - PubMed
    1. Chen, Y. et al. Single-cell RNA-seq uncovers dynamic processes and critical regulators in mouse spermatogenesis. Cell Res.28, 879–896 (2018). - PMC - PubMed
    1. Kistler, W. S. et al. RFX2 is a major transcriptional regulator of spermiogenesis. PLoS Genet.11, e1005368 (2015). - PMC - PubMed

LinkOut - more resources