. 2025 May;22(5):485-500.
doi: 10.1038/s41423-025-01262-1. Epub 2025 Mar 4.

Cholesterol homeostasis and lipid raft dynamics at the basis of tumor-induced immune dysfunction in chronic lymphocytic leukemia

Affiliations

Cholesterol homeostasis and lipid raft dynamics at the basis of tumor-induced immune dysfunction in chronic lymphocytic leukemia

Chaja F Jacobs et al. Cell Mol Immunol. 2025 May.

Abstract

Autologous T-cell therapies show limited efficacy in chronic lymphocytic leukemia (CLL), where acquired immune dysfunction prevails. In CLL, disturbed mitochondrial metabolism has been linked to defective T-cell activation and proliferation. Recent research suggests that lipid metabolism regulates mitochondrial function and differentiation in T cells, yet its role in CLL remains unexplored. This comprehensive study compares T-cell lipid metabolism in CLL patients and healthy donors, revealing critical dependence on exogenous cholesterol for human T-cell expansion following TCR-mediated activation. Using multi-omics and functional assays, we found that T cells present in viably frozen samples of patients with CLL (CLL T cells) showed impaired adaptation to cholesterol deprivation and inadequate upregulation of key lipid metabolism transcription factors. CLL T cells exhibited altered lipid storage, with increased triacylglycerols and decreased cholesterol, and inefficient fatty acid oxidation (FAO). Functional consequences of reduced FAO in T cells were studied using samples from patients with inherent FAO disorders. Reduced FAO was associated with lower T-cell activation but did not affect proliferation. This implicates low cholesterol levels as a primary factor limiting T-cell proliferation in CLL. CLL T cells displayed fewer and less clustered lipid rafts, potentially explaining the impaired immune synapse formation observed in these patients. Our findings highlight significant disruptions in lipid metabolism as drivers of functional deficiencies in CLL T cells, underscoring the pivotal role of cholesterol in T-cell proliferation. This study suggests that modulating cholesterol metabolism could enhance T-cell function in CLL, presenting novel immunotherapeutic approaches to improve outcome in this challenging disease.

Keywords: Cholesterol; Immunotherapy; Leukemia; Lipid metabolism; T-cell.


Conflict of interest statement

Competing interests: The authors declare no competing interests.

Figures
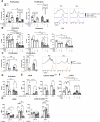
Fig. 1
Fig. 1
Extracellular cholesterol import is required for T-cell proliferation and is decreased in T cells from CLL patients. A PBMCs from healthy donors (HD) and chronic lymphocytic leukemia (CLL) patients were labeled with cell-trace violet (CTV) and stimulated with αCD3/αCD28 antibodies for 5 days under complete serum conditions, lipid deprivation (lipoprotein-deficient serum, LPDS) and LPDS supplemented with LDL. Proliferation of CD4+ T cells was measured as percentage divided cells (left) and division index (average number of cell divisions that a cell in the original population has undergone; right). Representative CTV histograms are shown (complete serum: black, LPDS: blue, and LPDS+ LDL: purple). B Expression of CD25, CD71 and IL-2 (intracellularly, after 4 h of Brefeldin treatment) was measured on CD4+ HD and CLL T cells after 2 days of stimulation in the same experimental conditions as in (A). C PBMCs from HD and CLL patients were stimulated with αCD3/αCD28 antibodies for 5 days in the presence or absence of the NPC1 inhibitor U18666A (10 µM). Proliferation of CD4+ T cells is shown as percentage divided cells (left) and division index (right). Representative CTV histograms are shown (αCD3/αCD28 only: black, αCD3/αCD28 + U1866A: orange). D Expression of CD25 was measured after 2 days of stimulation in the same experimental conditions as in (C). E Expression of LDLR was measured on CD4+ HD and CLL T cells after a 2-day stimulation with αCD3/αCD28 antibodies in total CD4+ T cells (left) and within CD4+ CD25high T cells (right). F expression of LDLR was measured on CD4+ HD and CLL T cells in the same experimental conditions as in (B). G LDLR expression was measured on day 2 and day 5 upon PBMC stimulation in the presence or absence of the NPC1 inhibitor U18666A (10 µM) on CD4+ T cells (left) and within CD4+ CD25high T cells (right). Data are presented as mean ± SEM and differences were analyzed with two-way repeated measures ANOVA with Tukey’s/Šidák’s multiple comparison test (AE (left), F, G) or t-test (E (right)). **** = p < 0.0001; *** = p < 0.001; ** = p < 0.01; * = p < 0.05
Fig. 2
Fig. 2
Key transcriptional programs governing lipid metabolism are downregulated in CLL T cells. CD4+ and CD8+ T cells of HD and CLL patients were FACS-sorted and subjected to RNA sequencing, either (A, B) at baseline or (CF) after a 2-day stimulation with αCD3/αCD28 antibodies. To specifically analyze the main transcription factor families regulating lipid metabolism and their targets, a list of 452 genes was compiled using publicly available gene sets (Supplemental Table 3). Expression of these genes is visualized in volcano plots and heatmaps. A, C In the volcano plots, differentially expressed genes between CLL and HD T cells (padj. ≤ 0.05) are depicted in black dots and, among them, specific genes of interest are highlighted in blue (downregulated in CLL) or red (upregulated in CLL). B, D Heatmaps showing Z-scores of the significantly differentially expressed genes between the two groups (padj. < 0.05). Genes of interest are highlighted in bold. E Heatmap of the expression of differentially expressed SREBP1, SREBP2, PPARα, PPARγ, and LXR target genes in CLL compared to HD T cells (padj. ≤ 0.05) after a 2-day stimulation with αCD3/αCD28 antibodies. Genes of interest are highlighted in bold. Boxplots showing DESeq2 normalized counts of SREBF1, SREBF2, PPARA, PPARG, and NIH13 in CLL and HD T cells after a 2-day stimulation. Differences in (F) were analyzed with Mann–Whitney test. * = p < 0.05
Fig. 3
Fig. 3
Essential lipid metabolism proteins are downregulated in CLL T cells, which portrays increased dependency on de novo cholesterol biogenesis. A Levels of FASN and SCD were measured on CD4+ T cells from HD and CLL patients at baseline, B after a 2-day stimulation with αCD3/αCD28, and C within CD4+ CD25high T cells by flow cytometry. D Expression of PPARα and PPARγ was measured on CD4+ T cells from HD and CLL patients at baseline, E after a 2-day stimulation with αCD3/αCD28, and F within CD4+ CD25high T cells. G Expression of CPT1α was measured on CD4+ T cells from HD and CLL patients after a 2-day stimulation with αCD3/αCD28. H PBMCs from HD and CLL patients were labeled with CTV and stimulated with αCD3/αCD28 antibodies for 5 days in the presence or absence of the squalene inhibitor NB598 (10 µM) or Simvastatin (10 µM). Proliferation of CD4+ T cells is shown as percentage divided cells (left) and division index (right). I PBMCs from HD and CLL patients were labeled with CTV and stimulated with αCD3/αCD28 antibodies for 5 days in the presence or absence of the LXR agonist GW3695 (1 µM). Proliferation of CD4+ T cells is shown as percentage divided cells (left) and division index (right). J Expression of SCD at day 2 was measured under the same experimental conditions as in (I). Data are presented as mean ± SEM and differences were analyzed with t-tests (A, C, D, F) or two-way repeated measures ANOVA with Tukey’s/Šidák’s multiple comparison test (B, E, G, H, I, J). **** = p < 0.0001; *** = p < 0.001; ** = p < 0.01; * = p < 0.05
Fig. 4
Fig. 4
The organization of lipids in the cytoplasm is different in T cells from CLL patients compared to HD. A PBMCs from HD and CLL patients were stimulated with αCD3/αCD28 antibodies for 2 days. Neutral lipid accumulation was quantified using BodipyTM493/503 staining by flow cytometry on CD4+ T cells. Raw gMFI values were normalized to unstimulated HD samples in each independent experiment. B Upon culturing in the same experimental conditions as in (A), samples were subjected to CD19 MACS depletion and immunofluorescence was performed, first staining with BodipyTM493/503 and then with antibodies against CD4+ and CD8+ (both conjugated to AF549). DAPI was used as nuclear staining. Samples were imaged with confocal microscopy. Representative images of a stimulated HD and CLL sample are shown. C Upon culturing in the same experimental conditions as in (A), immunofluorescence was performed, first staining with BodipyTM493/503 and then with antibodies against CD4+ and CD8+ (both conjugated to AF549) and PLIN2 (unconjugated). A secondary antibody goat anti-mouse conjugated to AF647 was used to detect PLIN2, and DAPI was used as nuclear staining. Regions of interest (ROI) were manually selected based on BodipyTM493/503. Fluorescence intensity of BodipyTM493/503 and PLIN2 was quantified in ImageJ as gray values throughout each ROI and plotted in spatial plots to assess co-occurrence in a cross-sectional ROI. Representative images with ROIs highlighted in yellow are provided (left). Representative spatial plots of fluorescence intensity from a stimulated HD and CLL samples are shown (right). D In each ROI, the 50 pixels with the highest BodipyTM493/503 fluorescence were selected. Intensity of BodipyTM493/503 and PLIN2 within the same pixel were plotted against each other and correlation was calculated. Data from all ROIs analyzed in stimulated cells are shown. Every dot represents one pixel and every color corresponds to one ROI. E The percentage of T cells with significant positive correlation between BodipyTM493/503 and PLIN2 was calculated in each condition (p < 0.05). Data are presented as mean ± SEM (A) and differences were analyzed with two-way repeated measures ANOVA with Tukey’s/Šidák’s multiple comparison test (A) or linear regression analysis (D). **** = p < 0.0001; * = p < 0.05
Fig. 5
Fig. 5
The lipidome of CLL T cells is characterized by low cholesterol and phospholipids, and accumulation of triglycerides, compared to healthy T cells. CD4+ and CD8+ T cells of HD and CLL patients were FACS-sorted and subjected to liquid chromatography-mass spectrometry (LC-MS)-based lipidomics (A) at baseline or (B) after 2-day stimulation with αCD3/αCD28 antibodies. Abundance of each lipid molecule was normalized by internal standards and protein amount (A) or total lipidome pool (B). Results are visualized as principal component analysis plots, volcano plots, and heatmaps of differentially abundant lipid species. In the volcano plots, the three horizontal dotted lines indicate p values of 0.05, 0.01, and 0.001, respectively. The two vertical dotted lines indicate log2 (fold change) of −2 and 2, respectively. Lipid molecules with significantly different abundance in CLL T cells compared to HD T cells (p ≤ 0.01) are colored according to the lipid class they belong to. For heatmap representation of lipidomics data, a cutoff for variable importance in projection (VIP) score >1 from all lipid molecules analyzed was defined. Abundance of the different lipid classes relative to the total lipids sum is shown in Supplementary Fig. 5A, B. C Relative abundance of triacylglycerols and cholesterol esters after a 2-day stimulation with αCD3/αCD28 antibodies is plotted separately. D PBMC from HD and CLL patients were stimulated for 2 days with αCD3/αCD28 antibodies and protein levels of ATGL were measured. E FAO was assessed by flow cytometry on CD4+ T cells by FAOBlue in the same experimental conditions as in (D). F Abundance of acylcarnitines after a 2-day stimulation with αCD3/αCD28 antibodies is plotted separately. Data are presented as mean ± SEM (CF) and differences were analyzed with t-test (C) or two-way repeated measures ANOVA with Tukey’s/Šidák’s multiple comparison test (DF). **** = p < 0.0001; *** = p < 0.001; ** = p < 0.01; * = p < 0.05. PC phosphatidylcholine, PC[O] alkylphosphatidylcholine, PC[P] alkenylphosphatidylcholine, PC[O + P] alkyl/alkenylphosphatidylcholine, LPC lysophosphatidylcholine, LPC[O] alkyllysophosphatidylcholine, LPC[P] alkenyllysophosphatidylcholine, LPC[O + P] alkyl/alkenyllysophosphatidylcholine, PE phosphatidylethanolamine, PE[P] alkenylphosphatidylethanolamine, PE[O] alkylphosphatidylethanolamine, PE[O + P] alkyl/alkenylphosphatidylethanolamine, LPE lysophosphatidylethanolamine, LPE[P] alkyllysophosphatidylethanolamine, LPE[O + P] alkyl/alkenyllysophosphatidylethanolamine, PI phosphatidylinostiol, BMP bis(monoacylglycero)phosphate, PG phosphatidyglycerol, PS phosphatidylserine, CL cardiolipin, SM[d] sphingomyeline, SM[t] hydroxysphingomyeline, SPH[d] sphingosine, GM3 monosialdihexosylganglioside, Cer[d] ceramide, HexCer[d] hexosylceramide, Hex2Cer[d] dihexosylceramide AC acylcarnitine, TAG triacylglycerol, TAG[O] alkyltriacylglycerol, DAG diacylglycerol, CE cholesterol ester, FA fatty acid
Fig. 6
Fig. 6
Defective FAO leads to delayed T-cell activation, but does not affect proliferation. PBMCs from HD, CLL patients and patients with genetic FAO defects (FAO Mut) were stimulated for 2 or 5 days with αCD3/αCD28 antibodies. Patients with HADHA, CPT1A, and CPT2 mutations are indicated with circles, squares, and triangles, respectively. A FAO was evaluated in CD4+ T cells at day 2 by using FAOBlue, and fold change of intensity was calculated by dividing the fluorescence intensity of the stimulated samples by that of the matched unstimulated samples in all groups. B Expression of CD25 on CD4+ T cells was measured on days 2 and 5. C Proliferation was measured at day 5 and is represented by percentage of divided cells (left) and division index (middle). Representative CTV histograms are shown (right); HD (black), CLL (gray), and FAO Mut (orange). Data are presented as mean ± SEM and differences were analyzed with two-way repeated measures ANOVA with Tukey’s/Šidák’s multiple comparison test. *** = p < 0.001; ** = p < 0.01; * = p < 0.05
Fig. 7
Fig. 7
CLL T cells have altered membrane organization and disorganized lipid raft formation. A PBMCs from HD and CLL patients were stimulated with αCD3/αCD28 antibodies for 2 days. Immunofluorescence to assess the localization of lipid rafts on T cells was performed by staining samples with AF448-conjugated choleratoxin-B (CT-B), followed by incubation with AF594-conjugated antibodies against CD4 and CD8. DAPI was used as nuclear staining. Representative images of each experimental condition analyzed are shown (left). A schematic overview of lipid rafts localized around the T-cell receptor (TCR) in stimulated T cells and CT-B binding is provided (right). B CT-B intensity was quantified and plotted as total abundance (mean fluorescence, left) and clustering (maximal fluorescence, right) in HD and CLL T cells. Each dot represents the average value of CT-B fluorescence from all T cells in one field. C PBMCs from HD and CLL patients were either preincubated for 1 h with 2 mM methyl-β-cyclodextrin (MBCD), prior to a 2-day T-cell stimulation with αCD3/αCD28 antibodies in the continued presence of MBCD, or stimulated without MBCD present. Expression of CD25, CD69, and CD38 was measured on HD and CLL CD4+ T cells. D PBMCs from HD and CLL patients were stimulated with αCD3/αCD28 antibodies for 5 days in the same experimental conditions as in (C). Proliferation of CD4+ T cells is shown as percentage divided cells (left) and division index (right). Data are presented as mean ± SEM and differences were analyzed with two-way repeated measures ANOVA with Tukey’/Šidák’s s multiple comparison test (B) or with paired t-test (C, D). **** = p < 0.0001; *** = p < 0.001; ** = p < 0.01; * = p < 0.05

References

    1. Niemann CU, Munir T, Moreno C, Owen C, Follows GA, Benjamini O, et al. Fixed-duration ibrutinib–venetoclax versus chlorambucil–obinutuzumab in previously untreated chronic lymphocytic leukaemia (GLOW): 4-year follow-up from a multicentre, open-label, randomised, phase 3 trial. Lancet Oncol. 2023;24:1423–33. - PubMed
    1. Lew TE, Lin VS, Cliff ER, Blombery P, Thompson ER, Handunnetti SM, et al. Outcomes of patients with CLL sequentially resistant to both BCL2 and BTK inhibition. Blood Adv. 2021;5:4054–8. - PMC - PubMed
    1. Khan AN, Asija S, Pendhari J, Purwar R. CAR-T cell therapy in hematological malignancies: Where are we now and where are we heading for? Eur J Haematol. 2024;112:6–18. - PubMed
    1. Melenhorst JJ, Chen GM, Wang M, Porter DL, Chen C, Collins MA, et al. Decade-long leukaemia remissions with persistence of CD4+ CAR T cells. Nature. 2022;602:503–9. - PMC - PubMed
    1. Siddiqi T, Maloney DG, Kenderian SS, Brander DM, Dorritie K, Soumerai J. et al. Lisocabtagene Maraleucel (liso-cel) in R/R CLL/SLL: 24-month median follow-up of TRANSCEND CLL 004. Blood. 2023;142(Suppl 1):330.

LinkOut - more resources