. 2025 Jul;32(7):1213-1226.
doi: 10.1038/s41594-025-01509-5. Epub 2025 Mar 3.

ZBTB16/PLZF regulates juvenile spermatogonial stem cell development through an extensive transcription factor poising network

Affiliations

ZBTB16/PLZF regulates juvenile spermatogonial stem cell development through an extensive transcription factor poising network

Chongil Yi et al. Nat Struct Mol Biol. 2025 Jul.

Abstract

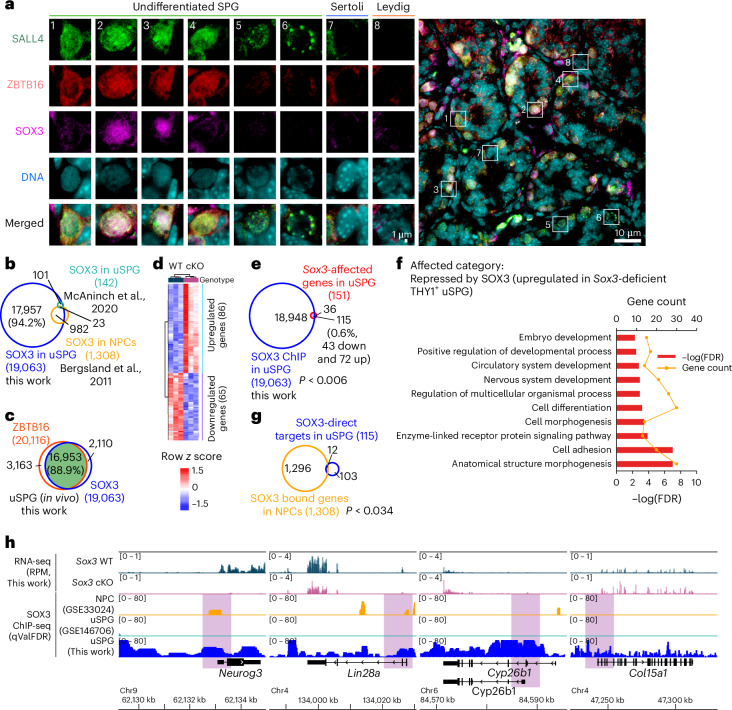
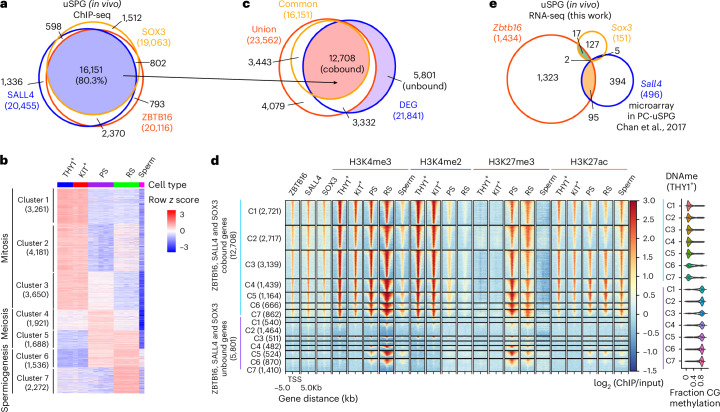
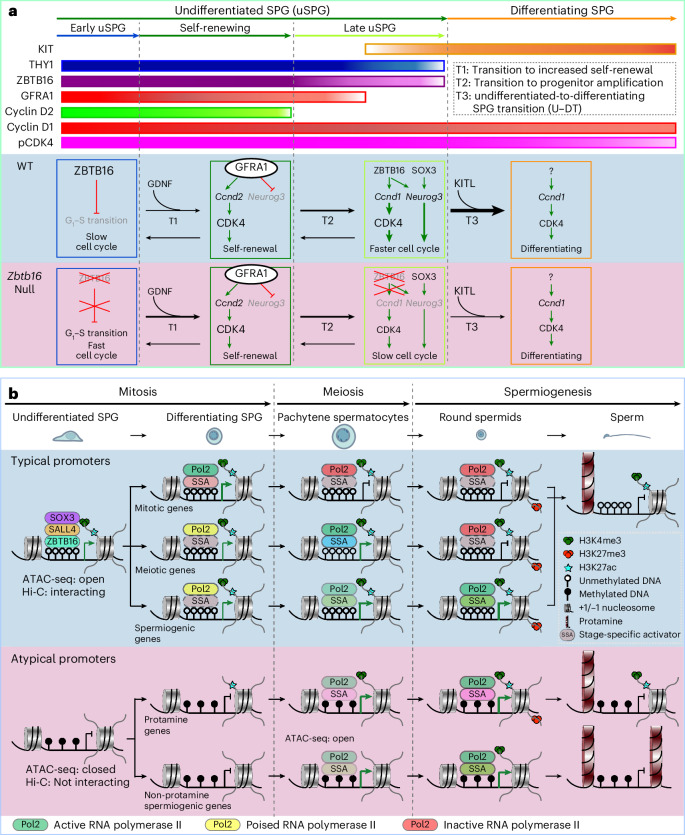
Spermatogonial stem cells balance self-renewal with differentiation and spermatogenesis to ensure continuous sperm production. Here, we identify roles for the transcription factor zinc finger and BTB domain-containing protein 16 (ZBTB16; also known as promyelocytic leukemia zinc finger (PLZF)) in juvenile mouse undifferentiated spermatogonia (uSPG) in promoting self-renewal and cell-cycle progression to maintain uSPG and transit-amplifying states. Notably, ZBTB16, Spalt-like transcription factor 4 (SALL4) and SRY-box transcription factor 3 (SOX3) colocalize at over 12,000 promoters regulating uSPG and meiosis. These regions largely share broad histone 3 methylation and acetylation (H3K4me3 and H3K27ac), DNA hypomethylation, RNA polymerase II (RNAPol2) and often CCCTC-binding factor (CTCF). Hi-C analyses show robust three-dimensional physical interactions among these cobound promoters, suggesting the existence of a transcription factor and higher-order active chromatin interaction network within uSPG that poises meiotic promoters for subsequent activation. Conversely, these factors do not notably occupy germline-specific promoters driving spermiogenesis, which instead lack promoter-promoter physical interactions and bear DNA hypermethylation, even when active. Overall, ZBTB16 promotes uSPG cell-cycle progression and colocalizes with SALL4, SOX3, CTCF and RNAPol2 to help establish an extensive and interactive chromatin poising network.


Conflict of interest statement

Competing interests: B.R.C. is a cofounder and chair of the scientific advisors of Paterna Biosciences. The other authors declare no competing interests.

Figures

Fig. 1
Fig. 1. Defining the gene targets of ZBTB16.
a, Summary of experiment flow. Testes were digested into single cells and THY1+ uSPG and KIT+ dSPG were isolated. b, Volcano plot depicting fold changes (log2) and P value (−10log10) of differential expression in Zbtb16-deficient THY1+ uSPG compared to WT. DEGs are defined by a fold change cutoff of >1.5 and an adjusted P value (derived from DESeq2 analysis) of <0.05. Points above the threshold represent significantly upregulated (red) or downregulated (sky blue) genes. Nonsignificant genes are shown in gray. Adjusted P values account for multiple comparisons using the Benjamini–Hochberg method. c, Left, pie chart illustrating the fraction of ZBTB16-bound sites within ±2 kb of the TSS of the closest RefSeq-annotated transcript. The number of ZBTB16-bound genes that were unaffected in RNA-seq of Zbtb16-null cells (gray) compared to those differentially expressed (pink). Right, pie chart partitioning the number of downregulated (sky blue) or upregulated (red) ZBTB16-bound genes with Zbtb16-affected genes from RNA-seq (analyzed as in b). Statistical analysis was performed using a hypergeometric test. d, GO terms for functional clustering of genes downregulated in Zbtb16-null cells associated with ZBTB16 ChIP-seq peaks (top ten categories are shown). e, GO terms for functional clustering of genes upregulated in Zbtb16-null cells associated with ZBTB16 ChIP-seq peaks. f,g, Gene targets of ZBTB16. Browser snapshots displaying genes downregulated (f; Zbtb16, T, Eomes and Fgfr1) or upregulated (g; Krt18, Sycp3, Cth and Rhox10) in the null cells. Shown are tracks for RNA-seq from purified THY1+ uSPG in WT and Zbtb16-null mouse testes at P7 and ZBTB16 ChIP-seq data using anti-rabbit ZBTB16 and anti-goat ZBTB16 antibodies (qValFDR). Source data
Fig. 2
Fig. 2. Relationships of ZBTB16 to chromatin modifications.
a, Models for gene regulation by ZBTB16. Left, histone modifier recruitment by ZBTB16. Right, post-translational modifications of ZBTB16. b, Venn diagram showing the overlap of ZBTB16-bound genes with H3K4me3 and H3K27me3 in THY1+ uSPG (this work). c, Venn diagram showing the overlap of ZBTB16-bound genes with H3K4me3 (this work) and H3K27ac (ref. ) in THY1+ uSPG. d,e, Heat map showing clustering of active and repressive histone modification at the TSS (±5 kb) of downregulated (d) or upregulated (e) genes in Zbtb16-null cells with DNAme and CpG islands. f,g, Genome browser panels showing ZBTB16 target genes, including genes downregulated (f; Neurog3, Jund and Gsta3) or upregulated (g; Nr5a2, Tdrd5 and D030018L15Rik) in the null cells, alongside chromatin marks H3K4me3 and H3K27me3 and DNAme. RPM, reads per million mapped reads. Source data
Fig. 3
Fig. 3. Fewer KIT+ dSPG and spermatocytes in Zbtb16-null testes.
a, Representative profile of FACS-sorted populations for THY1 (uSPG marker)-positive and/or KIT (dSPG marker)-positive cells from WT and null testicular cells at P7 for cell-cycle analysis (Fig. 3c). b, Box-and-whisker plot showing the percentage of THY1+/KIT, THY1+/KIT+ and THY1/KIT+ cell populations in the testes of Zbtb16-null and littermate control (WT or heterozygotes) mice at P7 (n = 3 per group; analyzed as in a). The center line represents the median, the box extends from the first to the third quartiles (IQR) and the whiskers extend to 1.5× the IQR. A diamond indicates the mean. Each dot represents an individual biological replicate. Statistical significance was determined using the Wilcoxon rank-sum test. c, Genome browser snapshot for Ccnd1. d, Bar charts showing cell-cycle analysis of each cell type, labeled THY1+/KIT, THY1+/KIT+ uSPG and THY1/KIT+ dSPG from null and littermate control (WT or heterozygotes) mice at P7 (n = 3, mean ± s.d.; as analyzed in a). Statistical significance was determined using the Wilcoxon rank-sum test. e, Pictures of WT and Zbtb16-null testes at P14. f, Box-and-whisker plot showing testes weights of WT and Zbtb16-null testes at P14 (n = 5 per group). The center line represents the median, the box extends from first to the third quartiles (IQR) and the whiskers extend to 1.5× the IQR. A diamond indicates the mean. Each dot represents an individual biological replicate. Statistical significance was determined using the Wilcoxon rank-sum test. g, Representative IF images showing accumulation of SPG and deficiency of spermatocytes in testis sections from Zbtb16-null mice at P14. SYCP3, green; LIN28A, red; pH2AX, magenta; DNA, cyan. White arrowheads indicate SYCP3/LIN28A+ uSPG. Yellow arrowheads indicate SYCP3/LIN28A+ dSPG. Arrows indicate SYCP3+/pH2AXXY body PSs. Scale bars, 10 µm. The experiment was repeated independently three times with similar results, using three biological replicates. h, Violin plots quantifying the number of SPG, PS, total spermatocytes and total cells per seminiferous tubule in WT and Zbtb16-null mice at P14 in g. A total of 300 circular tubules were counted for each genotype (n = 3 biological replicates). The center line represents the median, the black diamond represents the mean and the width reflects the data distribution. Statistical significance was determined using the Wilcoxon rank-sum test. i, Fewer tubules with PSs were present in Zbtb16-null mice at P14, as analyzed in g. Statistical significance was determined using the Wilcoxon rank-sum test. Source data
Fig. 4
Fig. 4. SOX3 promotes SPG differentiation.
a, Representative IF images showing ZBTB16, SALL4 and SOX3 expression patterns in testis sections from WT mice at P7. ZBTB16, green; SALL4, red; SOX3, magenta; DNA, cyan. Scale bars, 10 µm. The experiment was repeated independently three times with similar results, using three biological replicates. b, Venn diagram depicting the overlap of SOX3-bound genes in uSPG (this work) with SOX3-bound genes in uSPG and NPCs. c, Venn diagram showing the overlap of SOX3-bound genes with ZBTB16. d, RNA-seq heat map depicting differential gene expression (fold change cutoff = 1.5, P < 0.05, derived from DESeq2 analysis) in Sox3-deficient THY1+ uSPG compared to WT. Adjusted P values account for multiple comparisons using the Benjamini–Hochberg method. e, Venn diagram showing the overlap of SOX3-bound genes with affected genes by Sox3 deficiency (as analyzed in b,d). Statistical analysis was performed using a hypergeometric test. f, GO terms for functional clustering of SOX3-bound genes upregulated in Sox3-deficient THY1+ uSPG. g, Venn diagram showing the overlap of SOX3-bound genes and Sox3-affected genes in uSPG (this work) and SOX3-bound genes in NPCs. Statistical analysis was performed using a hypergeometric test. h, Gene targets of SOX3. Browser snapshots displaying genes downregulated (Neurog3 and Lin28a) or upregulated (Cyp26b1 and Col15a1) in Sox3-deficient THY1+ uSPG. Tracks include RNA-seq from purified THY1+ uSPG in WT and Sox3-cKO mouse testes at P7 and SOX3 ChIP-seq data from uSPG (this work and GSE146706 (ref. )) and NPCs (GSE33024 (ref. )) (qValFDR). Source data
Fig. 5
Fig. 5. A ZBTB16, SALL4 and SOX3 TF and chromatin network in uSPG.
a, Venn diagram showing the overlap of ZBTB16-bound genes with SALL4 and SOX3. b, RNA-seq heat map showing differential gene expression across spermatogenesis (k = 7). c, Venn diagram showing the overlap of genes cobound by ZBTB16, SALL4 and SOX3 with DEGs during spermatogenesis as analyzed in a,b. d, Left, ChIP-seq heat map showing differential enrichment at promoters of genes cobound by ZBTB16, SALL4 and SOX3 (typical promoter) and unbound genes (atypical promoter), along with histone modifications,, across spermatogenesis as analyzed in c. Right, violin plot showing fraction of DNAme in THY1+ uSPG. e, Venn diagram showing the overlap of Zbtb16-affected genes (this work) with Sox3-affected genes (this work) and Sall4-affected genes. Source data
Fig. 6
Fig. 6. Differential occupancy of RNAPol2 and higher-order chromatin interactions at typical and atypical promoters during spermatogenesis.
a, Metagene heat map showing occupancy of TBP, RNAPol2 and RNAPol2 active states marked by CTD Ser5 phosphorylation (transcription initiation) and Ser2 phosphorylation (transcription elongation) at typical and atypical promoters in testes from juveniles (P8; only SPG) or adults (all germ cell types). TES, transcription end site. b, Metagene heat map illustrating PRO-seq signal data, highlighting RNAPol2 pausing in SPG at meiotic genes (as analyzed in Fig. 5d) and the retention of RNAPol2 at silent typical genes in RSs. c, Aggregate plots of Hi-C data, depicting the P–P interactions at typical promoters or atypical promoters across different stages of spermatogenesis (as analyzed in Fig. 5d), revealing the higher-order chromatin organization and interactions solely among typical promoters. d, Metagene heat map displaying CTCF enrichment in THY1+ uSPG and PSs at promoters of typical and atypical genes (as analyzed in Fig. 5d) showing CTCF binding focused at typical promoters. e, Model illustrating that ZBTB16, SALL4 and SOX3 co-occupy typical gene promoters, forming an active 3D conformation enriched with CTCF, which differs from chromatin organization observed at atypical gene promoters during different phases of spermatogenesis.
Fig. 7
Fig. 7. Transcriptional and chromatin regulation during spermatogenesis.
a, Schematic summary of the logic used by key factors during phases of spermatogenesis. First, differential expression and regulation of CCND1 and CCND2 and cognate partner CDK4 accompany early uSPG versus late uSPG. A lack of Zbtb16 promotes (thicker transition 1 arrow) the transition of quiescent uSPG to more active early uSPG, which are CCND2 positive. However, as ZBTB16 normally also helps activate Ccnd1 and Neurog3 to promote developmental progression, uSPG lacking Zbtb16 are less able to progress (thinner transition 3 arrow) through U–DT. b, Schematic summarizing the distinctive TF and histone dynamics at typical and atypical gene promoters during spermatogenesis phases. In uSPG, typical promoters are actively bound by the three TFs (ZBTB16, SALL4 and SOX3), along with poised and paused RNAPol2 (ref. ), and are accompanied by H3K4me3, H3K27ac, accessible chromatin (assessed by ATAC-seq), higher-order P–P interactions (examined by Hi-C) and DNA hypomethylation. Conversely, atypical promoters lack these factors and features in uSPG and instead bear DNAme and recruit only RNAPol2 when activated in spermiogenesis. Notably, despite the absence of all three TFs in spermatocytes, the chromatin features of typical promoters persist throughout meiosis and spermiogenesis, albeit with the addition of H3K27me3 during these phases. Here, we speculate that SSAs activate subsets of the typical network in SPG (for example, RHOX10, SOHLH1/2, NEUROG3 and DMRT1) and during meiotic phases (for example, STRA8, cMyb and TCFL5), whereas a largely separate set of SSAs (for example, RFX2, CREM and ACT) activates atypical promoters to execute stages of spermiogenesis.
Extended Data Fig. 1
Extended Data Fig. 1. RNA-seq and ChIP-seq quality control, Related to Fig. 1.
a, Heatmap showing pairwise R2 values of three biological replicates of RNA-seq in THY1+ uSPG and KIT+ dSPG from WT or null. b, Genome browser shots displaying cell-specific marker genes, including Thy1 and Kit. c, Immunoblot demonstrating the specificity of two ZBTB16 antibodies raised in rabbits (left) and goats (right),confirming the loss of ZBTB16 expression in Zbtb16 null samples. Arrowheads indicate the denoted protein sizes, and an asterisk (*) shows a nonspecific band. The 25 kDa band indicates the predicted truncated peptide of ZBTB16. This experiment was repeated independently twice with three biological replicates, yielding similar results. d, Heatmap showing clustering of pairwise Spearman correlation of ZBTB16 ChIP-seq in uSPG and PC-uSPG. In uSPG, rabbit anti-ZBTB16 ChIP-seq data are correlated with goat anti-ZBTB16 ChIP-seq data, which are less correlated with goat anti-ZBTB16 ChIP-seq in PC-uSPG. e, Distribution of ChIP-seq peaks in uSPG, PC-uSPG, and MASCs. Left: ZBTB16, SALL4 and SOX3. Right: H3K4me3, H3K9me3, and H3K27me3. Promoters are defined within ±2 kb of the TSS for transcription factors and within ±1 kb of the TSS for histone modifications. f, Upset plot displaying multiple binding sites of ZBTB16 in uSPG and PC-uSPG. Source data
Extended Data Fig. 2
Extended Data Fig. 2. Indirect gene targets of ZBTB16 and ZBTB16 binding motifs, related Figs. 1–2.
a, RNA-seq heatmap depicting indirect gene targets of ZBTB16 differentially expressed in WT and Zbtb16 null THY1+ uSPG (left), alongside top enriched GO terms, transcription factors, receptors, and ligands from upregulated and downregulated genes (right). Asterisks (*) denote genes related to male infertility. b, Venn diagram showing the overlap of ZBTB16-bound genes with ubH2AK119 and BMI1 in THY1+ uSPG reprocessed from GSE55060 ref. . c, Genome browser view of Hoxd clusters (left) with an enlarged view of the purple boxed region showing Hoxd10 and Hoxd11 (right). d, Putative ZBTB16 binding motifs identified using MEME-ChIP (top), with a Venn diagram showing the motif intersections with Zbtb16-affected genes (bottom). e, ZBTB16 binding motifs identified from regular ChIP-seq peaks (top) and ChIP-nexus data (bottom) using GEM. f, Genome browser view of a ZBTB16-bound site at Chromosome 10 telomere (top), with an enlarged view of the purple boxed region showing the DNA sequences (bottom). Source data
Extended Data Fig. 3
Extended Data Fig. 3. ZBTB16 binds and suppresses particular retrotransposons, Related to Fig. 2.
a, Distribution of ChIP-seq peaks from ZBTB16, H3K4me3, H3K9me3, and H3K27me3. Promoters are defined within ±1 kb of retrotransposons. b, Venn diagram showing ZBTB16-bound LTR, LINE, and SINE overlapping with H3K4me3 in THY1+ uSPG. Statistical analysis was performed using a hypergeometric test. c, Heatmap showing k-means clustering (k = 4) of ZBTB16, H3K4me3, H3K9me3, and H3K27me3 at the center (±10 kb) of binding sites from the union of all ChIP-seq data sets with DNA methylation, ATAC-seq, and annotation of LTRs, LINEs, SINEs, and piRNAs. d, Genome browser panels showing B2_Mm1a and B1_Mur2 (SINE), L1M2 (LINE), and ERVB7_2B (LTR) suppressed by ZBTB16 with tracks for chromatin landscape marks, including H3K4me3, H3K27me3, and DNAme. Source data
Extended Data Fig. 4
Extended Data Fig. 4. Comparison of ZBTB16 target genes in uSPG and PC-uSPG, Related to Fig. 3.
a, Venn diagram showing Zbtb16-affected genes in THY1+ uSPG using RNA-seq (this work) overlapping with those in ITGA6+ uSPG using microarray. Statistical analysis was performed using a hypergeometric test. b, Heatmap showing 33 common ZBTB16 target genes in THY1+ uSPG and ITGA6+ uSPG, as analyzed in a. c, Heatmap showing ZBTB16 target genes compared with prior works,,. RNA-seq heatmap showing gene expression in WT and Zbtb16-deficient THY1+ uSPG (left) with ChIP-seq heatmap (right) showing ZBTB16 and SALL4 enrichments in uSPG (this work) and PC-uSPG. d, RNA-seq heatmap depicting differential expression in WT THY1+ uSPG and PC-uSPG (left) with enriched GO term and transcription factors (right).
Extended Data Fig. 5
Extended Data Fig. 5. Distinctive gene regulation by ZBTB16 in uSPG versus PC-uSPG, Related to Fig. 3.
a, PCA plot showing transcriptome relationships among ESCs, PGCs, THY1+ uSPG, KIT+ dSPG, PC-uSPG, and MASCs. b, Box-and-whiskers plot showing Zbtb16 expression level (FPKM) in WT THY1+ uSPG, Zbtb16-deficient THY1+ uSPG, PC-uSPG, and MASCs. The boxes represent the IQR with the central line indicating the median. Whiskers extend to 1.5 times the IQR. Each dot indicates a biological replicate. c, Venn diagram showing ZBTB16 target genes in uSPG (this work) overlapped with those in PC-uSPG reprocessed from GSE73390 ref. , intersected with differentially expressed genes in Zbtb16-deficient THY1+ uSPG compared with WT using RNA-seq (this work). d, ChIP-seq heatmap showing differential enrichment at promoters of ZBTB16 in vivo (n = 2, this work) and PC-uSPG (n = 3). e, RNA-seq heatmap across the same clusters as analyzed in d displaying loss of ZBTB16 binding and differentially expressed genes in PC-uSPG compared to WT THY1+ uSPG and Zbtb16 null THY1+ uSPG (left, shown in c) with enriched GO term and transcription factors (right). f, Representative genome browser shots displaying loss of ZBTB16 occupancy and differentially expressed genes in PC-uSPG: two downregulated genes (Zeb2 and Zim1) and two upregulated genes in null (Utf1 and Tcf15) that are further affected in PC-uSPG and MACSs.
Extended Data Fig. 6
Extended Data Fig. 6. PC-uSPG lose a majority of ZBTB16 occupancy, with moderate effects on gene expression, Related to Fig. 3.
a, Representative immunofluorescence images showing UTF1, LIN28A, and ZBTB16 expression pattern in testis sections from Zbtb16 null mice and littermate control (WT) at P14: UTF1 (green); LIN28A (red); ZBTB16 (magenta); and DNA (cyan). White arrowheads indicate UTF1+/LIN28A+/ZBTB16+ uSPG. Yellow arrowheads indicate UTF1/LIN28A+/ZBTB16+ uSPG. White arrows indicate UTF1+/LIN28A/ZBTB16 dSPG. Scale bars = 10 µm. The experiment was repeated independently three times with similar results, using three biological replicates. b, Line plot analysis on yellow-arrowed area showing the relative fluorescent intensity of UTF1 (green) and LIN28A (red) in a. Data are representative of three biological replicates. c, Heatmap showing differential gene expression of pluripotency transcription factors in THY1+ uSPG, KIT+ dSPG, and PC-uSPG. d, Heatmap showing differential gene expression of genes involved in cell migration in THY1+ uSPG versus PC-uSPG, as analyzed in Extended Data Fig. 5e. e, Representative immunofluorescence images showing ADAMTS5 and LIN28A expression patterns in testis sections from Zbtb16 null mice and littermate controls (WT) at P14: ADAMTS5 (green); LIN28A (red); and DNA (cyan). Arrowheads indicate ADAMTS5+/LIN28A+ uSPG. Arrows indicate ADAMTS5/LIN28A+ dSPG. Scale bars = 10 µm. The experiment was repeated independently three times with similar results, using three biological replicates. f, Representative whole-mount staining images showing SOX3, GATA4, and VERSIKINE expression pattern in seminiferous tubules from Zbtb16 null mice and littermate controls (WT) at P14: SOX3 (green); GATA4 (grey); VERSIKINE (magenta); and DNA (cyan). Arrowheads indicate SOX3+/GATA4/VERSIKINE+ uSPG. Arrows indicate SOX3/GATA4+/VERSIKINE Sertoli cells. Scale bars = 10 µm. The experiment was repeated independently three times with similar results, using three biological replicates.
Extended Data Fig. 7
Extended Data Fig. 7. ZBTB16 target genes, testis development and gene expression of cyclin Ds and CDKs in uSPG, Related to Fig. 3.
a, Flow cytometry plots from mouse SPG at P7 illustrating the gating strategy. Cells were identified by forward scatter (FSC) and back scatter (BSC), followed by doublets exclusion and separation of uSPG (THY1+) and dSPG (KIT+). DNA contents analysis assessed cell cycle stages. b, Venn diagram showing Zbtb16-affected genes (this study) and GDNF-affected genes. Statistical significance was assessed using a hypergeometric test. c, Heatmap of selected Zbtb16-affected genes overlapping with GDNF-affected genes, as analyzed in a. d, Testis weights of Zbtb16-null mice and WT littermates at indicated ages (n = 5 biological replicates per genotype). Statistical significance was determined using the Wilcoxon rank-sum test. e, Testis weights normalized to body weights (n = 5 biological replicates per genotype). Statistical significance was determined using the Wilcoxon rank-sum test. f, Heatmap of cyclin D and CDK gene expression in Id4-GFP+ Bright uSPG versus Dim uSPG at P7. g, Heatmap of cyclin D and CDK gene expression across developmental stage (ESCs, PGCs, WT uSPG, Zbtb16-null uSPG, dSPG, PC-uSPG, and MASCs). h, Immunofluorescence images showing CCND1 and CCND2 expression in WT and Zbtb16 null mice at P14: CCND2 (green), CCND1 (red), ZBTB16 (magenta), and DNA (cyan). Arrowheads indicate CCND2+/CCND1+/ZBTB16+ self-renewing uSPG. Arrows indicate CCND2/CCND1+/ZBTB16+ late uSPG. Scale bars = 10 µm. i, Line plot of CCND2 (green), CCND1 (red), and ZBTB16 (magenta) levels from yellow arrows in h. j, Immunofluorescence of pCDK4 and CCND1/2 in WT and Zbtb16-null at P14: CCND2 (green), CCND1 (red), pCDK4 (magenta), and DNA (cyan). Arrowheads indicate CCND2+/CCND1+/pCDK4+ early uSPG. Arrows indicate CCND2/CCND1+/pCDK4+ progenitors. Scale bars = 10 µm. k, Immunofluorescence showing pCDK6 localization in leptotene and pachytene spermatocytes but not uSPG at P14: pCDK6 (green), LIN28A (red), CCND1 (magenta), and DNA (cyan). Arrowheads: CDK6+ leptotene spermatocytes; arrows: pCDK6+ pachytene spermatocytes. Scale bars = 10 µm. The experiment was repeated independently three times with similar results, using three biological replicates. Source data
Extended Data Fig. 8
Extended Data Fig. 8. SALL4 expression and GO enrichment analysis in SALL4 target genes, Related to Fig. 4.
a, Representative immunofluorescence images showing differential expression of ZBTB16, LIN28A, and SALL4 expression pattern in testis sections from Zbtb16 null mice and littermate control (WT) at P14: ZBTB16 (green); LIN28A (red); SALL4 (magenta); and DNA (cyan). Arrowhead indicates ZBTB16+/LIN28A+/SALL4+ uSPG. Arrow indicates ZBTB16-/LIN28A+/SALL4+ differentiating SPG. Scale bars = 10 µm. The experiment was repeated independently three times with similar results, using three biological replicates. b, Venn diagram showing the extent of overlap of SALL4 comparing in vivo uSPG (this work) to PC-uSPG reprocessed from GSE73390 ref. and Sall4-affected genes in PC-uSPG. c, Venn diagram showing ZBTB16-bound genes overlapping with SALL4-bound genes in uSPG, as analyzed in Fig. 1c and Extended Data Fig. 8b. d, Venn diagram showing ZBTB16-bound genes overlapping with SALL4-bound genes in PC-uSPG, as analyzed in Extended Data Fig. 5c and Fig. 8b. e, GO terms for functional clustering of genes downregulated in Sall4-deficient PC-uSPG associated with in vivo SALL4 ChIP-seq peaks (this work). f, GO terms for functional clustering of genes upregulated in Sall4-deficient PC-uSPG associated with in vivo SALL4 ChIP-seq peaks (this work). g, Box-and-whiskers plot showing Sall4 expression level (FPKM) in ESCs, PGCs (SRA097278), THY1+ uSPG, KIT+ dSPG, PC-uSPG, MASCs, and HSCs. The boxes represent the IQR with the central line indicating the median. Whiskers extend to 1.5 times the IQR. Each dot indicates a biological replicate. h, ChIP-seq heatmap showing differential enrichment at promoters of SALL4 in vivo (n = 2, this work) and PC-uSPG (n = 3), as analyzed in b. i, Venn diagram showing ZBTB16-bound genes overlapping with SALL4-bound genes that are lost in PC-uSPG, as analyzed in Extended Data Fig. 5c and Fig. 8b. Statistical analysis was performed using a hypergeometric test. j, Heatmap showing the positive correlation between selected ZBTB16 target genes and SALL4 target genes, as analyzed in i. k, Venn diagram showing the overlap of SALL4 direct target genes in PC-uSPG with ZBTB16 direct target genes in PC-uSPG as analyzed in Extended Data Fig. 5c and Fig. 8b. Statistical analysis was performed using a hypergeometric test. l, Heatmap showing the positive correlation between ZBTB16 target genes and SALL4 target genes, as analyzed in k.
Extended Data Fig. 9
Extended Data Fig. 9. ZBTB16, SALL4 and SOX3-bound genes with histone modifications and chromatin accessibility in Typical and Atypical genes, Related to Fig. 5.
a, ChIP-seq heatmap showing enrichment of Typical gene promoters in WT and Zbtb16 null mice, highlighting similar SALL4 and SOX3 occupancy, as analyzed in Fig. 5d. b, Venn diagram showing the overlap of SALL4-bound genes with H3K4me3 and H3K27me3 in THY1+ uSPG (this work). c, Venn diagram showing the overlap of SALL4-bound genes with H3K4me3 (this work) and H3K27ac in THY1+ uSPG. d, Venn diagram showing the overlap of SOX3-bound genes with H3K4me3 and H3K27me3 in THY1+ uSPG (this work). e, Venn diagram showing the overlap of SOX3-bound genes with H3K4me3 (this work) and H3K27ac in THY1+ uSPG. f, Line graph depicting the co-occupancy of ZBTB16, SALL4, and SOX3 at TSS within 5 Kb across clusters 1–7, as analyzed in Fig. 5d. g, Distribution of protein-coding and non-coding genes in Typical and Atypical genes as analyzed in Fig. 5d. h, Heatamp showing the relative average expression for selected snRNA, translation initiation factors and snoRNA genes across the Typical genes in RSs. i, Heatamp displaying the relative average expression for spermiogenic genes across the Atypical genes in RSs. Asterisks (*) indicate genes related to male infertility. j, Alluvial plots showing histone dynamics during mitosis (clusters 1–3), meiosis (clusters 4 and 5), and spermiogenesis (clusters 6 and 7) in Typical and Atypical genes, as analyzed in Fig. 5d. k, ATAC-seq, heatmap showing chromatin accessibility in Typical and Atypical genes, as analyzed in Fig. 5d. l, ChIP-seq heatmap showing differential enrichment at mitotic and meiotic super-enhancers of Typical and Atypical genes, along with histone modifications across spermatogenesis.
Extended Data Fig. 10
Extended Data Fig. 10. Target genes of RHOX10 overlap with those of ZBTB16 targets, Related to Fig. 5.
a, Venn diagram showing the overlap of ZBTB16-bound genes (this work) and ZBTB16, SALL4 and SOX3 co-bound genes with RHOX10-bound genes. b, Venn diagram showing the overlap of RHOX10-bound genes with H3K4me3 and H3K27me3 in THY1+ uSPG (this work). c, Venn diagram showing the overlap of RHOX10-bound genes with H3K4me3 (this work) and H3K27ac in THY1+ uSPG. d, Venn diagram showing the overlap of Zbtb16-affected genes (this work) with Rhox10-affected genes. Statistical analysis was performed using a hypergeometric test. e, Venn diagram showing the overlap of ZBTB16 direct target genes (this work) with RHOX10 direct target genes, as analyzed in a and d. Statistical analysis was performed using a hypergeometric test. f, Scatter plot comparing the log2 fold change between differentially expressed genes in both Zbtb16-deficient uSPG and Rhox10-deficient Pou5f1-EGFP+ uSPG compared with WT, as analyzed in d. Red genes indicate direct target genes co-bound with ZBTB16 and RHOX10.

References

    1. Hammoud, S. S. et al. Transcription and imprinting dynamics in developing postnatal male germline stem cells. Genes Dev.29, 2312–2324 (2015). - PMC - PubMed
    1. Hara, K. et al. Mouse spermatogenic stem cells continually interconvert between equipotent singly isolated and syncytial states. Cell Stem Cell14, 658–672 (2014). - PMC - PubMed
    1. Kitadate, Y. et al. Competition for mitogens regulates spermatogenic stem cell homeostasis in an open niche. Cell Stem Cell24, 79–92 (2019). - PMC - PubMed
    1. Niu, Z., Goodyear, S. M., Avarbock, M. R. & Brinster, R. L. Chemokine (C–X–C) ligand 12 facilitates trafficking of donor spermatogonial stem cells. Stem Cells Int.2016, 5796305 (2016). - PMC - PubMed
    1. Liu, Y. et al. Epigenetic profiles signify cell fate plasticity in unipotent spermatogonial stem and progenitor cells. Nat. Commun.7, 11275 (2016). - PMC - PubMed

LinkOut - more resources