

The role of senescence-related genes in major depressive disorder: insights from machine learning and single cell analysis
- PMID: 40033248
- PMCID: PMC11874787
- DOI: 10.1186/s12888-025-06542-8
The role of senescence-related genes in major depressive disorder: insights from machine learning and single cell analysis
Abstract
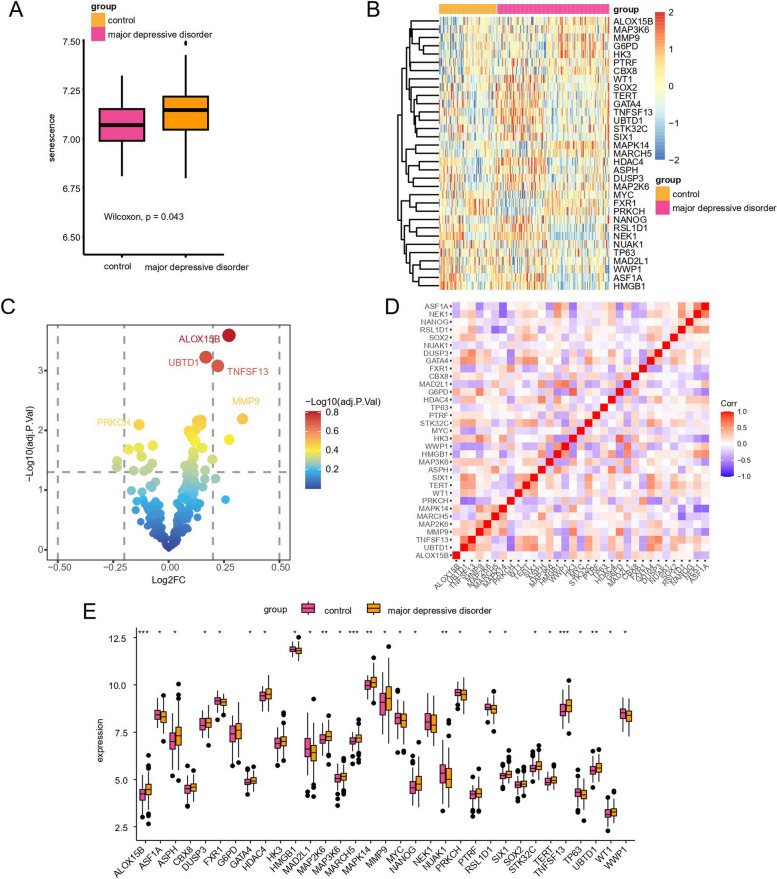
Background: Evidence indicates that patients with Major Depressive Disorder (MDD) exhibit a senescence phenotype or an increased susceptibility to premature senescence. However, the relationship between senescence-related genes (SRGs) and MDD remains underexplored.
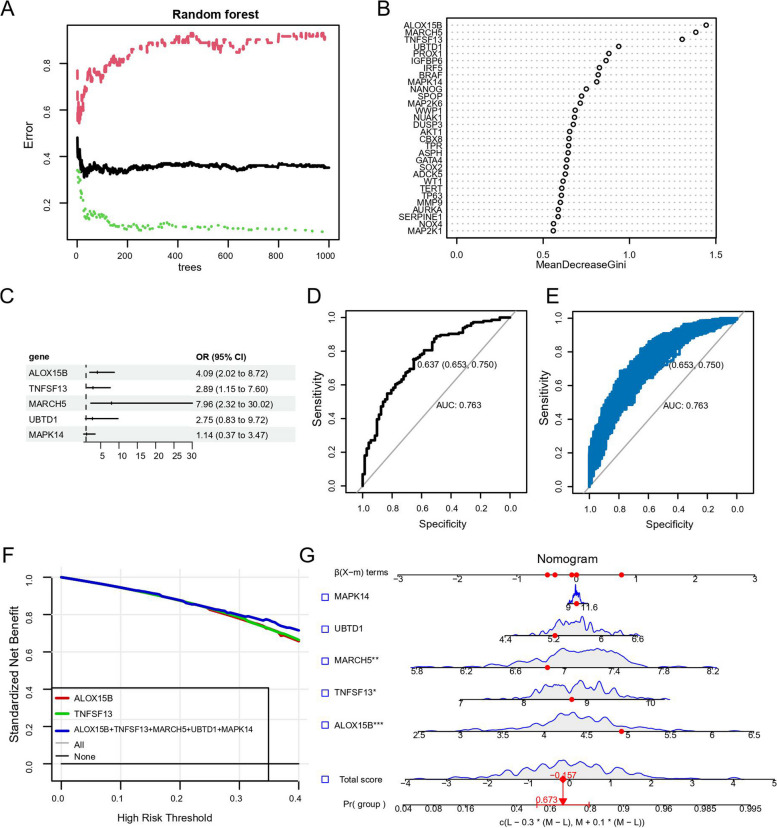
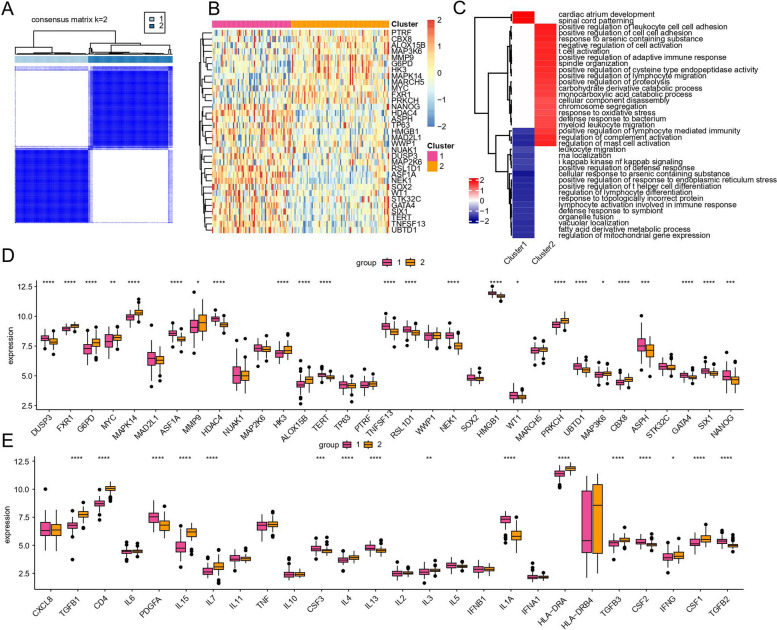
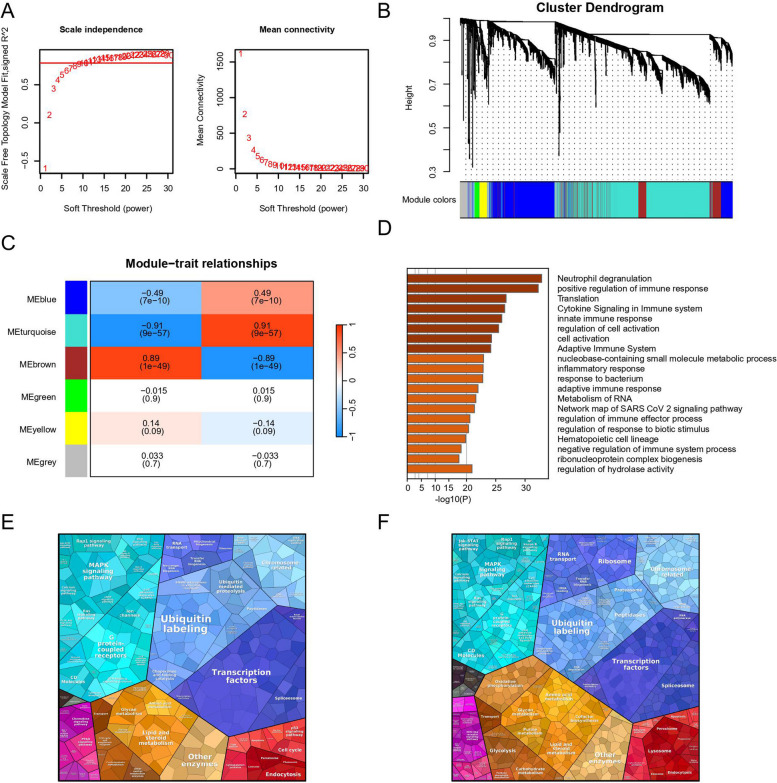
Methods: We analyzed 144 MDD samples and 72 healthy controls from the GEO database to compare SRGs expression. Using Random Forest (RF) and Support Vector Machine-Recursive Feature Elimination (SVM-RFE), we identified five hub SRGs to construct a logistic regression model. Consensus cluster analysis, based on SRGs expression patterns, identified subclusters of MDD patients. Weighted Gene Co-expression Network Analysis (WGCNA) identified gene modules strongly linked to each cluster. Single-cell RNA sequencing was used to analyze MDD SRGs functions.
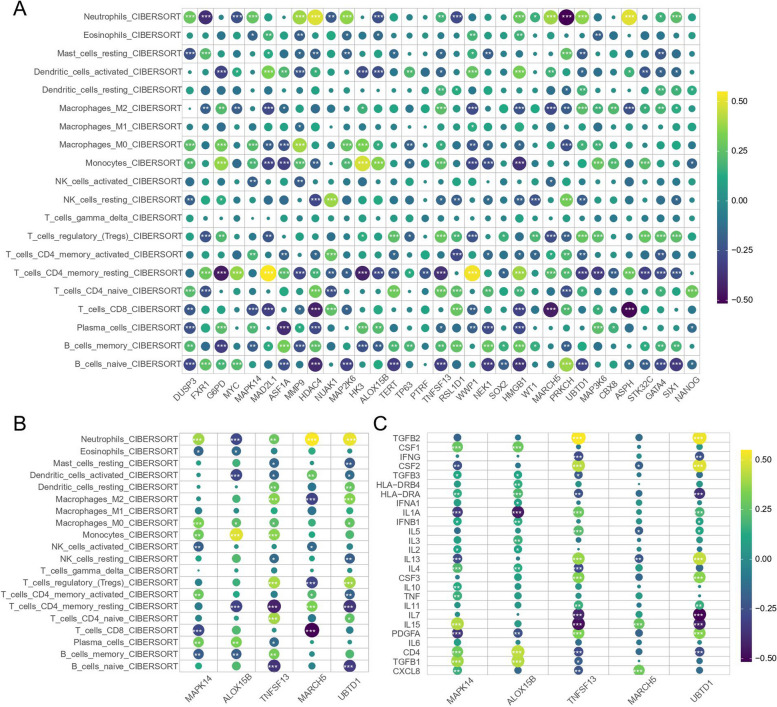
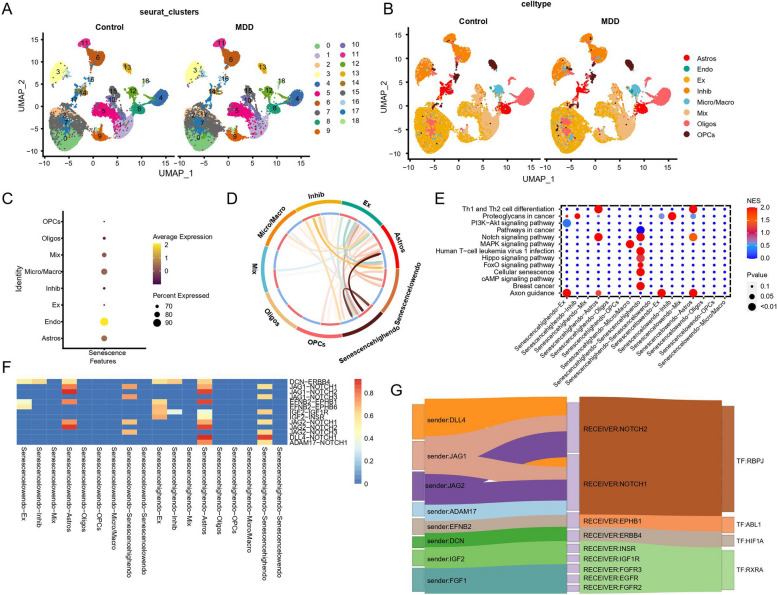
Results: The five hub SRGs: ALOX15B, TNFSF13, MARCH 15, UBTD1, and MAPK14 showed differential expression between MDD patients and controls. Diagnostics models based on these hub genes demonstrated high accuracy. The hub SRGs correlated positively with neutrophils and negatively with T lymphocytes. SRGs expression pattern revealed two distinct MDD subclusters. WGCNA identified significant gene modules within these subclusters. Additionally, individual endothelial cells with high senescence scores were found to interact with astrocytes via the Notch signaling pathway, suggesting a specific role in MDD pathogenesis.
Conclusion: This comprehensive study elucidates the significant role of SRGs in MDD, highlighting the importance of the Notch signaling pathway in mediating senescence effects.
Keywords: Bulk RNA analysis; Endothelial cells; Major depressive disorder; Senescence; Single-cell RNA analysis.
© 2025. The Author(s).
Conflict of interest statement
Declarations. Ethics approval and consent to participate: The patients involved in the GEO database have obtained ethical approval. Our study is based on open data, there are no ethical issues and other conflicts of interest. Competing interests: The authors declare no competing interests.
Figures

Similar articles
-
Deciphering the impact of senescence in kidney transplant rejection: An integrative machine learning and multi-omics analysis via bulk and single-cell RNA sequencing.PLoS One. 2024 Nov 27;19(11):e0312272. doi: 10.1371/journal.pone.0312272. eCollection 2024. PLoS One. 2024. PMID: 39602449 Free PMC article.
-
Integrating Single-Cell and Bulk RNA Sequencing Data to Explore Sphingolipid Metabolism Molecular Signatures in Ovarian Cancer Prognosis: an Original Study.Int J Med Sci. 2025 Mar 24;22(8):1958-1977. doi: 10.7150/ijms.107391. eCollection 2025. Int J Med Sci. 2025. PMID: 40225866 Free PMC article.
-
Comprehensive analysis of mitophagy-related genes in diagnosis and heterogeneous endothelial cells in chronic rhinosinusitis: based on bulk and single-cell RNA sequencing data.Front Genet. 2023 Sep 8;14:1228028. doi: 10.3389/fgene.2023.1228028. eCollection 2023. Front Genet. 2023. PMID: 37745856 Free PMC article.
-
Association of aging related genes and immune microenvironment with major depressive disorder.J Affect Disord. 2025 Jan 15;369:706-717. doi: 10.1016/j.jad.2024.10.053. Epub 2024 Oct 16. J Affect Disord. 2025. PMID: 39419187
-
Immune-related gene characterization and biological mechanisms in major depressive disorder revealed based on transcriptomics and network pharmacology.Front Psychiatry. 2024 Dec 6;15:1485957. doi: 10.3389/fpsyt.2024.1485957. eCollection 2024. Front Psychiatry. 2024. PMID: 39713769 Free PMC article.
Cited by
-
Canonical and non-canonical roles of oligodendrocyte precursor cells in mental disorders.Npj Ment Health Res. 2025 May 15;4(1):19. doi: 10.1038/s44184-025-00133-x. Npj Ment Health Res. 2025. PMID: 40374740 Free PMC article. Review.
-
A network-based approach to discover diagnostic metabolite markers associated with depressive features for major depressive disorder.Front Psychiatry. 2025 Jun 6;16:1610520. doi: 10.3389/fpsyt.2025.1610520. eCollection 2025. Front Psychiatry. 2025. PMID: 40547126 Free PMC article.
References
-
- Uchida S, Yamagata H, Seki T, et al. Epigenetic mechanisms of major depression: targeting neuronal plasticity. Psychiatry Clin Neurosci. 2018;72(4):212–27. - PubMed
MeSH terms
Grants and funding
LinkOut - more resources
Full Text Sources
Medical
Miscellaneous
