. 2025 Mar 4;16(1):34.
doi: 10.1186/s40104-025-01152-6.

Functional validation to explore the protective role of miR-223 in Staphylococcus aureus-induced bovine mastitis

Affiliations

Functional validation to explore the protective role of miR-223 in Staphylococcus aureus-induced bovine mastitis

Xueqin Liu et al. J Anim Sci Biotechnol. .

Abstract

Background: Mastitis caused by Staphylococcus aureus (S. aureus) is one of the most intractable problems for the dairy industry, causing significantly reduced milk yields and early slaughter of cows worldwide. MicroRNAs (miRNAs) can post-transcriptionally regulate gene expression and studies in recent years have shown the importance of miRNA-associated gene regulation in S. aureus-induced mastitis.

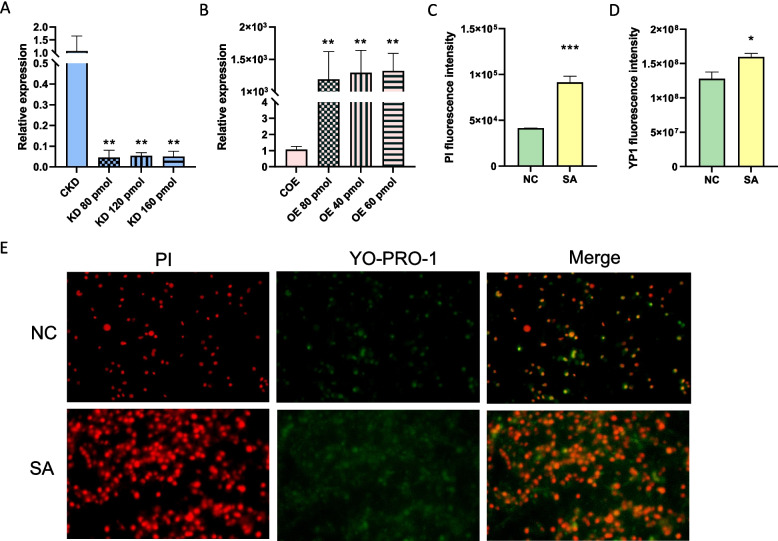
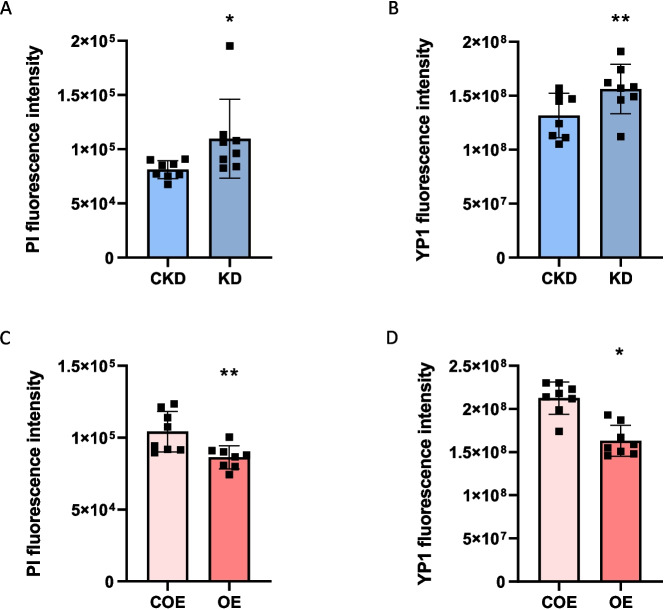
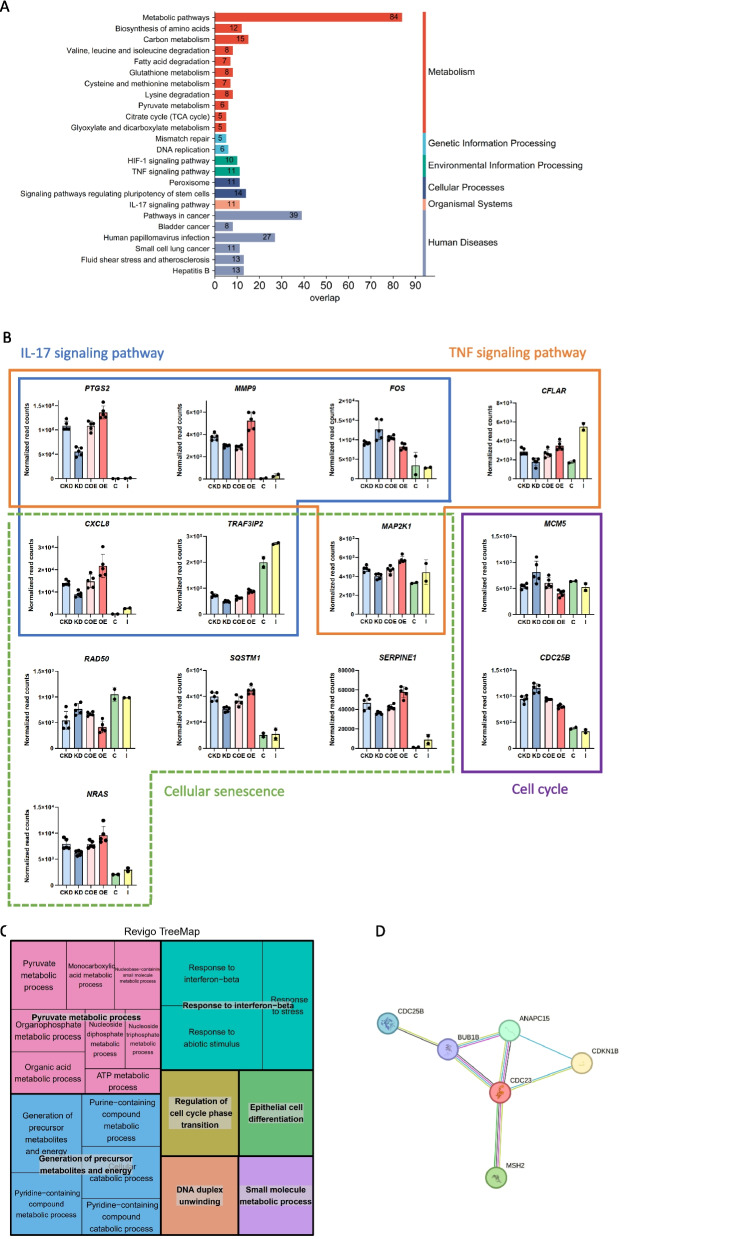
Results: In this study, to investigate the role of miR-223 in mastitis, we performed experiments to overexpress and suppress miR-223 in an immortalized bovine mammary epithelial cell line (MAC-T) infected with S. aureus. Overexpression of miR-223 in MAC-T cells repressed cell apoptosis and necrosis induced by S. aureus infection, whereas suppression of miR-223 had the opposite effect. Transcriptome expression profiling with weighted gene co-expression network analysis (WGCNA) and gene set variation analysis (GSVA) showed that miR-223 affects apoptosis and inflammation-related pathways. Furthermore, differentially expressed (DE) genes were evaluated, and genes exhibiting contrasting expression trends in the miR-223 overexpressed and suppressed groups were assessed as potential target genes of miR-223. Potential target genes, including CDC25B, PTPRF, DCTN1, and DPP9, were observed to be associated with apoptosis and necroptosis. Finally, through integrative analysis of genome-wide association study (GWAS) data and the animal quantitative trait loci (QTL) database, we determined that target genes of miR-223 were significantly enriched in single-nucleotide polymorphisms (SNP) and QTLs related to somatic cell count (SCC) and mastitis.

Conclusion: In summary, miR-223 has an inhibitory effect on S. aureus-induced cell apoptosis and necrosis by regulating PTPRF, DCTN1, and DPP9. These genes were significantly enriched in QTL regions associated with bovine mastitis resistance, underscoring their relevance in genetic regulation of disease resilience. Our findings provide critical genetic markers for enhancing mastitis resistance, particularly S. aureus-induced mastitis, through selective breeding. This work offers valuable insights for developing cattle with improved resistance to mastitis via targeted genetic selection.

Keywords: Staphylococcus aureus; Bovine mastitis; Gene regulation; Mammary epithelial cells; MiR-223.


Conflict of interest statement

Declarations. Ethics approval and consent to participate: The cell line MAC-T used in this study was obtained from primary bovine mammary alveolar cells [18], and all experiments were conducted in accordance with relevant guidelines and regulations. The S. aureus strain used was selected from 191 S. aureus strains, which were originally isolated from milk samples of 1,112 lactating Holstein cows [63], and all procedures involving bacterial handling and experimentation were conducted in compliance with biosafety guidelines approved by China Agricultural University. No human or animal subjects were directly involved in this research; therefore, specific ethical approval and consent to participate were not required. Consent for publication: Not applicable. Competing interests: The authors declare that they have no competing interests.

Figures

Fig. 1
Fig. 1
Evaluating bta-miR-223 modulation and S. aureus infection impact in MAC-T cells. Influence of various concentrations of inhibitors (A) and mimics (B) on bta-miR-223 expression levels. Effects of S. aureus challenge on PI (C) and YO-PRO-1 (D) fluorescence intensities in MAC-T cells. Statistical significance is denoted as follows: * denotes BH-Padj. < 0.05, ** denotes BH-Padj. < 0.01, *** denotes BH-Padj. < 0.001, when compared to the respective control groups. E Immunofluorescence depicting S. aureus-induced apoptosis and necrosis. NC (Negative Control): represents untreated cells. SA (S. aureus): represents cells treated with S. aureus. PI (propidium iodide): stains the necrotic cells in red; deeper red indicates higher necrosis. YO-PRO-1: stains apoptotic cells in green; deeper green indicates higher apoptosis. Merge: combines PI and YO-PRO-1 staining to show both necrosis and apoptosis; deeper colors indicate higher levels of cell death
Fig. 2
Fig. 2
Role of bta-miR-223 in modulating cell death responses to S. aureus in MAC-T cells. Impact of bta-miR-223 knockdown on PI (A) and YO-PRO-1 (B). Fluorescence intensity in MAC-T cells after S. aureus infection. Protective effects of bta-miR-223 overexpression on PI (C) and YO-PRO-1 (D) fluorescence intensity in MAC-T cells exposed to S. aureus. CKD represents control knockdown, KD represents bta-miR-223 knockdown, COE represents control overexpression, and OE represents bta-miR-223 overexpression. Statistical significance is denoted as follows: * corresponds to BH-Padj. < 0.05, ** corresponds to BH-Padj. < 0.01, when compared to the respective control groups
Fig. 3
Fig. 3
Transcriptomic features of bta-miR-223 knockdown and overexpression in MAC-T cells. A t-SNE clustering analysis: This analysis clusters samples from four experimental groups based on their transcriptional profiles (FPKM), each denoted by a distinct colour and symbol. B Correlation heatmap: This heatmap depicts pairwise similarities among all samples under the experimental conditions, with a colour gradient from dark blue to dark red indicating correlation coefficients ranging from 0.98 to 1.00. C Expression value distribution: The boxplot displays the distribution of expression values for each sample
Fig. 4
Fig. 4
WGCNA of gene expression modules in response to bta-miR-223 modulation in MAC-T cells. This heatmap depicts the correlations between gene expression modules and the effects of bta-miR-223 modulation under various experimental conditions: KD (knockdown), CKD (control for knockdown), OE (overexpression), and COE (control for overexpression). Each row, represented by a unique colour, corresponds to a distinct gene module. The cells within the heatmap display correlation coefficients; P-values in parentheses indicate the statistical significance of the correlations between each module and the experimental groups (bta-miR-223 modulation). The intensity of the colours—red indicating positive and blue indicating negative correlations. To the left, coloured boxes corresponding to the modules highlight specific biological pathways affected by the treatments, identified through KEGG enrichment analysis. The significance levels of these pathways are indicated by BH-Padj., with significance levels noted (* BH-Padj. < 0.05, ** BH-Padj. < 0.01, *** BH-Padj. < 0.001)
Fig. 5
Fig. 5
GSVA pathway enrichment analysis of bta-miR-223-modulated MAC-T cells. A Bar graph of GSVA enrichment scores for hallmark pathways in the KD vs. CKD comparison. Pathways significantly enriched are displayed with positive enrichment scores in orange and negative enrichment scores in blue. B Bar graph of GSVA enrichment scores for hallmark pathways in the OE vs. COE comparison. C Heatmap showing the enrichment of KEGG pathways in KD, CKD, OE, and COE groups in S. aureus-infected MAC-T cells. D REVIGO TreeMap visualization of shared Biological Process (BP) GO terms enriched in the KD vs. CKD and OE vs. COE comparisons. Each rectangle represents a GO term, with related terms grouped together. The size of the rectangles corresponds to the significance of the enrichment, with colours indicating different biological processes
Fig. 6
Fig. 6
Differential gene expression and functional enrichment in bta-miR-223-modulated MAC-T cells. A Volcano plots showing differentially expressed genes (DEGs) in the bta-miR-223 KD vs. CKD and OE vs. COE comparisons for S. aureus-infected MAC-T cells. Significant DEGs (BH-Padj. < 0.05) are indicated with coloured dots: blue for downregulated genes and red for upregulated genes. The 23 genes consistently differentially expressed across both conditions are highlighted in the centre. B GO enrichment analysis of DEGs in the KD vs. CKD comparison. The network shows significantly enriched GO terms related to immune response and inflammation. C GO enrichment analysis of DEGs in the OE vs. COE comparison. The network shows significantly enriched GO terms
Fig. 7
Fig. 7
Functional analysis of potential bta-miR-223 target genes in S. aureus-infected MAC-T cells. A KEGG pathway enrichment analysis: the bar graph shows the KEGG pathway enrichment analysis of the 693 potential target genes of bta-miR-223 (BH-Padj. < 0.05). B Differential gene expression analysis: the bar plots display the expression levels of key genes (normalized read counts) in critical pathways. Comparisons are shown between the knockdown (KD), overexpression (OE), S. aureus infection group (I), and their respective control groups. The S. aureus infection group (I) and control group (C) are derived from a study on S. aureus infection in different regions of the mammary gland of lactating cows [17]. C GO Analysis—REVIGO TreeMap: the tree map visualizes the Gene Ontology (GO) terms enriched among the potential target genes, focusing on the regulation of cell cycle phase transition, response to stimuli, and epithelial cell differentiation. The size and colour of the boxes represents the significance and categorization of the terms, respectively. D Gene interaction network: the network diagram depicts significant interactions among proteins involved in regulating cell cycle phase transition; highlighted proteins include CDC25B, CDC23, ANAPC15, CDKN1B, MSH2, and BUB1B
Fig. 8
Fig. 8
Functional analysis of bta-miR-223 and its potential target genes in dairy cattle. A The regulatory relationships between bta-miR-223 and its robust potential target genes. Each gene is linked to specific QTLs associated with somatic cell count (SCC), somatic cell score (SCS), and clinical mastitis traits. B The normalized read counts of key genes (PTPRF, DCTN1, PLEC, MYOF, and DPP9) in control (CKD, COE), knockdown (KD), and overexpression (OE) groups. Significant changes in expression levels are indicated by asterisks (*BH-Padj. < 0.05, **BH-Padj. < 0.01, ***BH-Padj. < 0.001). C The heatmap shows the enrichment of gene sets in various reproduction, health, and production traits. Gene sets analysed include DEGs_KD, DEGs_OE, PTGs_KD, PTGs_OE, and Common_PTGs. Traits are categorized as reproduction (purple), health (red), production (green), and others (black). The color intensity represents the −log10(Padj. + 1) value, indicating the level of significance of the enrichment. Asterisks within the heatmap cells denote significant enrichment

References

    1. De Vliegher S, Fox LK, Piepers S, McDougall S, Barkema HW. Invited review: Mastitis in dairy heifers: nature of the disease, potential impact, prevention, and control. J Dairy Sci. 2012;95:1025–40. 10.3168/jds.2010-4074. - PubMed
    1. Gonçalves JL, Kamphuis C, Martins CMMR, Barreiro JR, Tomazi T, Gameiro AH, et al. Bovine subclinical mastitis reduces milk yield and economic return. Livest Sci. 2018;210:25–32. 10.1016/j.livsci.2018.01.016.
    1. Cheng WN, Han SG. Bovine mastitis: Risk factors, therapeutic strategies, and alternative treatments. Asian-Australas J Anim Sci. 2020;33:1699–713. 10.5713/ajas.20.0156. - PMC - PubMed
    1. Kerro Dego O, van Dijk JE, Nederbragt H. Factors involved in the early pathogenesis of bovine Staphylococcus aureus mastitis with emphasis on bacterial adhesion and invasion. Vet Q. 2002;24:181–98. 10.1080/01652176.2002.9695135. - PubMed
    1. Barkema HW, von Keyserlingk MA, Kastelic JP, Lam TJ, Luby C, Roy JP, et al. Invited review: Changes in the dairy industry affecting dairy cattle health and welfare. J Dairy Sci. 2015;98:7426–45. 10.3168/jds.2015-9377. - PubMed

LinkOut - more resources