. 2025 Mar 3;17(1):18.
doi: 10.1186/s13073-025-01441-9.

STModule: identifying tissue modules to uncover spatial components and characteristics of transcriptomic landscapes

Affiliations

STModule: identifying tissue modules to uncover spatial components and characteristics of transcriptomic landscapes

Ran Wang et al. Genome Med. .

Abstract

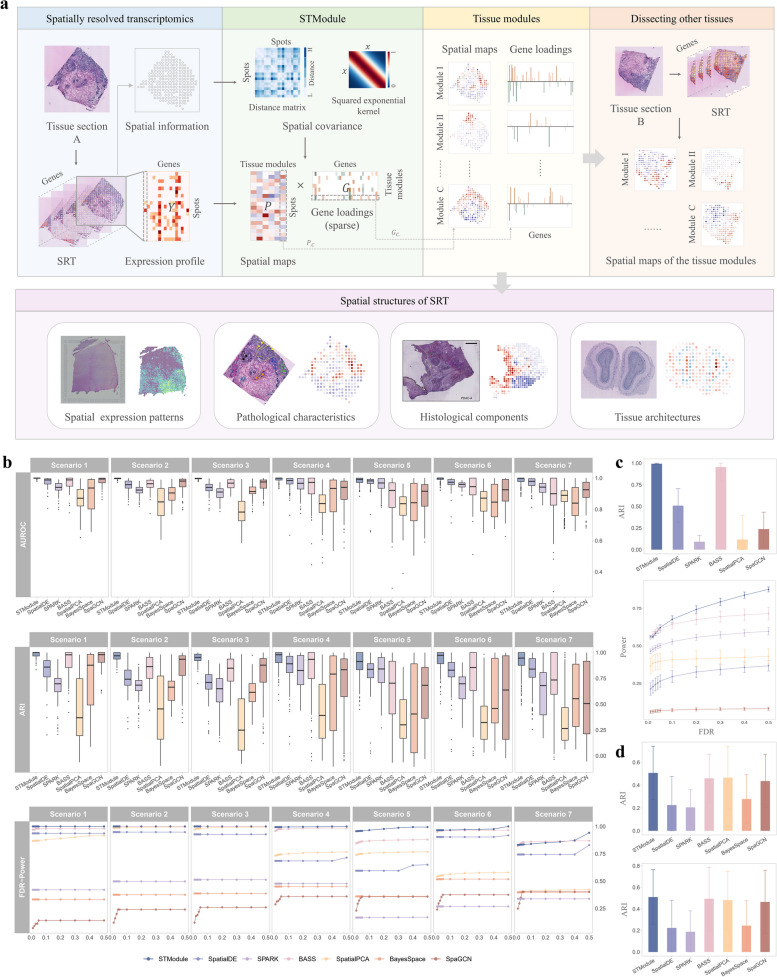
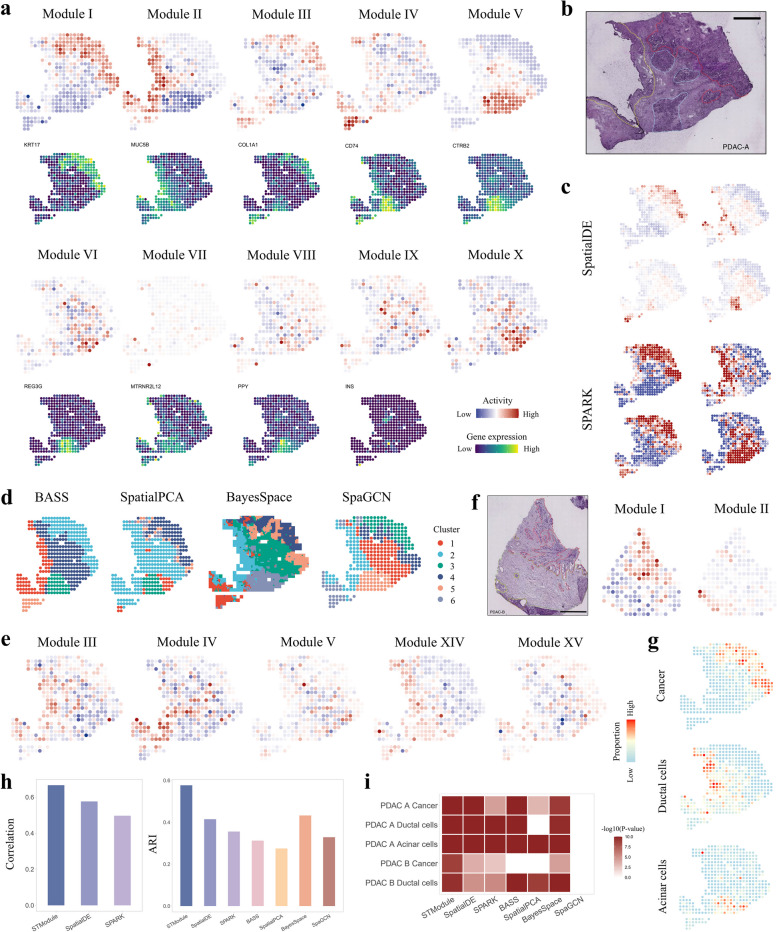
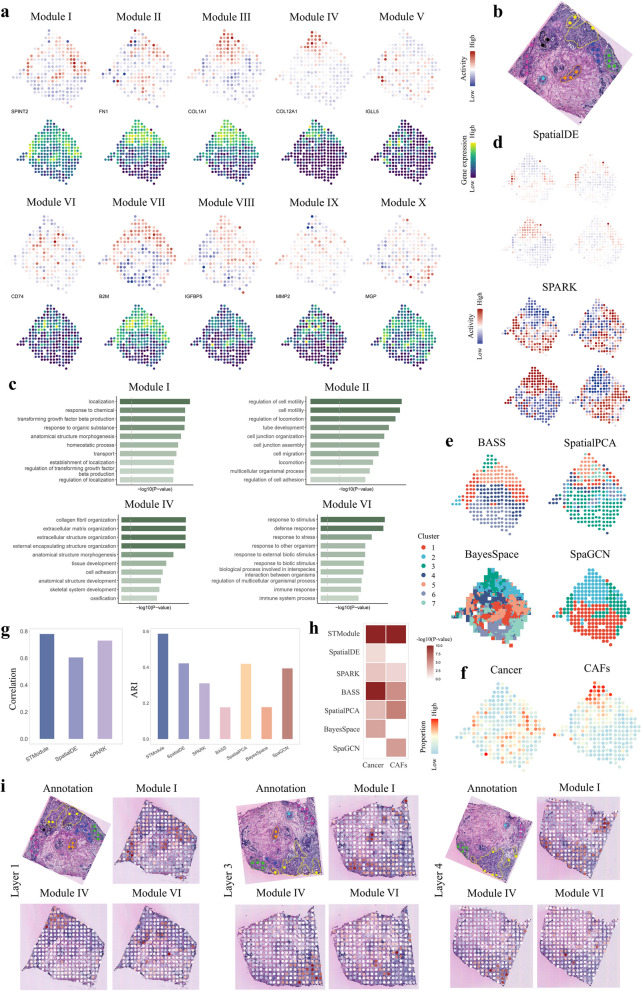
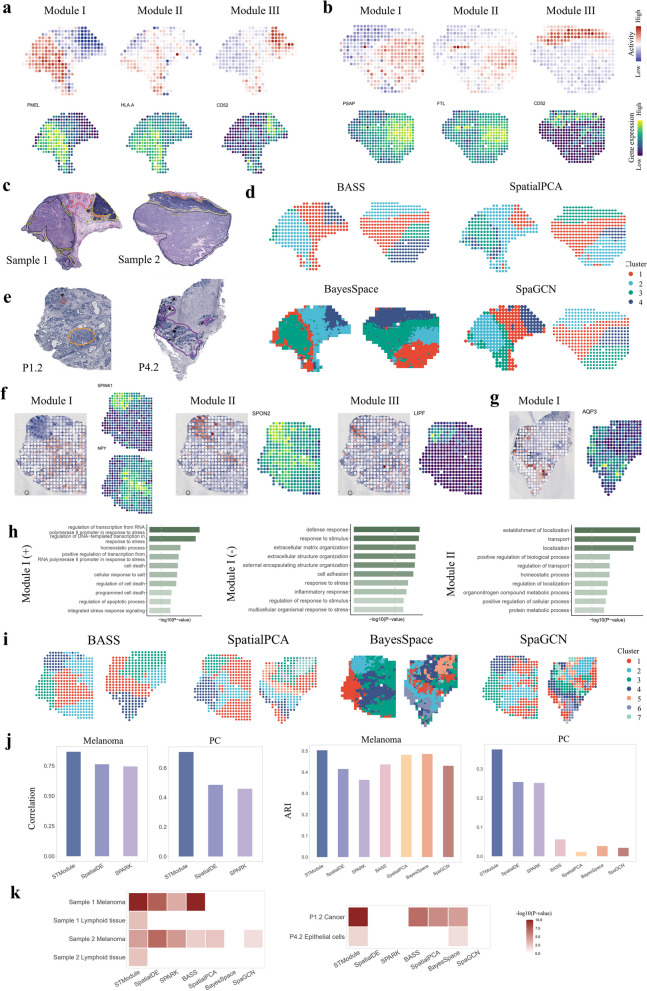
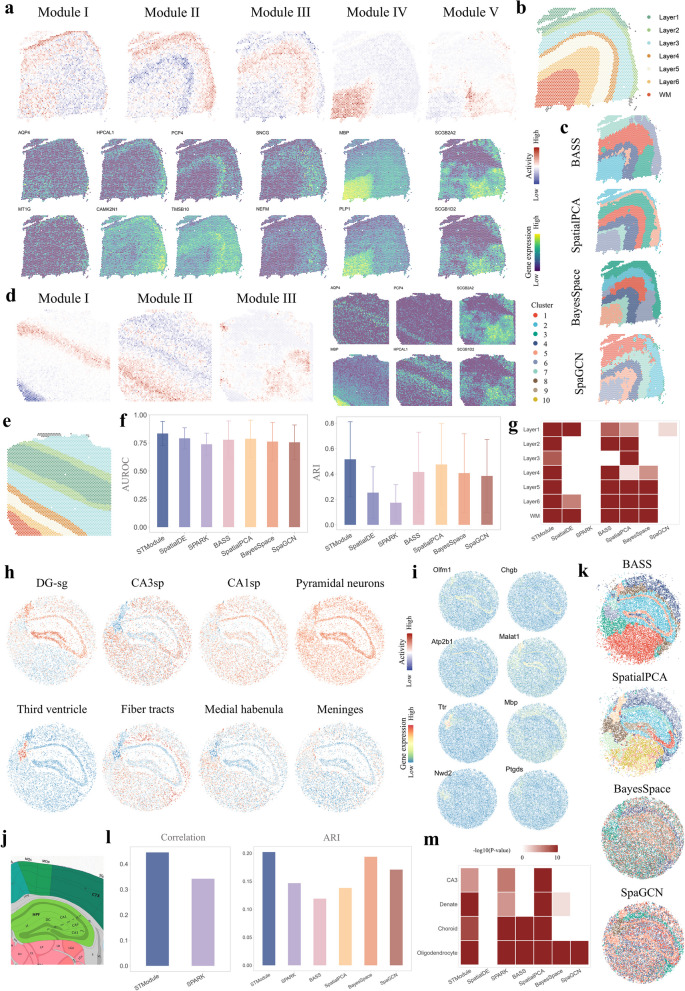
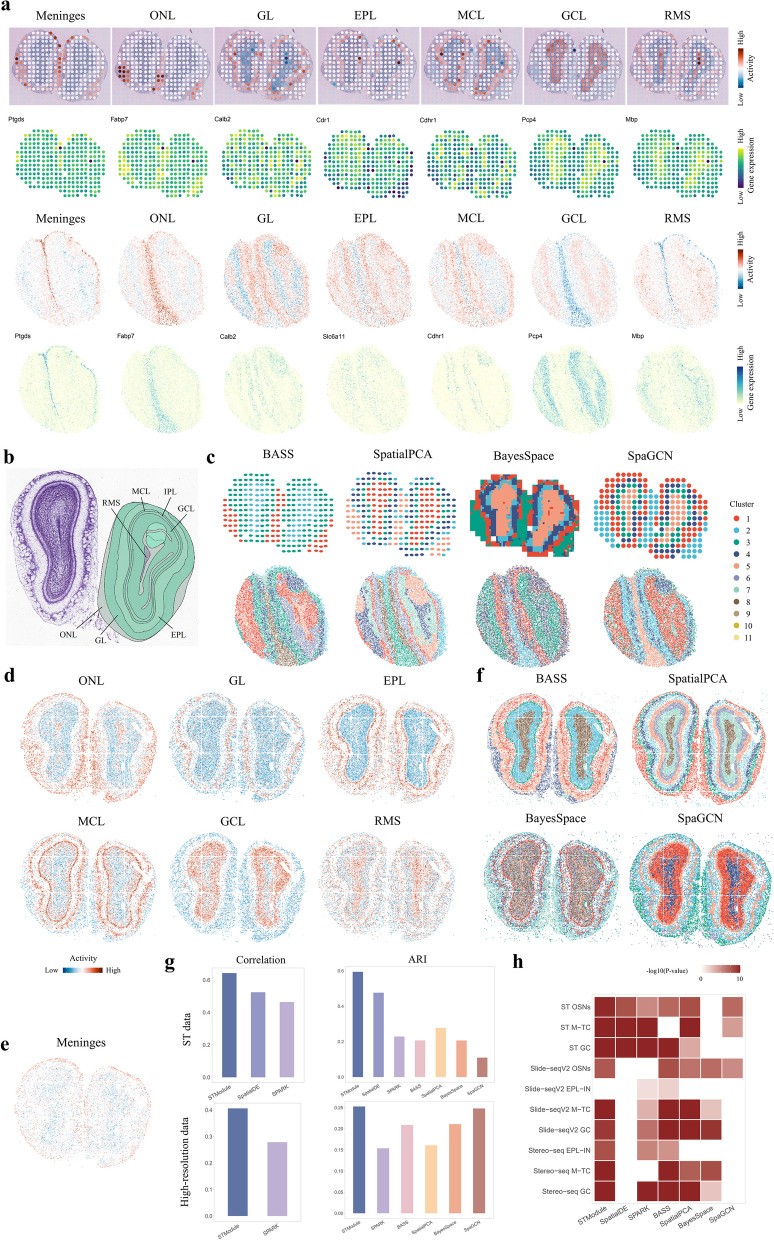
Here we present STModule, a Bayesian method developed to identify tissue modules from spatially resolved transcriptomics that reveal spatial components and essential characteristics of tissues. STModule uncovers diverse expression signals in transcriptomic landscapes such as cancer, intraepithelial neoplasia, immune infiltration, outcome-related molecular features and various cell types, which facilitate downstream analysis and provide insights into tumor microenvironments, disease mechanisms, treatment development, and histological organization of tissues. STModule captures a broader spectrum of biological signals compared to other methods and detects novel spatial components. The tissue modules characterized by gene sets demonstrate greater robustness and transferability across different biopsies. STModule: https://github.com/rwang-z/STModule.git .

Keywords: Bayesian model; Spatial expression components; Spatially resolved transcriptomics; Tissue module.


Conflict of interest statement

Declarations. Ethics approval and consent to participate: Not applicable. Consent for publication: Not applicable. Competing interests: The authors declare no competing interests.

Figures

Fig. 1
Fig. 1
Overview of STModule and simulation results. a STModule identifies spatially distributed tissue modules with the gene expression profile (Y) and spatial information of the profiled spots. b Evaluation and comparison of different methods in seven scenarios of the first set of simulations, including AUROC (top) and ARI (middle) for spatial pattern identification and FDR-Power curve for associated gene detection (bottom). The x and y axes of the FDR-Power curve represent FDR and Power, respectively. c Evaluation and comparison of the second set of simulations for layer-wise DLPFC data. Top, ARI of layer identification. Bottom, FDR-Power curve of layer-associated gene detection. d Comparison of ARI for layer identification in the third set of simulations for tissue-wise DLPFC data. Top, tissue-based simulations. Bottom, domain-based simulations
Fig. 2
Fig. 2
Results of the human pancreatic ductal adenocarcinoma dataset. a Spatial maps of tissue modules identified by STModule and spatial expression of representative associated genes. Colors indicate module activities or gene expression levels at different spots. b Histological annotation of sample A in the original study [4]. Red, cancer cells and desmoplasia. Yellow, duct epithelium. Blue, normal pancreatic tissue. c Representative spatial patterns identified by SpatialDE and SPARK. d Results of domain clustering methods. Colors indicate different clusters. e Additional spatial patterns identified by STModule with 15 modules. f Histological annotation of sample B in the original study [4] (left) and two tissue modules identified by STModule. Red, cancer cells and desmoplasia. Yellow, duct epithelium. Green, interstitium. g Spatial distributions of major cell types of sample A estimated by CARD. h Comparison of the methods in terms of correlation and ARI of identifying domains. i GSEA of associated genes detected by the methods. White color indicates adjusted P-value 0.05
Fig. 3
Fig. 3
Results of the human breast cancer dataset. a Spatial maps of tissue modules identified by STModule and spatial expression of representative associated genes. Colors indicate module activities or gene expression levels at different spots. b Histological annotation of the tissue section in the original study [13], containing invasive ductal cancer (INV) and six areas of ductal cancer in situ (DCIS) (1 to 6). c Illustration of most enriched Gene Oncology terms of representative modules. Color indicates the value of − log10(P-value). Dashed grey lines represent the threshold of P-value = 0.05. d Representative spatial patterns identified by SpatialDE and SPARK. e Results of domain clustering methods. Colors indicate different clusters. f Spatial distributions of cancer and CAFs estimated by CARD. g Comparison of the methods in terms of correlation and ARI of identifying domains in f. h GSEA of associated genes detected by the methods. White color indicates adjusted P-value 0.05. i Application of the tissue modules to the other three sections collected from the same biopsy. Spatial maps of modules I, IV, and VI in a are illustrated with manual alignment to the corresponding H&E-stained images
Fig. 4
Fig. 4
Application of STModule to other cancers. a,b Spatial maps of tissue modules identified by STModule from sample 1 (a) and sample 2 (b) of a melanoma dataset, including melanoma (I), transition area (II), and lymphoid tissue (III), along with spatial expression of representative associated genes. Colors indicate module activities or gene expression levels at different spots. c Histological annotations of the melanoma samples in the original study [51], including areas of melanoma (black), lymphoid (yellow), and stroma (red). d Results of domain clustering methods. e Histological annotations of samples P1.2 and P4.2 of prostate cancer in the original study [5] demonstrating regions of cancer Gs 3 + 3 (red), prostatic intraepithelial neoplasia (PIN) (orange), and chronic inflammation in stroma (purple). f Spatial maps of tissue modules identified by STModule from prostate sample P1.2 along with spatial expression of representative associated genes, including cancer (I −), PIN (I +), shared features of cancer and PIN (II), and center of cancer (III). g Spatial map of module I identified by STModule from prostate sample P4.2 representing inflammation along with spatial expression of associated gene AQP3. h The most highly enriched Gene Ontology terms of modules I and II in f. Color indicates the value of − log10(P-value). Dashed grey lines represent the threshold of P-value = 0.05. i Results of domain clustering methods. Colors indicate different clusters. j Comparison of the methods in terms of correlation and ARI of identifying major domains. k GSEA of associated genes detected by the methods. White color indicates adjusted P-value 0.05
Fig. 5
Fig. 5
Results of the human dorsolateral prefrontal cortex (DLPFC) (a-g) and mouse hippocampus (h-m) datasets. a Spatial maps of tissue modules identified by STModule from DLPFC sample 151676 along with spatial expression of representative associated genes. b Illustration of cortical layers (1 to 6) and white matter (WM) of DLPFC sample 151676 annotated by the original study [56]. c Results of domain clustering methods. Colors indicate different clusters. d Spatial maps of tissue modules identified by STModule from DLPFC sample 151510 (left) and spatial expression of representative associated genes (right). e Illustration of spatial structure of DLPFC sample 151510 annotated by the original study. f Comparison of the methods in layer identification for all twelve samples in the DLPFC dataset, evaluated by AUROC (left) and ARI (right). g GSEA of associated genes detected by the methods for DLPFC sample 151676. White color indicates adjusted P-value 0.05. h Spatial maps of tissue modules identified by STModule from the mouse hippocampus dataset profiled by Slide-seqV2. DG-sg, granule cell layer of dentate gyrus. CA3sp, pyramidal layer of cornu ammonis 3. CA1sp, pyramidal layer of cornu ammonis 1. i Spatial expression of representative associated genes of the tissue modules in h. j Annotation of mouse hippocampus structure from Allen Brain Atlas. k Results of domain clustering methods for the hippocampus sample. Colors indicate different clusters. l Comparison of the methods in terms of correlation and ARI of identifying major components of the hippocampus sample. m GSEA of associated genes detected by the methods for the hippocampus sample. White color indicates adjusted P-value 0.05 or not applicable
Fig. 6
Fig. 6
Results of the mouse olfactory bulb (MOB) datasets profiled by different technologies with various resolutions. a Spatial maps of tissue modules identified by STModule from MOB datasets profiled by ST (top) and Slide-seqV2 (bottom), along with spatial expression of representative associated genes. b Annotation of MOB structure from Allen Brain Atlas. ONL, olfactory nerve layer. GL, glomerular layer. EPL, external plexiform layer. MCL, mitral cell layer. IPL, internal plexiform layer. GCL, granule cell layer. RMS, rostral migratory stream. c Results of domain clustering methods for the MOB datasets profiled by ST (top) and Slide-seqV2 (bottom). d Spatial maps of tissue modules identified by STModule from MOB profiled by Stereo-seq. e Meninges of Stereo-seq MOB uncovered by the corresponding tissue module of ST MOB. f Results of domain clustering methods for MOB profiled by Stereo-seq. g Comparison of the methods in terms of correlation and ARI of identifying major components of the MOB samples profiled by ST (top), Slide-seqV2 and Stereo-seq (bottom). h GSEA of associated genes detected by the methods. White color indicates adjusted P-value 0.05 or not applicable

Similar articles

References

    1. Sun S, Zhu J, Zhou X. Statistical analysis of spatial expression patterns for spatially resolved transcriptomic studies. Nat Methods. 2020;17(2):193–200. - PMC - PubMed
    1. Arnol D, Schapiro D, Bodenmiller B, Saez-Rodriguez J, Stegle O. Modeling cell-cell interactions from spatial molecular data with spatial variance component analysis. Cell Rep. 2019;29(1):202–11. - PMC - PubMed
    1. Rao A, Barkley D, França G,S, Yanai I. Exploring tissue architecture using spatial transcriptomics. Nature. 2021:596(7871):211–220. - PMC - PubMed
    1. Moncada R, Barkley D, Wagner F, et al. Integrating microarray-based spatial transcriptomics and single-cell RNA-seq reveals tissue architecture in pancreatic ductal adenocarcinomas. Nat Biotechnol. 2020;38(3):333–42. - PubMed
    1. Berglund E, Maaskola J, Schultz N, et al. Spatial maps of prostate cancer transcriptomes reveal an unexplored landscape of heterogeneity. Nat Commun. 2018;9(1):1–13. - PMC - PubMed

LinkOut - more resources