. 2025 Jun;24(6):e70008.
doi: 10.1111/acel.70008. Epub 2025 Mar 3.

Rejuvenation of Senescent Cells, In Vitro and In Vivo, by Low-Frequency Ultrasound

Affiliations

Rejuvenation of Senescent Cells, In Vitro and In Vivo, by Low-Frequency Ultrasound

Sanjay K Kureel et al. Aging Cell. 2025 Jun.

Abstract

The presence of senescent cells causes age-related pathologies since their removal by genetic or pharmacological means, as well as possibly by exercise, improves outcomes in animal models. An alternative to depleting such cells would be to rejuvenate them to promote their return to a replicative state. Here we report that treatment of non-growing senescent cells with low-frequency ultrasound (LFU) rejuvenates the cells for growth. Notably, there are 15 characteristics of senescent cells that are reversed by LFU, including senescence-associated secretory phenotype (SASP) plus decreased cell and organelle motility. There is also inhibition of β-galactosidase, p21, and p16 expression, telomere length is increased, while nuclear 5mC, H3K9me3, γH2AX, nuclear p53, ROS, and mitoSox levels are all restored to normal levels. Mechanistically, LFU causes Ca2+ entry and increased actin dynamics that precede dramatic increases in autophagy and an inhibition of mTORC1 signaling plus movement of Sirtuin1 from the nucleus to the cytoplasm. Repeated LFU treatments enable the expansion of primary cells and stem cells beyond normal replicative limits without altering phenotype. The rejuvenation process is enhanced by co-treatment with cytochalasin D, rapamycin, or Rho kinase inhibition but is inhibited by blocking Sirtuin1 or Piezo1 activity. Optimized LFU treatment parameters increased mouse lifespan and healthspan. These results indicate that mechanically induced pressure waves alone can reverse senescence and aging effects at the cellular and organismal level, providing a non-pharmacological way to treat the effects of aging.

Keywords: aging; autophagy; calcium signaling; low frequency ultrasound; rejuvenation; senescence.


Conflict of interest statement

Authors (M.S., S.K.K., F.M., B.B.R. and R.M.) are co‐authors of patents related to these studies, and M.S. and F.M. have financial interests in a company, Mechanobiologics Inc. that is planning to market LFU devices suitable for senescent cell rejuvenation in vitro and in vivo.

Figures
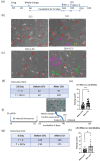
FIGURE 1
FIGURE 1
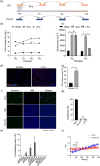
Fully senescent cells are rejuvenated for growth and motility by LFU. (a) The diagram shows the protocol used to produce fully senescent cells. Note that the timing of the Videos 1, 2, 3 are 48 h before and 48 h after LFU treatment for 30′, respectively. (b) Time‐lapse video images of a field with 18 Bleomycin sulfate (BS) treated cells incubated for 22 days at the beginning and the end of a 24 h observation period (red numbers). Images were taken every 30′. Two cells that entered the field during that period are marked with purple numbers and one that left the field with yellow. (c) Time‐lapse images of a field of 14 cells after a 30' LFU treatment at the beginning and the end of a 24 h observation period (red numbers). Three of the original cells divided (#s 5, 8 and 13) and the daughter cells are noted by green numbers. Five cells entered the field (purple numbers) and two left the field (yellow numbers). (d) Twenty‐eight image fields were tracked for 48 h before and for 48 h after LFU treatment and the number of cells in those fields were counted. (e) Cell velocity (determined by displacements of nuclei over each hour for 24 h). (f) Diagram of 4 days incubation of BS stressed cells with an image of β‐galactosidase staining of the cells after 4 days of incubation. Note the timing of the Videos 4 and 5 are for 48 h before and after LFU treatment. (g) Twenty‐eight image fields were tracked for 48 h before and after LFU treatment and the number of cells in the fields were counted. (h) The velocity of the cell movements was determined by measuring the displacements of the nuclei over each hour of imaging for 24 h. Results are shown as mean ± SD, at least 108 cells were analyzed, n > 3 experiments, and significance was determined using two‐tailed unpaired t‐test. *p < 0.05, **p < 0.002.
FIGURE 2
FIGURE 2
Low frequency ultrasound (LFU) reverses cell senescence. (a) Schematic illustration showing experimental design of LFU‐induced reversal of senescence after Sodium Butyrate (SB) treatment for 48 h followed by incubation for 4 days. Cells were treated with LFU for 30′ and then passaged every 2 days. (b) Growth of SB treated senescent Vero cells after LFU treatment and passaged every 48 h for 8–10 days. NSCs are the non‐senescent Vero cells. Graph shows growth of normal Vero cells (NSC), BS senescent (SC) and LFU‐treated (LFU) senescent cells as fold change in cell number over 48 h for passages from P0 to P3 every 48 h. (c) Cell area of LFU‐treated senescent cells (LFU) is largely restored to normal by P3. (d) Representative EDU‐stained images of senescent P3 control and LFU treated senescent P3 cells. Scale bar = 300 μm. (e) Quantification of EDU‐stained senescent and LFU treated BS senescent P3 cells shown as mean ± SD, for > 200 cells in each condition. (f) Annexin V staining for apoptosis of H2O2 (killed with 200 mM of H2O2) or of senescent (made senescent with 200 μM of H2O2) cells treated w/wo LFU after 48 h. (g) Percentage of viable cells after 200 mM of H2O2 or senescent cells (Doxorubicin 500 nM, and H2O2 200 μM) treated with LFU. Results are plotted as mean of three replicates and ± SD. At least 35–50 random cells were analyzed from each of the three replicates. Non‐parametric Mann Whitney test was used to determine the statistical difference between the two groups. (h) Proliferation of BS senescent cells with piezo1 or after siRNA knockdown of piezo1 (noted by KD) was determined from 12 h timelapse videos of the cells. The percentage of dividing cells was calculated by dividing the number of cell divisions by the total number of cells captured from 25 to 35 fields of view (> 200 cells). The drug concentrations were 25 nM of cytochalasin D and 10 μM of Yoda 1. Results are plotted as the mean of three independent experiments ± SD. (i) 25 nM cytochalasin D (black arrow). Administration of 25 nM of cytochalasin D (green arrow) does not change the basal Ca2+ level in senescent cells (red trace). However, when senescent cells were pre‐treated with 25 nM of cytochalasin D for 10 min and LFU was applied (black arrow), there was a slow increase in the basal Ca2+ level (blue trace). All graphs were plotted by mean ± SD and p values: Ns p > 0.05, *p < 0.05, **p < 0.002. Minimum 200 cells were analyzed from three independent experiments.
FIGURE 3
FIGURE 3
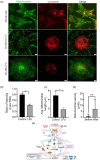
Low frequency ultrasound decreases mitochondrial length and lysosome staining intensity in senescent cells. (a) Representative immunofluorescent images of mitochondria and lysosome morphology in normal, senescent (BS–treated for 30 h and incubated for 3 days) and LFU–treated senescent Vero cells using Mitotracker and Lysosome tracker. Scale bar = 10 μm. (b) Ratio of total cell intensities of lysosomal to mitochondrial staining is decreased by LFU treatment of senescent cells. (c) Quantification of mitochondrial length shows decreased length after LFU treatment. Results are shown as mean ± SD, minimally 108 cells were analyzed, n > 3 experiments, and significance was determined using two‐tailed unpaired t‐test. *p < 0.05, **p < 0.002. (d) Velocity of mitochondria before and after LFU treatment. Images were capture every 5 s for 10 min. A minimum of 10–12 mitochondrial puncta were manually tracked using ImageJ software. (e) Illustration of a working model for the rejuvenation of senescent cells by LFU depicting the different pathways involved. The two main routes ‘A and B’ are represented by the blue and pink arrows, respectively. A involves the direct stimulation of senescent cells by LFU treatment. B implies a paracrine mode of rejuvenation achieved via secretory factors produced by treating normal cells with LFU. ‘C’ Inhibitors that show an antagonistic effect towards LFU treatment. ‘D’ Inhibitors and drugs that show a synergistic effect with LFU and thereby enhance rejuvenation. ‘E’ Various hallmarks of senescent cells that can be modulated by LFU treatment in the rejuvenated cells.
FIGURE 4
FIGURE 4
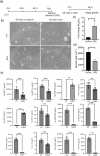
Normal cells treated with LFU secrete growth activating factors. (a) Timeline and strategy of LFU treatment in normal proliferating cells (passage 3 HFF cells). schematic showing normal cells that were treated with LFU four times in the same media. The supernatant was then collected (USS) for incubation with senescent cells for 48 h. (b) Brightfield images show changes in the morphology of senescent cells cultured in the supernatant collected from LFU‐treated normal cells and after 48 h. Senescent cells in normal growth medium were used as controls. (c) The graph shows that the growth of SCs in USS increased; (d) whereas the spread area of senescent cells decreased with USS. (e) Chemokines and cytokines in supernatants collected from untreated and LFU‐treated cells (P3 HFF) were analyzed using a Multiplex immunoassay. Results are plotted as mean ± SD, n = 6 replicates. Mann–Whitney Test was used to determine the statistical significance, ns = not significant, *p < 0.05, **p < 0.01, ***p < 0.0001, and ****p < 0.00001. Graphs were plotted as mean ± SD; *p < 0.05, **p < 0.002, ***p < 0.0001. At least 200 cells were analyzed from three independent experiments for graphs C and D. Scale bar = 300 μm.
FIGURE 5
FIGURE 5
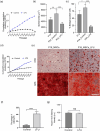
Ultrasound reversal of replicative senescence increases the number of cells. (a) Growth rate is shown as cumulative population doublings (CPD) for Control HFF and LFU treated HFF cells passaged every 48 h from P13 to P24 passage. LFU treatment was applied every other passage. (b) LFU treated cells were smaller than the P24 control and even than P13 cells. (c) Percentage of SA‐β‐galactosidase positive cells decreased after LFU treatment. (d) Similarly, LFU treatment of mesenchymal stem cells (MSCs) expanded the cell number between P10 and P19 passages. LFU treatment was also applied every other passage. (e) LFU treated MSCs showed normal differentiation to (ORO) adipocytes or (ARS) osteocytes. Oil red O staining dye marked lipid droplets (ORO) and alizarin red S dye marked osteogenesis (ARS). (f) Percentage of adipocytes were quantified in P18 MSCs treated with and without LFU. Results are plotted as mean of three independent experiments, a minimum of 100 cells were counted. (g) Quantification of osteocytes was determined by the intensity of alizarine Red S staining. Mean intensity was calculated from 10 random images of three independent experiments. Results are shown as mean ± SD, a minimum of 200 cells for spread area and 150 cells for percentage β‐galactosidase analysis were assessed, n > 3 experiments. Significance was determined using two tailed unpaired t‐test. *p < 0.05, **p < 0.002, ***p < 0.0001.
FIGURE 6
FIGURE 6
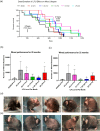
LFU significantly improves the physical performance and lifespan of old mice. (a), The graph shows the percentage survival curves of sham (11 mice) and LFU treated mice (with increasing LFU dosages, D3, D2, D1, 1.3X, and 2X). There were 8‐D1 mice with daily, 8‐D2 mice with every 2nd day, 6‐D3 mice with every 3rd day treatment at 1X power, plus 7–1.3X mice at 1.3X power and 6‐2X mice at 2X power treated daily. The sex of the mouse that died is denoted by an arrow for females and a vertical line for males. (b, c) Bar graphs showing mouse wheel running activity for sham, and all LFU treated mice cohorts at (c) 29 months and (d) 32 months age. Mice were treated with various LFU doses and then placed in the wheel cages. Wheel activity was measured for 3 days. Results are plotted as mean ± SD. Sham mice n = 6 and LFU treated mice n = 6–8, *p < 0.05 using two tailed unpaired t‐test. (d) The pictures show the side view of sham and (e), 2X LFU treated mice at 30 months of age. There is a video of a representative sham and a 2X mouse at 30 months that further illustrates the difference in activity of the mice (Videos 6 and 7, respectively). *p < 0.05.

References

    1. Adams, P. D. 2009. “Healing and Hurting: Molecular Mechanisms, Functions, and Pathologies of Cellular Senescence.” Molecular Cell 36, no. 1: 2–14. 10.1016/j.molcel.2009.09.021. - DOI - PubMed
    1. Ahmadi, F. , McLoughlin I. V., Chauhan S., and ter‐Haar G.. 2012. “Bio‐Effects and Safety of Low‐Intensity, Low‐Frequency Ultrasonic Exposure.” Progress in Biophysics and Molecular Biology 108, no. 3: 119–138. 10.1016/j.pbiomolbio.2012.01.004. - DOI - PubMed
    1. Alessio, N. , Aprile D., Cappabianca S., Peluso G., Di Bernardo G., and Galderisi U.. 2021. “Different Stages of Quiescence, Senescence, and Cell Stress Identified by Molecular Algorithm Based on the Expression of Ki67, RPS6, and Beta‐Galactosidase Activity.” International Journal of Molecular Sciences 22, no. 6: 3102. 10.3390/ijms22063102. - DOI - PMC - PubMed
    1. Austad, S. N. , and Fischer K. E.. 2016. “Sex Differences in Lifespan.” Cell Metabolism 23, no. 6: 1022–1033. 10.1016/j.cmet.2016.05.019. - DOI - PMC - PubMed
    1. Balbi, M. , Blackmore D. G., Padmanabhan P., and Gotz J.. 2022. “Ultrasound‐Mediated Bioeffects in Senescent Mice and Alzheimer's Mouse Models.” Brain Sciences 12, no. 6: 775. 10.3390/brainsci12060775. - DOI - PMC - PubMed

LinkOut - more resources