. 2025 Jan 14;28(2):111814.
doi: 10.1016/j.isci.2025.111814. eCollection 2025 Feb 21.

Urolithin A provides cardioprotection and mitochondrial quality enhancement preclinically and improves human cardiovascular health biomarkers

Affiliations

Urolithin A provides cardioprotection and mitochondrial quality enhancement preclinically and improves human cardiovascular health biomarkers

Sophia Liu et al. iScience. .

Abstract

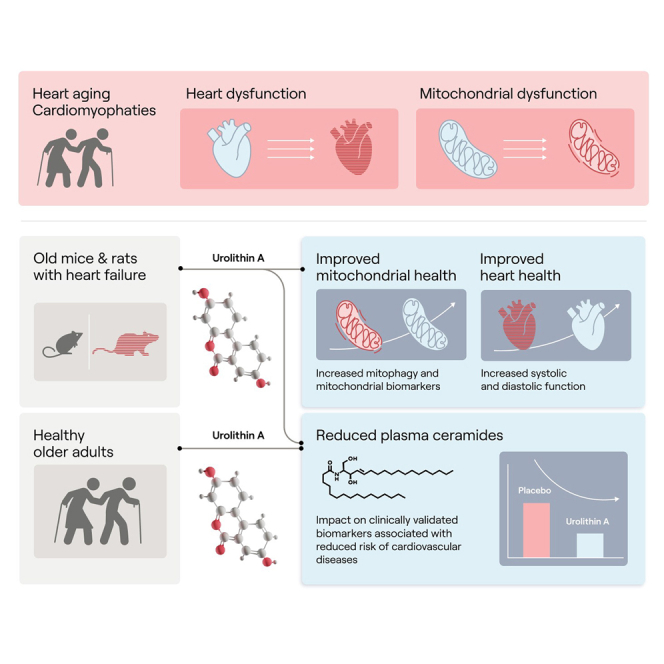
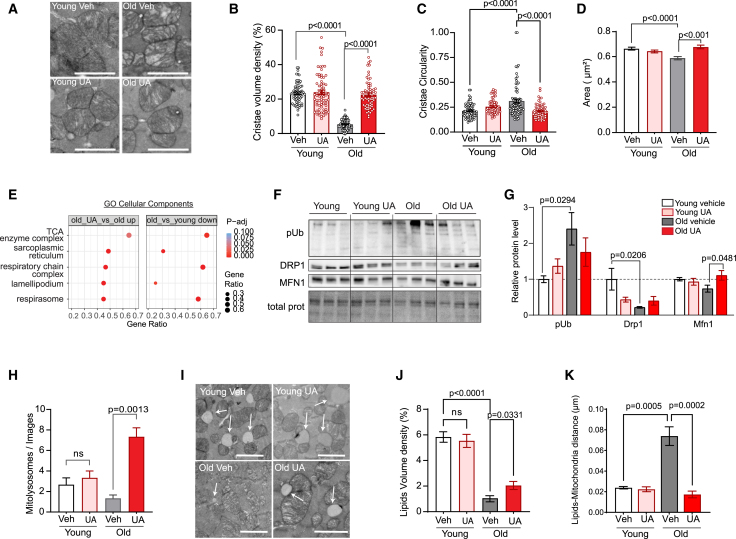
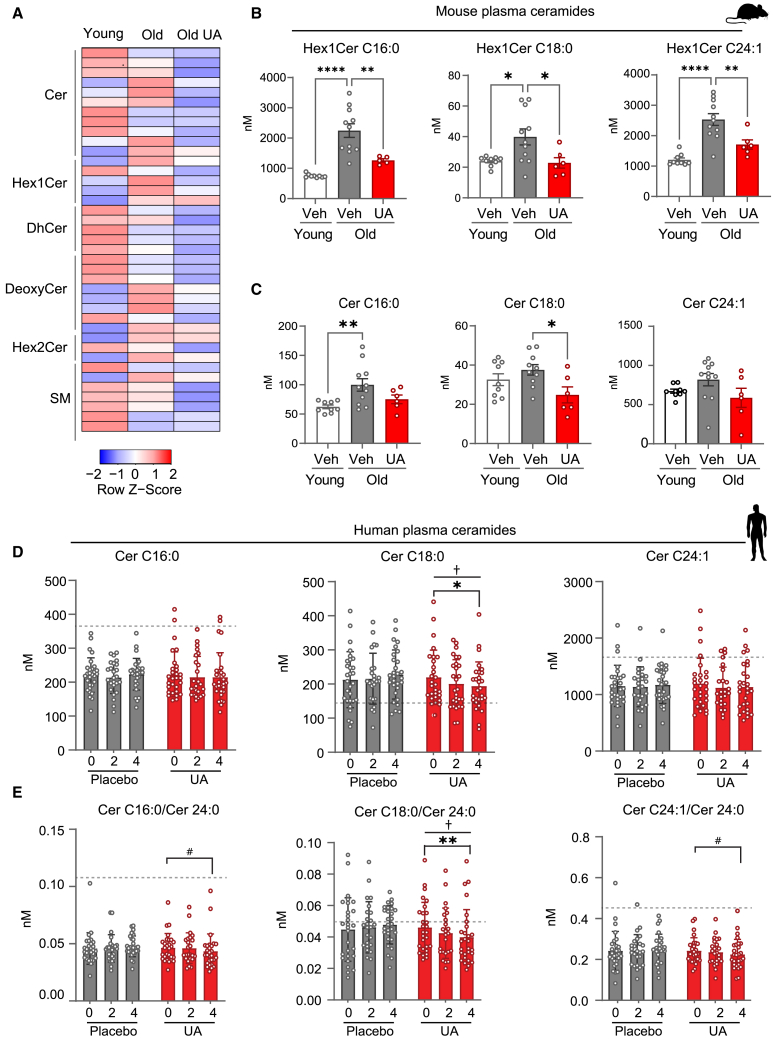
Cardiovascular diseases (CVDs) remain the primary cause of global mortality. Nutritional interventions hold promise to reduce CVD risks in an increasingly aging population. However, few nutritional interventions are proven to support heart health and act mostly on blood lipid homeostasis rather than at cardiac cell level. Here, we show that mitochondrial quality dysfunctions are common hallmarks in human cardiomyocytes upon heart aging and in chronic conditions. Preclinically, the post-biotic and mitophagy activator, urolithin A (UA), reduced both systolic and diastolic cardiac dysfunction in models of natural aging and heart failure. At a cellular level, this was associated with a recovery of mitochondrial ultrastructural defects and mitophagy. In humans, UA supplementation for 4 months in healthy older adults significantly reduced plasma ceramides clinically validated to predict CVD risks. These findings extend and translate UA's benefits to heart health, making UA a promising nutritional intervention to support cardiovascular function as we age.

Keywords: Biological sciences; Cardiovascular medicine; Health sciences; Internal medicine; Medical specialty; Medicine; Natural sciences; Physiology.


Conflict of interest statement

J.F., C.T., D.D., A.S., and C.R. are currently employees and P.A.A. was a past employee of Amazentis SA, which holds patents on UA applications. S.L. reported receiving drugs at no cost for research use from Stealth Biotherapeutics and supplements at no cost for research use from AstaReal outside the submitted work. D.J.M. reported receiving drugs at no cost for research use from Stealth Biotherapeutics, grants from Boehringer Ingelheim, and supplements at no cost for research use from AstaReal outside the submitted work. This research was supported by Amazentis SA and D.J.M. received support from NIH P01 AG001751.

Figures

None
Graphical abstract
Figure 1
Figure 1
Mitochondrial dysfunction is a common hallmark of human cardiac aging and disease (A) Venn diagram depicting overlap of significantly downregulated pathways (Gene Ontology cellular components [GO CCs]) among three human datasets: cardiac aging, dilated cardiomyopathy (DCM), and ischemic cardiomyopathy (ICM). GO CCs were identified using gene set enrichment analysis (GSEA) and categorized as “downregulated” based on their normalized enrichment scores. (B) Dot plot of five commonly suppressed GO CCs shared among all three datasets in (A). GO CCs are sorted by “cardiac aging” gene ratio. The size of each dot corresponds to the gene ratio, while the color indicates the statistical significance of the enrichment (Benjamini-Hochberg-adj. p value). (C) Heatmaps of scaled normalized expression counts (Z scores) of genes that contributed to the enrichment of the “mitochondrial inner membrane” GO CC term in human DCM and ICM compared to non-failing. Rows represent genes hierarchically clustered using a Euclidean distance metric and complete linkage. Columns represent individual samples from each condition. (D) Heatmaps of the scaled transcripts per million (TPM, as Z scores) of core enrichment genes contributing to the “mitochondrial inner membrane” GO CC term in the human cardiac aging study (GTEx aging). Rows represent genes hierarchically clustered using a Euclidean distance metric and complete linkage. Columns represent different age groups, sorted in ascending order. For each age group, mean TPM values were calculated for all genes before scaling. (E) Expression levels of top three most significantly downregulated genes in the “mitochondrial inner membrane” category comparing cardiac diseases (ICM and DCM) to controls (NF) (bar plot, top) or comparing age groups (scatterplot, bottom). For top panels adjusted p value is corrected for multiple-testing using the Benjamini and Hochberg (BH) method. ∗p < 0.05. Exact p values: NDUFS4 ICM vs. NF, p = 0.0001, NDUFS4 DCM vs. NF, p = 0.027. SDHB ICM vss. NF, p = 0.00009, SDHB DCM vs. NF, p = 0.0005. MRPL15 ICM vss. NF, p = 0.0001, MRPL15 DCM vs. NF, p = 0.0004. Lower panels: scatterplots showing TPM expression. Mean TPM values were calculated for each age group and connected with a line, displayed in ascending order of age groups. The color scale of the line represents the level of significance (false discovery rate [FDR]). Errors bars represent mean ± SEM. (F) Expression levels of downregulated genes related to mitophagy (PINK1, OPTN1) and mitochondrial quality (OPA1). Comparisons and statistical methods as in Figure 1E. For top plot adjusted p value is corrected for multiple-testing using the BH method. ∗p < 0.05, #p < 0.2. Exact p values: PINK1 ICM vs. NF, p = 0.004, PINK1 DCM vs. NF, p = 0.00003. OPTN ICM vss. NF, p < 0.00001, OPTN DCM vs. NF, p = 0.00003. OPA1 ICM vss. NF, p = 0.008, OPA1 DCM vs. NF, p = 0.17. Lower panel: scatterplots showing TPM expression. Mean TPM values were calculated for each age group and connected with a line, displayed in ascending order of age groups. The color scale of the line represents the level of significance (FDR. Errors bars represent mean ± SEM.
Figure 2
Figure 2
UA protects against cardiac dysfunction in a rat model of heart failure (A) Study schematics of surgery, treatments, and echocardiography timeline for control rats (Sham), rats with myocardial infarction (MI) and MI rats treated with urolithin A (MI + UA). (B) Representative images of M-mode measurement of the left ventricle structure used assess cardiac function and cardiac remodeling. (C and D) Ejection fraction (EF) and fractional shortening (FS) measured as percentage change comparing end of the study to the start of the treatment (1 week time point). ∗p < 0.05, ∗∗∗p < 0.005 and ∗∗∗∗p < 0.001 after one-way ANOVA. Error bars represent mean ± SEM. (E) Measure of the isovolumic relaxation time (IVRT), as aforementioned. ∗∗∗p < 0.005 after one-way ANOVA. Error bars represent mean ± SEM. (F) Representative images of echo Doppler for Sham, MI, and MI + UA group used to measure diastolic function. (G and H) Telesystolic volume (G) and telediastolic volume (H) expressed as milliliters in the indicated groups at the end of the study. ∗p < 0.05, ∗∗∗p < 0.005 and ∗∗∗∗p < 0.001 after one-way ANOVA. Error bars represent mean ± SEM. (I–K) Representative images of left ventricle stained with Sirus-RED (I). Corresponding quantification of infarct area expressed as arbitrary units and fold change over sham (J) and of the apical fibrosis percentage expressed as percentage over total LV area (K). (L) Measure of the left ventricle weight expressed as milligrams over tibia length at the end of the study in the indicated groups. ∗∗p < 0.01 after Tukey’s multiple comparisons test. Error bars represent mean ± SEM. Number of replicates: Sham (n = 10), MI (n = 19) and MI + UA (n = 17). For (E): Sham (n = 10), MI (n = 18) and MI + UA (17). For (J) and (K): MI (n = 11) and MI + UA (9).
Figure 3
Figure 3
UA rescues defects in mitochondrial gene expression in rats with heart failure (A) Venn diagram depicting overlap of significantly enriched Gene Ontology cellular components (GO CCs) identified by gene set enrichment analysis (GSEA). Top diagram shows GO CCs suppressed in myocardial infarction (MI) versus sham and rescued by UA (“MI UA vs. MI”). Lower panel: similar as aforementioned, depicting GO CCs that are activated in the “MI vs. Sham” comparison and suppressed in the “MI UA vs. MI” comparison. (B) Stacked bar graphs summarizing the 8 common GO CCs depicted in (A, upper panel). The x axis represents the normalized enrichment score (NES), indicating the level of suppression (negative values) or activation (positive values). The “MI vs. Sham” comparison is represented in gray, while the “MI UA vs. MI” comparison is shown in red. (C) Heatmaps displaying scaled normalized expression counts (Z scores) of the genes that contributed to the enrichment of the “respiratory chain complex” GO CC term in both “MI vs. Sham” and “MI UA vs. MI” comparisons (respectively suppressed and activated). Rows represent genes and were hierarchically clustered using a Euclidean distance metric and complete linkage. Columns represent individual samples from each condition. (n = 4). (D and E) Representative images of left ventricles (LV) stained for VDAC (green) and phospho-ubiquitin (ph-UB, red) in the indicated groups. Nuclei were stained in blue with DAPI. Quantification of the number of particles corresponding to ph-Ub staining (E). (n = 54 images/group) ∗p = 0.0266; ∗∗∗∗p < 0.0001 after one-way ANOVA Kruskal Wallis test. Error bars represent mean ± SEM.
Figure 4
Figure 4
UA improves aging cardiac function and skeletal muscle force (A) Study schematics of both young and old mice feeding and experimental timeline. (B) Representative image of echo Doppler flow measure used to assess diastolic function. (C and D) Diastolic function of blood flow across the mitral valve in early diastole (Ea/E′) to the flow in late diastole (Aa/A′). Diastolic function represents early to late diastole ratio (E′/A′) in young and aged mice (C) and change in E′/A′ (post-treatment–baseline) in aged mice (D) ∗∗∗∗p < 0.001 after Welch t test. Error bars represent mean ± SEM. (E) Representative image of M mode short axis to assess left ventricle. ∗∗∗p < 0.005 after one-way ANOVA. Error bars represent mean ± SEM. (F) Fractional shortening (FS%) under high workload (HWL) and low workload (LWL). ∗p < 0.05 and ∗∗∗∗p < 0.001 after two-way ANOVA. Error bars represent mean ± SEM. (G and H) Ejection fraction at endpoint (G) and change in ejection fraction (H) in aged animals. p value = ns after one-way ANOVA. Error bars represent mean ± SEM. ∗p < 0.05 after t test. Error bars represent mean ± SEM. (I) Left ventricle mass from heart weights after sacrifice expressed in milligrams. ∗p < 0.05 after one way ANOVA. Error bars represent mean ± SEM. (J) Maximal torque of plantar flexor by nerve stimulation expressed as changes over baseline. ∗p < 0.05 after t test. Error bars represent mean ± SEM. Animal replicates: cardiac data: young = 9, old = 10, old + UA = 15; skeletal muscle data: old = 7, old + UA = 13.
Figure 5
Figure 5
UA improves heart mitochondrial ultrastructure, morphology and function in old mice (A–C) Representative heart transmission electron microscopy (TEM) of transversal images of young and old mice administered with either vehicle or UA for 2 months (A) and corresponding quantification of mitochondrial cristae density (B) and circularity (C). n = 75 mitochondria/group. ∗∗∗∗p < 0.001 after one-way ANOVA. Error bars represent mean ± SEM. Scale bars: 500 nm. (D) Quantification of mitochondrial area in transversal orientation in young and old mice from vehicle and UA groups (n = 3 animal/group). ∗∗∗p < 0.005 after one-way ANOVA. Error bars represent mean ± SEM. (E) Gene set enrichment analysis from house heart aging RNA-seq data describing Gene Ontology (GO) cellular component gene sets that are significantly repressed with cardiac aging (old vs. young down) and significantly rescued by UA administration to old mice (old UA vs. old up). The size of each dot corresponds to the gene ratio, while the color indicates the statistical significance of the enrichment (Benjamini-Hochberg-adj. p value). (F and G) Representatives immunoblot of phospho-ubiquitin, DRP1, MFN1 and stain free blot of total proteins (F) and quantification of phospho-ubiquitin, DRP1, and MFN1 (G) protein content normalized over their corresponding total protein stain free blot (N = 6 animal/group). p value. ∗p < 0.05 after one-way ANOVA. Error bars represent mean ± SEM. (H) Mitolysosome events quantification in young and old mice treated as indicated (n = 3 animal/group). ∗∗∗∗p < 0.001 after one-way ANOVA. Error bars represent mean ± SEM. (I–K) Representative images with arrows pointing to lipid droplets (I) and their quantification of volume density expressed as percentage over total area in the indicated animals (J) and quantification of the distances between lipids and mitochondria (n = 3 animal/group) on the two-dimensional electron micrographs (K). p value. ∗∗∗p < 0.005; ∗∗∗∗p < 0.001 after one-way ANOVA. Error bars represent mean ± SEM. Scale bars: 500 nm.
Figure 6
Figure 6
UA lowers plasma ceramides linked to increased CVD risk in mice and humans (A) Heatmap representing the concentration of different sphingolipid species in the plasma of mice. Values represent row Z scores. Cer, ceramides; Hex1Cer, hexosyl-1-ceramides; DhCer, dihydroceramides; Deoxycer, deoxyceramides; Hex2Cer, hexosyl-2-ceramides; SM, sphingomyelins. (B and C) Concentrations of Hex1Cer, C16:0, C18:1, and C24:1 (B) and ceramides C16:0, C18:0, and C24:1 (C) in plasma of the indicated mice groups. p value. ∗p < 0.05; ∗∗p < 0.01; ∗∗∗∗p < 0.001 after one-way ANOVA. Error bars represent mean ± SEM. Number of animals: young vehicle (n = 9), old vehicle (n = 11), and old UA (n = 6). Detailed statistical information indicating exact p values and fold change values in Table S5. (D) Concentrations of ceramides C16:0, C18:0, and C24:1 (C) in plasma of healthy elderly subjects supplemented with either placebo or urolithin A (1 g) at baseline (0), after 2 months or 4 months #p < 0.1, ∗p < 0.05, ∗∗p < 0.01, ANCOVA comparing single time point over baseline and within treatment groups; p < 0.05 ANCOVA, visit effect (baseline vs. 2 months vs. 4 months). (E) Ratio of plasma concentrations of ceramides C16:0, C18:0, and C24:1 as in (C) over the plasma concentration of the housekeeping ceramide C24:0. #p < 0.1, ∗p < 0.05, ∗∗p < 0.01, ANCOVA comparing single time point over baseline and within treatment groups; p < 0.05 ANCOVA, visit effect (baseline vs. 2 months vs. 4 months) and within treatment groups. Error bars represent mean ± SEM. Number of replicates: placebo baseline (n = 29), placebo 2 months (n = 25), and placebo 4 months (n = 29). UA baseline (n = 29), placebo 2 months (n = 25), and placebo 4 months (n = 29). Detailed statistical information indicating exact p values and fold change values in Table S5.

References

    1. Birger M., Kaldjian A.S., Roth G.A., Moran A.E., Dieleman J.L., Bellows B.K. Spending on Cardiovascular Disease and Cardiovascular Risk Factors in the United States: 1996 to 2016. Circulation. 2021;144:271–282. - PMC - PubMed
    1. Yazdanyar A., Newman A.B. The burden of cardiovascular disease in the elderly: morbidity, mortality, and costs. Clin. Geriatr. Med. 2009;25:563–577. - PMC - PubMed
    1. Paneni F., Diaz Cañestro C., Libby P., Lüscher T.F., Camici G.G. The Aging Cardiovascular System: Understanding It at the Cellular and Clinical Levels. J. Am. Coll. Cardiol. 2017;69:1952–1967. - PubMed
    1. Barasch E., Gottdiener J.S., Aurigemma G., Kitzman D.W., Han J., Kop W.J., Tracy R.P. Association between elevated fibrosis markers and heart failure in the elderly: the cardiovascular health study. Circ. Heart Fail. 2009;2:303–310. - PMC - PubMed
    1. Rondelli R.R., Dal Corso S., Simões A., Malaguti C. Methods for the assessment of peripheral muscle fatigue and its energy and metabolic determinants in COPD. J. Bras. Pneumol. Publicacao Of. Soc. Bras. Pneumol. E Tisilogia. 2009;35:1125–1135. - PubMed

LinkOut - more resources