. 2025 Jan 31;33(1):101425.
doi: 10.1016/j.omtm.2025.101425. eCollection 2025 Mar 13.

Generation and GMP scale-up of human CAR-T cells using non-viral Sleeping Beauty transposons for B cell malignances

Affiliations

Generation and GMP scale-up of human CAR-T cells using non-viral Sleeping Beauty transposons for B cell malignances

Begoña Diez et al. Mol Ther Methods Clin Dev. .

Abstract

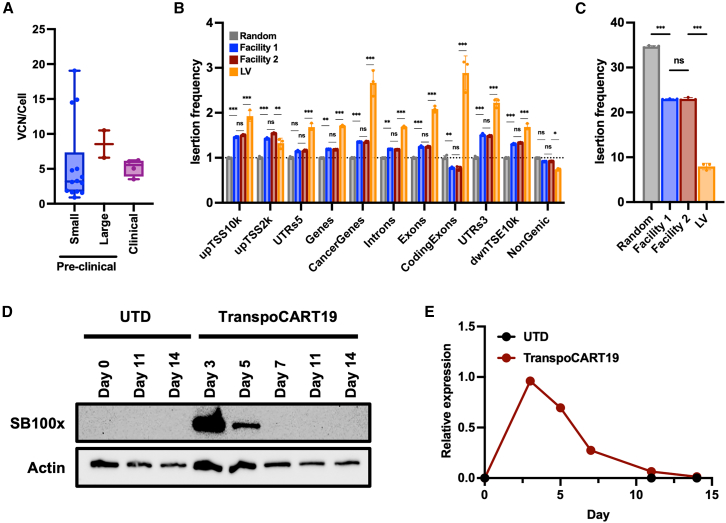
Most CAR-T therapies rely on genetic T cell engineering with integrating viral vectors that, although effective, are associated with prohibitive costs. Here we have generated TranspoCART19 cells, a fully functional 4-1BB second-generation CAR-T cell product targeting CD19, fused to a truncated version of the human EGFR (hEGFRt) as reporter gene and safety switch, based on the Sleeping Beauty transposon delivery system. Our manufacturing protocol allowed generation of TranspoCART19 cells under GMP conditions, showing similar in vitro and in vivo antitumoral efficacy than conventional CAR-T cells generated with lentiviral vectors. Additionally, membrane expression of hEGFRt facilitated in vivo CAR-T cell elimination after cetuximab administration. Safety analyses showed that TranspoCART19 cells presented low vector copy numbers and close-to-random vector integration profiles. Moreover, final TranspoCART19 products lacked non-integrated genomic material used for the generation of CAR-T cells and were free from transposase protein. In vivo biodistribution analyses revealed that TranspoCART19 cells were mainly present in hematopoietic organs with no gender bias. Altogether, this study provides a cost-effective, GMP-compliant manufacturing process for the generation of CAR-T cells using non-viral vectors. These results have supported the approval of a clinical trial to evaluate TranspoCART19 cells in patients with relapsed/refractory lymphoma (NCT06378190) that is currently ongoing.

Keywords: ATMPs; B cell lymphoma; CAR-T cells; Sleeping Beauty transposons.


Conflict of interest statement

Z.I. is an inventor on patents related to Sleeping Beauty and MC technology.

Figures

None
Graphical abstract
Figure 1
Figure 1
Optimization of TranspoCART19 cell production (A) Schematic representation of the TranspoCART19 construct, a 4-1BB second-generation construct targeting CD19, fused to a truncated version of the human EGFR (hEGFRt) as a reporter gene and safety switch. (B) Transfection efficiency (EGFR+ cells) of primary T cells 14 days after electroporation with MC expressing CAR and SB100X mRNA. Two different electroporation devices were used. D1: Lonza 4D-Nucleofector System (n = 9). D2: MaxCyte ExPERT GTx Flow Transfection System electroporator (n = 6). Graph represents mean and 25 and 75 percentiles and SD. (C) Transfection efficiency at 14 days after T cell electroporation using different MC:mRNA ratios on D2. (D) Evaluation of TranspoCART19 cells expansion at two different seeding densities (106 and 2 × 106 cells/cm2) in the P-6M G-Rex bioreactors. Graph represents the mean ± SD (n = 3). (E) Evaluation of TranspoCART19 cells expansion in the presence/absence of cytokines (IL-7 and IL-15) added at the middle of the expansion period. Graph represents the mean ± SD (n = 2). Unpaired t test (B), two-way ANOVA with Tukey’s multiple comparisons test (D and E). ns: not significant; ∗p < 0.05; ∗∗p < 0.01, ∗∗∗p < 0.001.
Figure 2
Figure 2
Phenotypic characterization of TranspoCART19 cells (A) Expansion of TranspoCART19 cells generated from three patients with different CD19+ malignancies (two ALL and one DLBCL) and four healthy donors (HD) during CAR-T cell production. (B) Percentage of transduced cells at the end of TranspoCART19 cell production. Graph represents the percentage of CAR+ cells (EGFR+) in different lymphocyte subpopulations in HD and patients. (C) Analysis of CD4/CD8 ratio in basal T cells (day 0) and TranspoCART19 cells at end of expansion period (day 12–14) in HDs and patients. (D) Analysis of the phenotype of basal T cells (day 0) and TranspoCART19 cells at end of expansion period (day 12–14) in HDs and patients. CAR-T cell subpopulations within CD4+ and CD8+ cells are depicted. TN: naive; TSCM: stem central memory; TCM: central memory; TEM: effector memory; TE: effector. (E) Analysis of the expression of activation marker (CD69, CD137, HLA-DR, and ICOS) in TranspoCART19 cells from HDs and patients at end of expansion period (days 12–14). (F) Analysis of the expression of inhibition marker (LAG3, PD1 and TIM3) in TranspoCART19 cells from HDs and patients at end of the expansion period (days 12–14). Mean ± SD for each group is depicted. two-way ANOVA with Tukey’s multiple comparisons test (A, B, C, E, and F). ns: not significant; ∗p < 0.05; ∗∗p < 0.01, ∗∗∗p < 0.001.
Figure 3
Figure 3
Functional characterization of TranspoCART19 cells (A) Quantification of the cytotoxic activity of TranspoCART19 cells generated from HD (n = 4) and patients (n = 3), against CD19+ tumoral cell line NALM6 at different E:T ratio. The percentage of specific lysis for each CAR-T cell production is depicted. (B) Quantification of IFN-γ and IL-2 levels in supernatants from cytotoxic assays measured by ELISA. (C) Survival of mice treated with TranspoCART19 cells from HDs (n = 17) or ALL (n = 13) or ML patients (n = 6). Untreated animals (n = 16), treated with UTD cells (n = 14) or with CAR-T cells produced with lentiviral vectors (LVs, n = 5) were use as controls. (D) Bioluminescence analysis of animals treated with TranspoCART19 cells or with CAR-T cells produced with lentiviral vectors (CART19-LVs), both from healthy donors. Untreated animals (PBS) or treated with untransduced (UTD) cells were used as control. Bioluminescence images were acquired at indicated time points after treatment. (E) Quantification of NALM6 tumoral cells (GFP) at different times after CAR-T cell administration by flow cytometry. Two-way ANOVA with Tukey’s multiple comparisons test (A). Log rank (Mantel-Cox) test (D). ns: not significant; ∗p < 0.05; ∗∗p < 0.01, ∗∗∗p < 0.001.
Figure 4
Figure 4
Characterization of pre-clinical large-scale pTranspoCART19 cell production Large-scale TranspoCART19 production was performed in two different facilities starting from the same fresh sample from an HD (n = 3 each). (A) Evaluation of TranspoCART19 cell expansion at 11 days after electroporation. (B) Percentage of transduced cells at the end of TranspoCART19 cell productions. Graph represents the percentage of CAR+ cells (EGFR+) in different lymphocyte subpopulations. (C) Analysis of CD4/CD8 ratio in TranspoCART19 cells at end of expansion period. (D) Analysis of the phenotype of TranspoCART19 cells at end of expansion period. CAR-T cell subpopulations within CD4+ and CD8+ cells are depicted. TN: naive; TSCM: stem central memory; TCM: central memory; TEM: effector memory; TE: effector. (E) Analysis of the expression of activation marker (CD69, CD137, HLA-DR, and ICOS) in TranspoCART19 cells at end of the expansion period. (F) Analysis of the expression of inhibition marker (CTLA-4, LAG3, PD1, TIGIT, and TIM3) in TranspoCART19 cells at end of the expansion period. (G) Quantification of the cytotoxic activity of TranspoCART19 cells against CD19+ tumoral cell line NALM6 at different E:T ratio. The percentage of specific lysis for each CAR-T cell production is depicted.
Figure 5
Figure 5
Safety analysis of TranspoCART19 cells (A) Analysis of the vector copy number integrations in small pre-clinical (n = 14), large pre-clinical (n = 2) and clinical validations (n = 4) of TranspoCART19 productions. (B) Histogram plot showing the genomic distribution of vector integration sites in TranspoCART19 cells from pre-clinical large-scale validations produced in two different GMP facilities. Mean fold changes above the random expected insertion frequency (set to 1) are shown on the y axis. upTSS10k/upTSS2k: up to 10 or 2 kb upstream of transcriptional start sites, respectively; dwnTSE10k: up to 10 kb downstream of transcriptional end sites. (C) Histogram plot showing vector integration sites located at unified safe harbor categories in TranspoCART19 cells from pre-clinical large-scale validations. (D) Western blot analysis of SB100x transposase at different times during the manufacturing period of TranspoCART19 cells. UTD cells were used as controls. (E) Quantification of non-integrated MCs by qPCR at different times during the manufacturing period of TranspoCART19 cells. UTD cells were used as control. One-way ANOVA with Tukey’s multiple comparisons test (A and C). Two-way ANOVA with Tukey’s multiple comparisons test (B). ns: not significant; ∗p < 0.05; ∗∗p < 0.01, ∗∗∗p < 0.001.
Figure 6
Figure 6
Evaluation of safety switch and biodistribution studies in TranspoCART19 cells (A) Schematic representation of the experimental design to evaluate hEGFRt as a safety switch. Sub-lethally irradiated animals were transplanted with 106 NALM6 cells, and 4 days later animals were treated with 5 × 106 TranspoCART19 cells. Cetuximab (1 mg/mouse) was administered from day 6 to day 11. (B) Quantification of human CD45+CD3+ cells in blood samples obtained from treated animals on days 4, 8, 11, and 15 after TranspoCART19 cell administration. As controls, animals treated with PBS were included. (C) Quantification of the percentage of hEGFRt+ cells within the CD45+CD3+ cells in blood samples obtained from animals treated with cetuximab or control IgG1 on day 15 after TranspoCART19 cell administration. (D) Quantification of human CD45+ (upper panel) and EGFR+ cells (lower panel) in different organs (bone marrow, peripheral blood, spleen, lung, and liver) of male and female animals (n = 4–6) treated with TranspoCART19 cells at different time points (days 7, 14, and 21). Mean ± SD is represented. Mixed effect model (REML) with Tukey’s multiple comparisons test (B). ns: not significant; ∗p < 0.05; ∗∗p < 0.01, ∗∗∗p < 0.001.

References

    1. Jackson H.J., Rafiq S., Brentjens R.J. Driving CAR T-cells forward. Nat. Rev. Clin. Oncol. 2016;13:370–383. doi: 10.1038/nrclinonc.2016.36. - DOI - PMC - PubMed
    1. Neelapu S.S., Locke F.L., Bartlett N.L., Lekakis L.J., Miklos D.B., Jacobson C.A., Braunschweig I., Oluwole O.O., Siddiqi T., Lin Y., et al. Axicabtagene Ciloleucel CAR T-Cell Therapy in Refractory Large B-Cell Lymphoma. N. Engl. J. Med. 2017;377:2531–2544. doi: 10.1056/nejmoa1707447. - DOI - PMC - PubMed
    1. Schuster S.J., Bishop M.R., Tam C.S., Waller E.K., Borchmann P., McGuirk J.P., Jäger U., Jaglowski S., Andreadis C., Westin J.R., et al. Tisagenlecleucel in adult relapsed or refractory diffuse large B-cell lymphoma. N. Engl. J. Med. 2019;380:45–56. doi: 10.1056/NEJMoa1804980. - DOI - PubMed
    1. Maude S.L., Laetsch T.W., Buechner J., Rives S., Boyer M., Bittencourt H., Bader P., Verneris M.R., Stefanski H.E., Myers G.D., et al. Tisagenlecleucel in children and young adults with B-cell lymphoblastic leukemia. N. Engl. J. Med. 2018;378:439–448. doi: 10.1056/NEJMoa1709866. - DOI - PMC - PubMed
    1. Fowler N.H., Dickinson M., Dreyling M., Martinez-Lopez J., Kolstad A., Butler J., Ghosh M., Popplewell L., Chavez J.C., Bachy E., et al. Tisagenlecleucel in adult relapsed or refractory follicular lymphoma: the phase 2 ELARA trial. Nat. Med. 2022;28:325–332. doi: 10.1038/s41591-021-01622-0. - DOI - PubMed

Associated data