. 2025 Jan 10;10(3):101713.
doi: 10.1016/j.adro.2025.101713. eCollection 2025 Mar.

Integrating Radiosensitivity Index and Radiation Resistance Related Index Improves Prostate Cancer Outcome Prediction

Affiliations

Integrating Radiosensitivity Index and Radiation Resistance Related Index Improves Prostate Cancer Outcome Prediction

Qi-Qiao Wu et al. Adv Radiat Oncol. .

Erratum in

Abstract

Purpose: This study aimed to establish a nomogram combining 31-gene signature (31-GS), radiosensitivity index (RSI), and radiation-resistance-related gene index (RRRI) to predict recurrence in prostate cancer (PCa) patients.

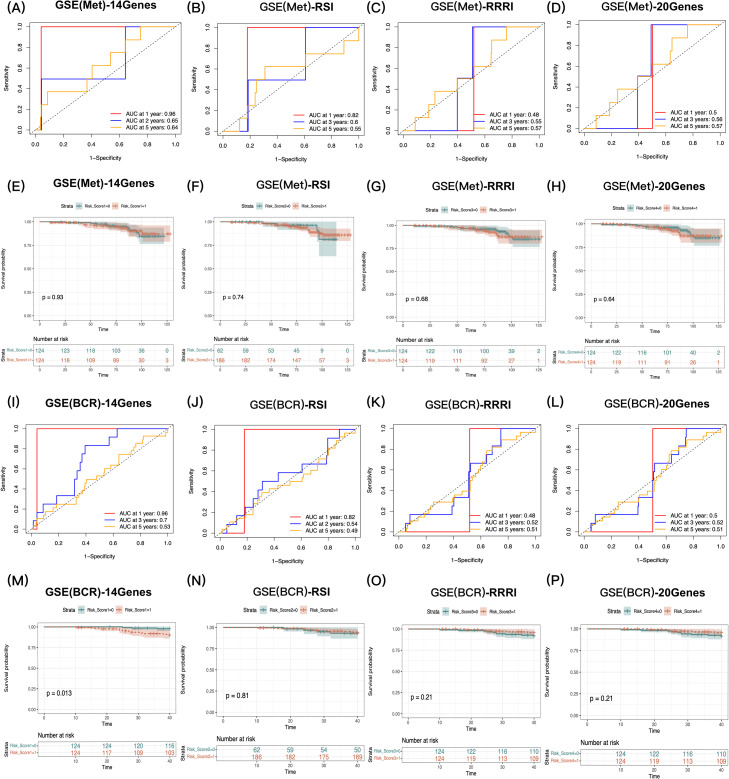
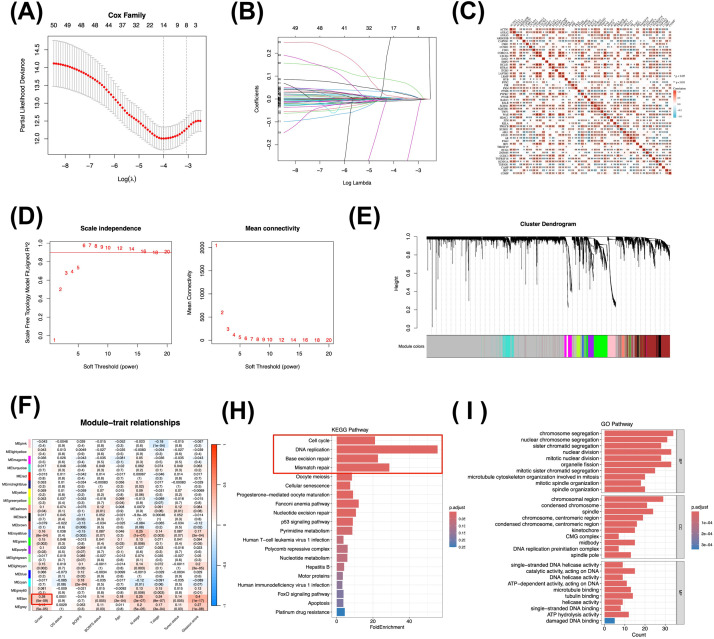
Methods and materials: Transcriptome data of PCa were obtained from gene expression omnibus and the cancer genome atlas to validate the predictive potential of 3 sets of published biomarkers, namely, 31-GS, RSI, and RRRI. To adjust these markers for the characteristics of PCa, we analyzed 4 PCa-associated radiosensitivity predictive indices based on 31-GS, RSI, and RRRI by the Cox analysis and least absolute shrinkage and selection operator regression analysis. Time-dependent receiver operating characteristic curves, decision curve analyses, integrated discrimination improvement, net reclassification improvement and decision tree model construction were used to compare the radiosensitivity predictive ability of these 4 gene signatures. Key modules and associated functions were identified through a weighted gene co-expression network analysis and gene function enrichment analysis. A nomogram was built to improve the recurrence-prediction capability.

Results: We validated and compared the predictive potential of 2 published predictive indices. Based on the 31-GS, RSI, and RRRI, we analyzed 4 PCa-associated radiosensitivity predictive indices: 14Genes, RSI, RRRI, and 20Genes. Among them, 14Genes showed the most promising predictive performance and discriminative capacity. Genes in the key module defined by the 14Genes model were significantly enriched in radiation therapy-related cell death pathways. The area under receiver operating characteristic curve and decision tree variable importance for 14Genes was the highest in the cancer genome atlas and Gene Expression Omnibus Series (GSE) cohorts.

Conclusions: This study successfully established a radiosensitivity-related nomogram, which had excellent performance in predicting recurrence in patients with PCa. For patients who received radiation therapy, the 20Genes and RRRI models can be used to predict recurrence-free survival, whereas 20Genes is more radiation therapy-specific but needs further external validation.


Conflict of interest statement

The authors declare that they have no known competing financial interests or personal relationships that could have appeared to influence the work reported in this paper.

Figures

Figure 1
Figure 1
(A-D) Time-ROC curves for 1-year, 3-year, and 5-year RFS prediction between different risk models in TCGA (training cohort); (E-H) KM analysis of different risk models for their RFS; (I-L) KM analysis of different risk models for their RFS in patient group who received RT; and (M-P) KM analysis of different risk models for their RFS in patient group who did not received RT. Abbreviations: ROC = receiver operating characteristic; RFS = recurrence-free survival; TCGA = the cancer genome atlas; RT = radiation therapy.
Figure 2
Figure 2
(A-D) Time-ROC curves for 1-year, 3-year, and 5-year metastasis-free survival prediction between different risk models in GSE116918 (validating cohort); (E-H) KM analysis of different risk models for their metastasis-free survival; (I-L) Time-ROC curves for 1-year, 3-year, and 5-year biochemical recurrence-free survival prediction between different risk models in GSE116918 (validating cohort); (M-P) KM analysis of different risk models for their biochemical recurrence-free survival.
Figure 3
Figure 3
(A) 14Genes expression between difference Stages; (B) 14Genes expression between difference Gleason Scores; (C) RSI expression between difference Stages; (D) RSI expression between difference Gleason Scores; (E) RRRI expression between difference Stages; (F) RRRI expression between difference Gleason Scores; (G) 20Genes expression between difference Stages; (H) 20Genes expression between difference Gleason Scores (*P < .05; **P < .01; ***P < .001.); (I) Univariate Cox Regression Forrest plot of the 50 genes. (I) Univariate Cox regression of 50 genes. Abbreviation: RRRI = radiation-resistance-related gene index.
Figure 4
Figure 4
(A) Construction of lasso-Cox model and 14Genes (B) Log (lambda) value of the 50 genes in LASSO regression analysis; (C) correlation heatmap between 31-GS, RSI and RRRI genes; (D) Soft threshold (power = 10) and scale-free topology fit index (R2 = 0.90) (E) Gene hierarchy tree-clustering diagram. The graph indicates different genes horizontally and the uncorrelatedness between genes vertically, the lower the branch, the less uncorrelated the genes within the branch, ie, the stronger the correlation; (F) Heatmap showing the relations between the module and the 14Genes defined high- and low- risk group, the Tan module was highly related to 14Gene defined risk group (as shown in the red border); (H) Functional annotation of the KEGG signaling pathway of signature genes; and (I) GO functional annotation of signature genes. For all enriched GO and KEGG terms, P < .05.
Figure 5
Figure 5
(A-C) Integrated discrimination improvement (IDI) and Net reclassification improvement (NRI) were calculated to compare the predictive accuracy of the 4 selected markers for 1-year, 3-year, and 5- year (* P < .05); (D-F) Decision curve analysis from the training and validating group for recurrence-free survival. (G-I) Decision Tree construction for TCGA and its subgroup, GSE(Met), GSE(BCR); (J-L) The variable importance bar plot shows that the 14Gene model ranked highest in the TCGA and GSE (Met) cohorts and second in the GSE (BCR) cohort (highlighted in the red border).
Figure 6
Figure 6
Construction and validation of a Nomogram (A) The nomogram predicting 1-year, 3-year, and 5-year year survival; (B) forest plot of Cox regression model; (C) calibration plots of the nomogram showed that the predicted 1-year, 3-year, and 5-year survival probabilities of the RFS almost identical to the actual observations.

References

    1. Siegel RL, Miller KD, Wagle NS, Jemal A. Cancer statistics, 2023. CA Cancer J Clin. 2023;73:17–48. - PubMed
    1. Laughlin BS, Silva AC, Vora SA, et al. Long-term outcomes of prostate intensity-modulated radiation therapy incorporating a simultaneous intra-prostatic MRI-directed boost. Front Oncol. 2022;12 - PMC - PubMed
    1. Kogionou P, Fortis S, Goulielmaki M, et al. Radiotherapy-related gene signature in prostate cancer. Cancers. 2022;14(20):1–15. - PMC - PubMed
    1. Ahmed KA, Caudell JJ, El-Haddad G, et al. Radiosensitivity differences between liver metastases based on primary histology suggest implications for clinical outcomes after stereotactic body radiation therapy. Int J Radiat Oncol Biol Phys. 2016;95(5):1399–1404. - PMC - PubMed
    1. Zhao SG, Chang SL, Spratt DE, et al. Development and validation of a 24-gene predictor of response to postoperative radiotherapy in prostate cancer: a matched, retrospective analysis. Lancet Oncol. 2016;17(11):1612–1620. - PubMed

LinkOut - more resources